| Param | Original file | Final file |
|---|---|---|
| Filename | modeM0/AS1T05_102T01_9000005634_41226cztM0_level2.fits | modeM0/AS1T05_102T01_9000005634_41226cztM0_level2_quad_clean.evt |
| Size (bytes) | 271,391,040 | 57,614,400 |
| Size | 258.8 MB | 54.9 MB |
| Events in quadrant A | 4,513,549 | 305,739 |
| Events in quadrant B | 1,626,032 | 420,822 |
| Events in quadrant C | 1,963,045 | 401,428 |
| Events in quadrant D | 1,671,877 | 370,736 |
| Mode M9 | |||
|---|---|---|---|
| Quadrant | BADHDUFLAG | Total packets | Discarded packets |
| A | 0 | 18 | 0 |
| B | 0 | 18 | 0 |
| C | 0 | 18 | 0 |
| D | 0 | 18 | 0 |
| Mode M0 | |||
|---|---|---|---|
| Quadrant | BADHDUFLAG | Total packets | Discarded packets |
| A | 0 | 15914 | 2 |
| B | 0 | 7042 | 1 |
| C | 0 | 7907 | 1 |
| D | 0 | 7177 | 1 |
| Mode SS | |||
|---|---|---|---|
| Quadrant | BADHDUFLAG | Total packets | Discarded packets |
| A | 0 | 72 | 0 |
| B | 0 | 72 | 0 |
| C | 0 | 72 | 0 |
| D | 0 | 72 | 0 |
| Quadrant | Total seconds | Saturated seconds | Saturation percentage |
|---|---|---|---|
| A | 3470 | 945 | 27.233429% |
| B | 3470 | 12 | 0.345821% |
| C | 3470 | 14 | 0.403458% |
| D | 3470 | 10 | 0.288184% |
Noise dominated data is calculated using 1-second bins in cleaned event files. If a bin has >2000 counts, and if more than 50% of those come from <1% of pixels, then it is considered to be noise-dominated and hence unusable.
| Quadrant | # 1 sec bins | Bins with >0 counts | Bins with >2000 counts | High rate bins dominated by noise | Noise dominated (total time) | Noise dominated (detector-on time) | Marked lightcurve |
|---|---|---|---|---|---|---|---|
| A | 5323 | 3470 | 915 | 915 | 17.19% | 26.37% | 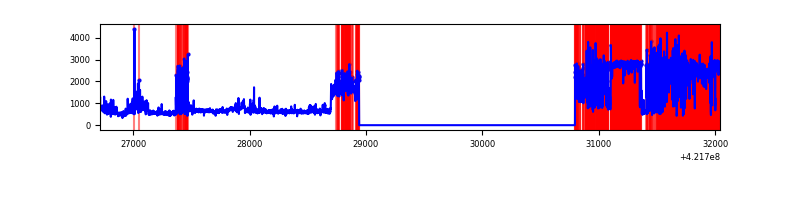 |
| B | 5324 | 3471 | 6 | 6 | 0.11% | 0.17% | 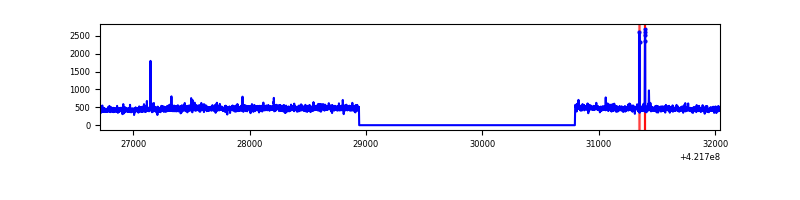 |
| C | 5324 | 3471 | 12 | 12 | 0.23% | 0.35% | 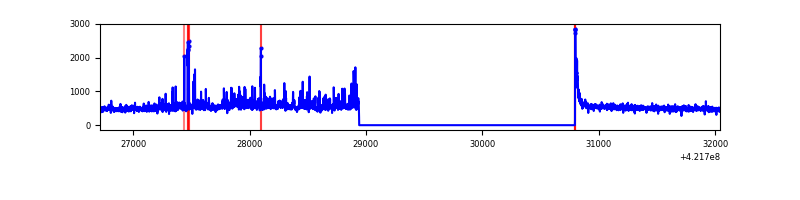 |
| D | 5324 | 3471 | 10 | 10 | 0.19% | 0.29% | 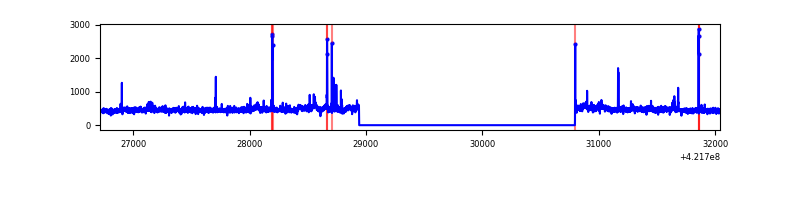 |
Top three noisy pixels from each quadrant. If the there are fewer than three noisy pixels in the level2.evt file, extra rows are filled as -1
| Pixel properties | Quadrant properties | ||||||
|---|---|---|---|---|---|---|---|
| Quadrant | DetID | PixID | Counts | Sigma | Mean | Median | Sigma |
| A | 0 | 8 | 2835023 | 38313.05 | 354 | 346 | 74.0 |
| A | 10 | 83 | 257655 | 3477.75 | 354 | 346 | 74.0 |
| A | 12 | 189 | 29737 | 397.24 | 354 | 346 | 74.0 |
| B | 0 | 229 | 39245 | 494.62 | 400 | 389 | 78.6 |
| B | 15 | 35 | 13130 | 162.19 | 400 | 389 | 78.6 |
| B | 12 | 111 | 9807 | 119.89 | 400 | 389 | 78.6 |
| C | 9 | 54 | 233667 | 2521.8 | 394 | 397 | 92.5 |
| C | 15 | 214 | 148102 | 1596.79 | 394 | 397 | 92.5 |
| C | 0 | 10 | 42926 | 459.77 | 394 | 397 | 92.5 |
| D | 13 | 249 | 48113 | 480.35 | 398 | 386 | 99.4 |
| D | 8 | 230 | 30609 | 304.18 | 398 | 386 | 99.4 |
| D | 12 | 79 | 23642 | 234.06 | 398 | 386 | 99.4 |
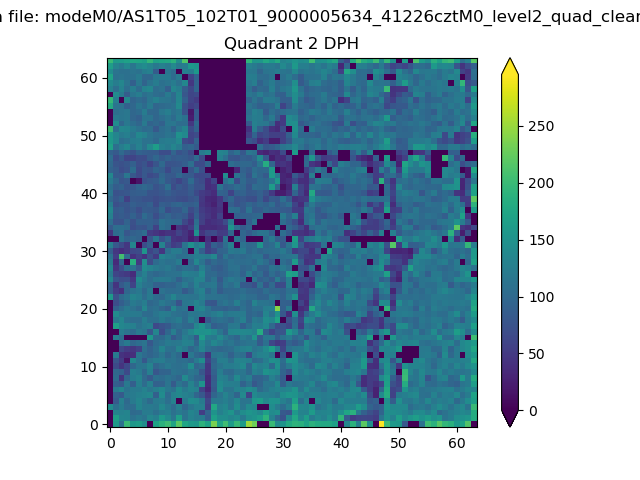
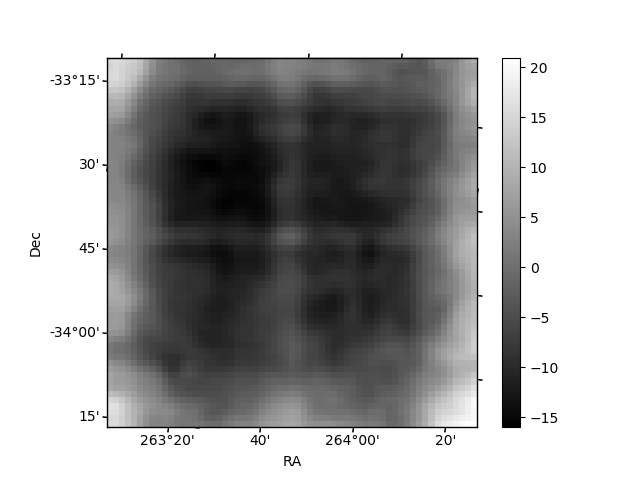
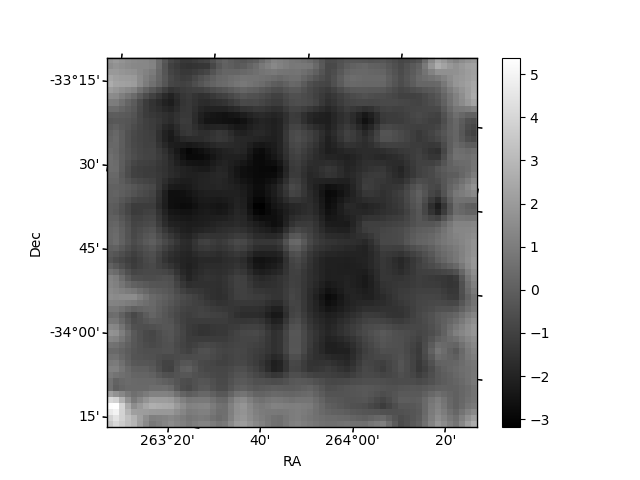
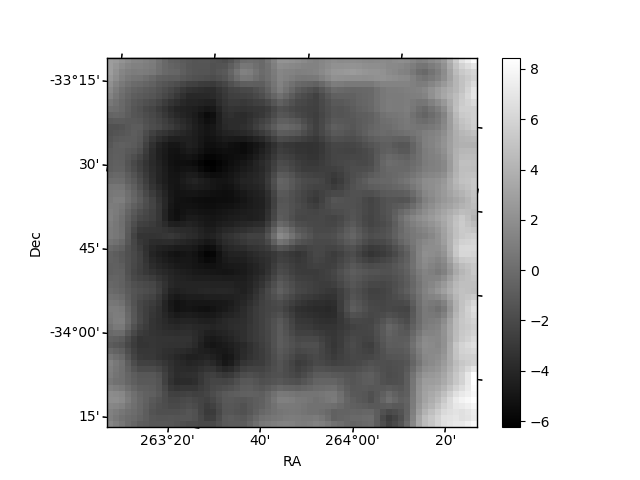
Histogram calculated using DETX and DETY for each event in the final _common_clean file
| Quadrant A | 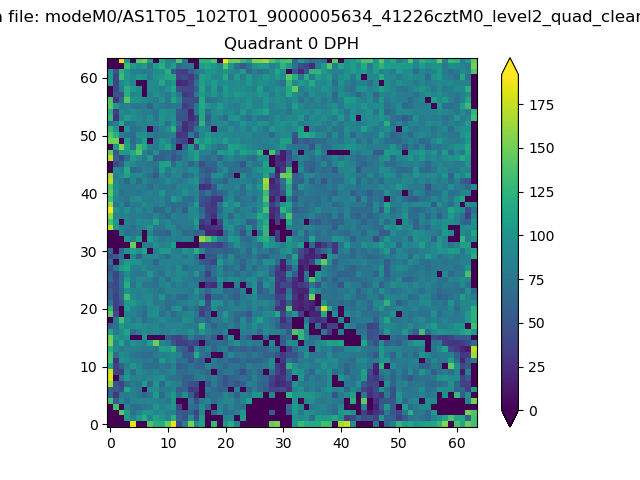 |
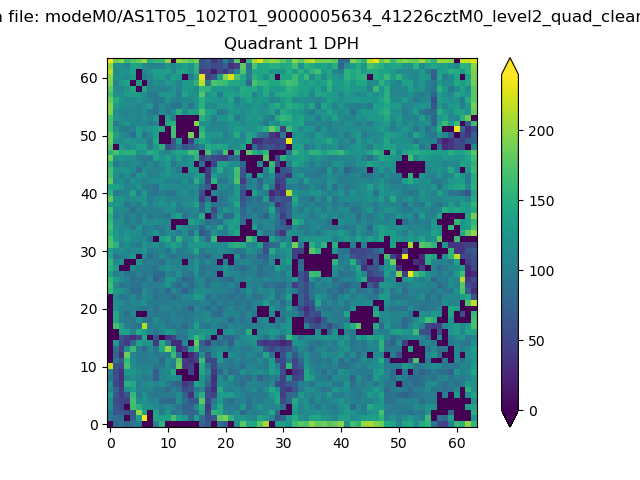 |
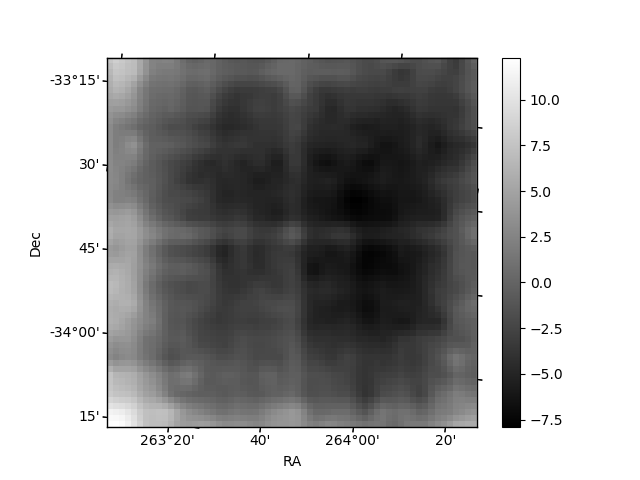
Quadrant B |
|---|---|---|---|
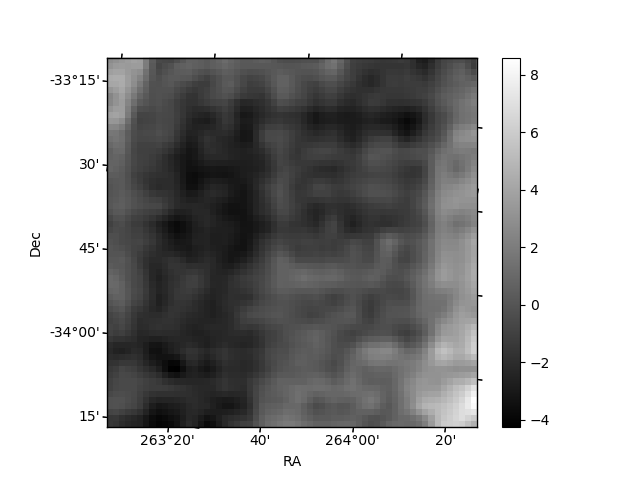
| Quadrant D | 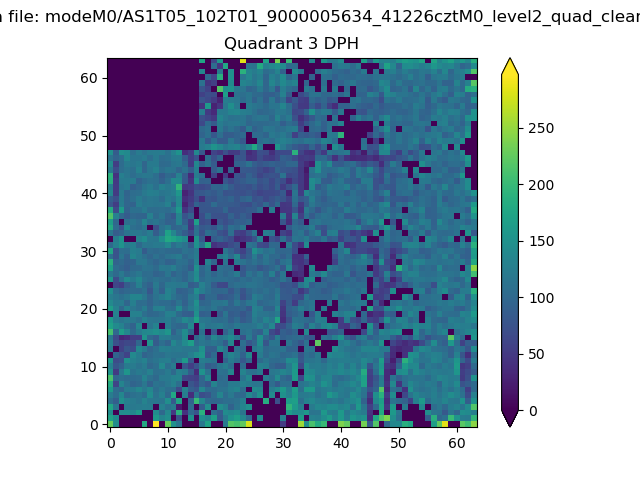 |
 |
Quadrant C |
| Plot type | Count rate plots | Images |
|---|---|---|
| Comparison with Poisson distribution Blue bars denote a histogram of data divided into 1 sec bins. Red curve is a Poisson curve with rate = median count rate of data. |
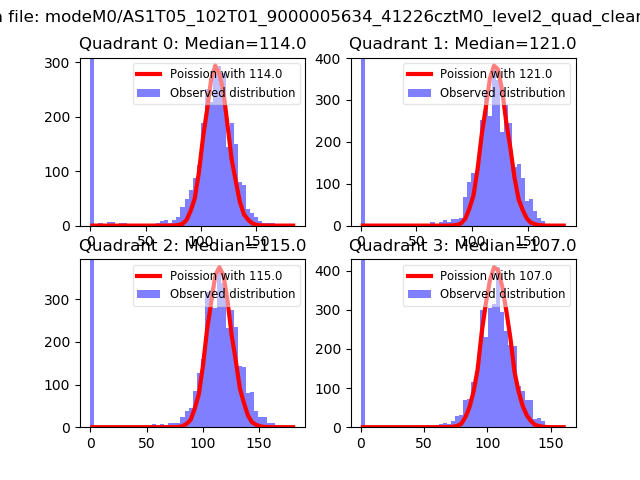 |
 |
| Quadrant-wise count rates Data is divided into 100 sec bins |
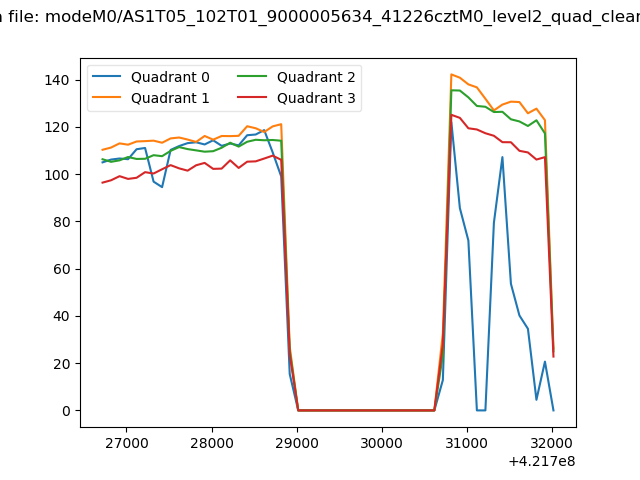 |
|
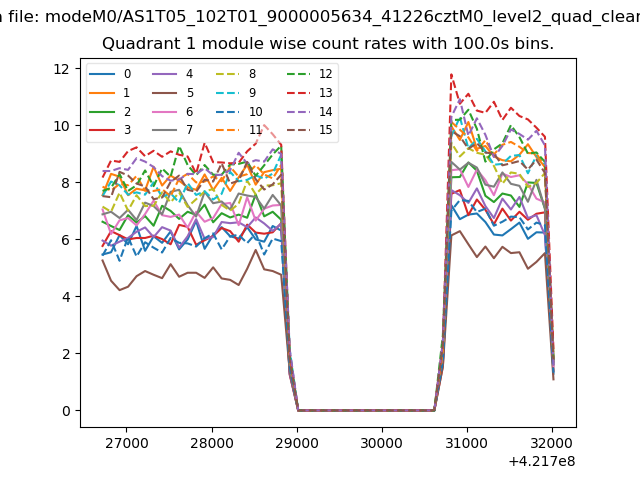
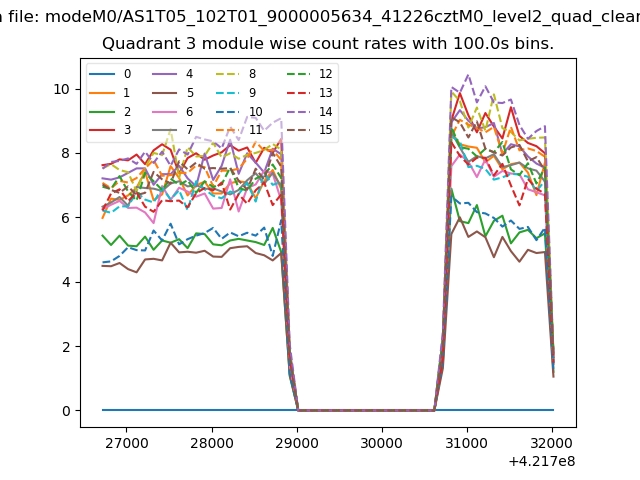
| Module-wise count rates for Quadrant A Data is divided into 100 sec bins |
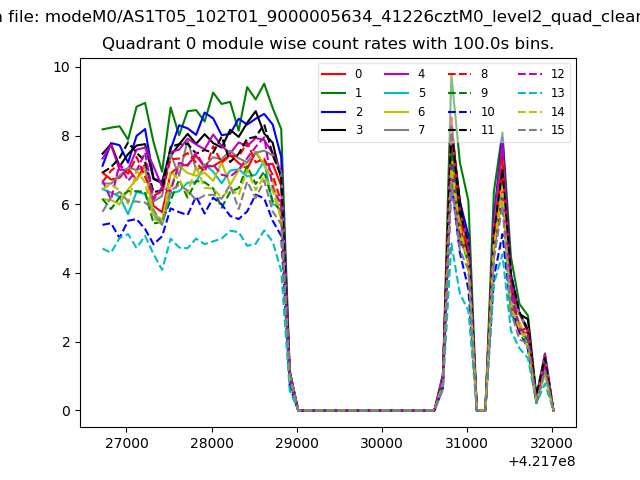 |
 |
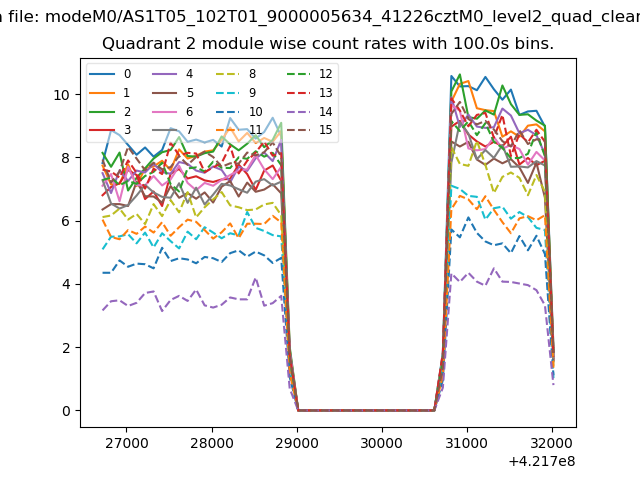
| Module-wise count rates for Quadrant B Data is divided into 100 sec bins |
 |
 |
| Module-wise count rates for Quadrant C Data is divided into 100 sec bins |
 |
 |
| Module-wise count rates for Quadrant D Data is divided into 100 sec bins |
 |
 |
| Parameter | Plot |
|---|---|
| CZT HV Monitor | 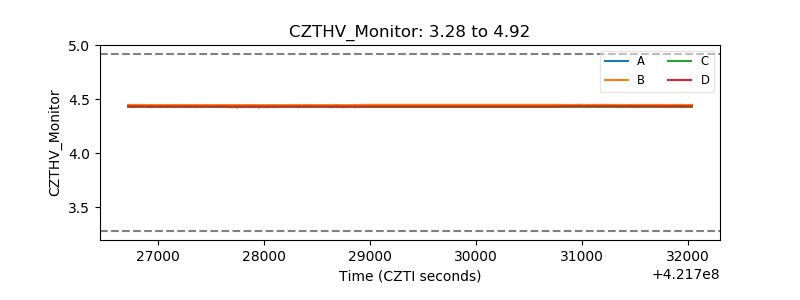 |
| D_VDD | 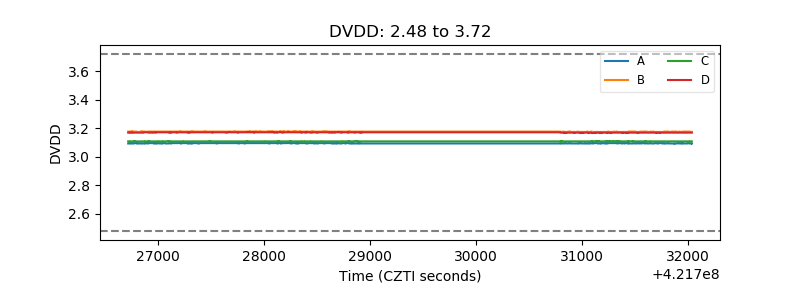 |
| Temperature 1 | 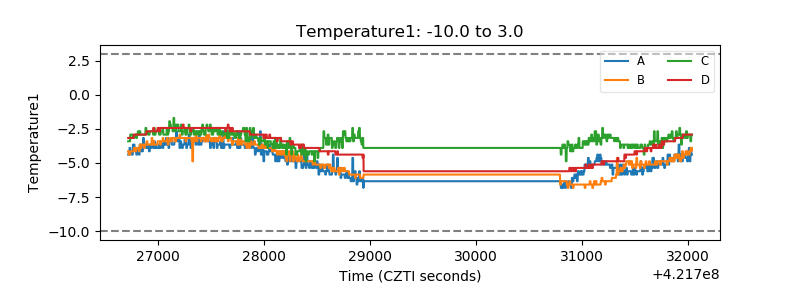 |
| Veto HV Monitor | 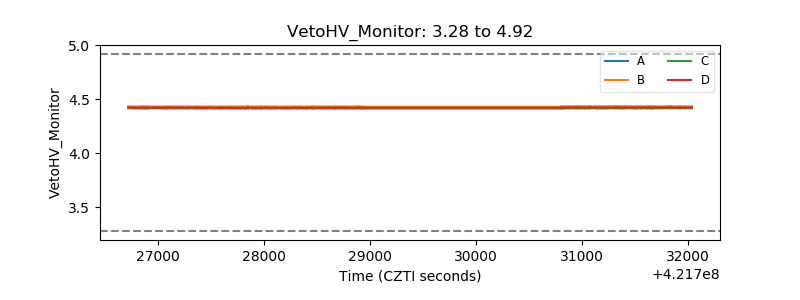 |
| Veto LLD | 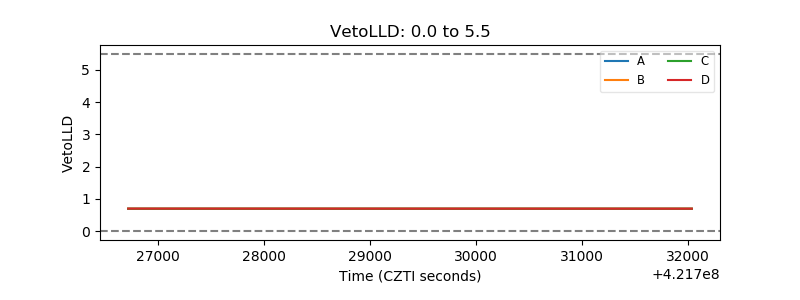 |
| Alpha Counter | 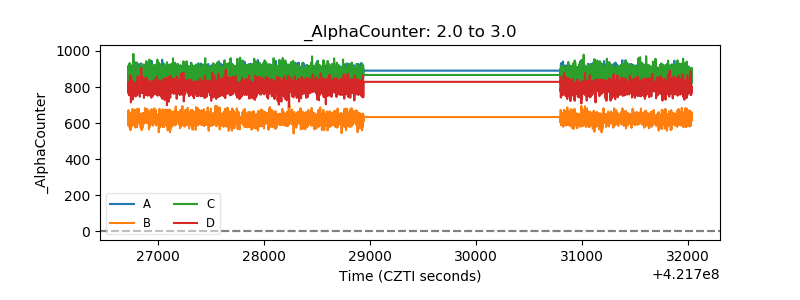 |
| _CPM_Rate | 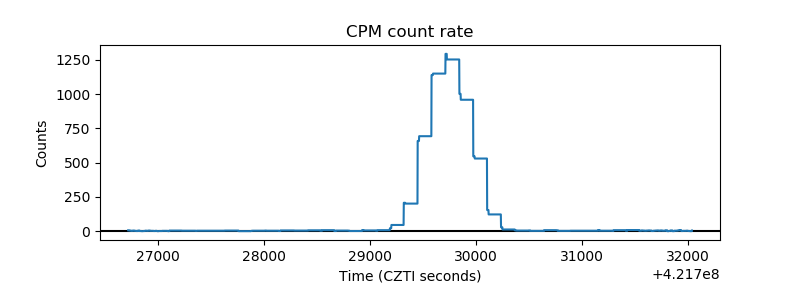 |
| CZT Counter | 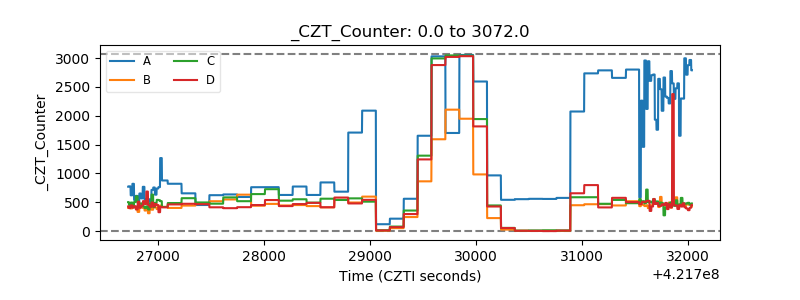 |
| +2.5 Volts monitor | 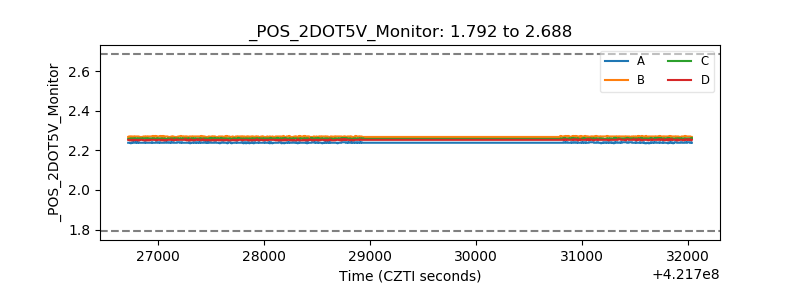 |
| +5 Volts monitor | 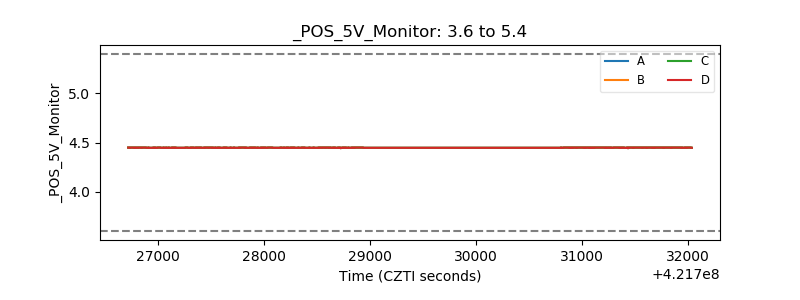 |
| _ROLL_ROT | 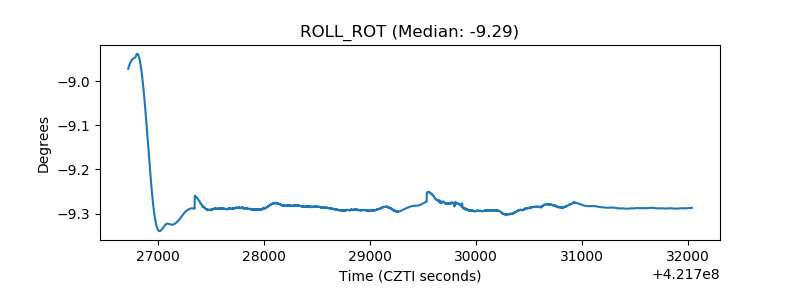 |
| _Roll_DEC | 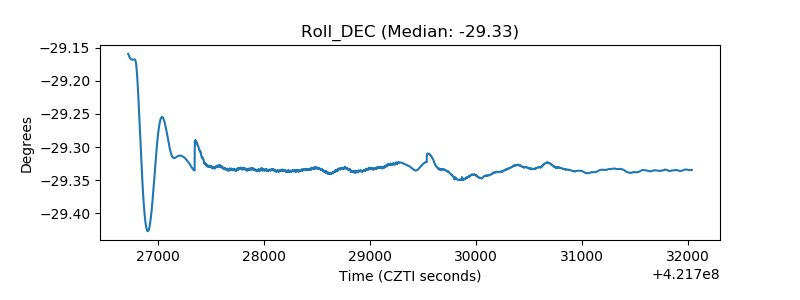 |
| _Roll_RA | 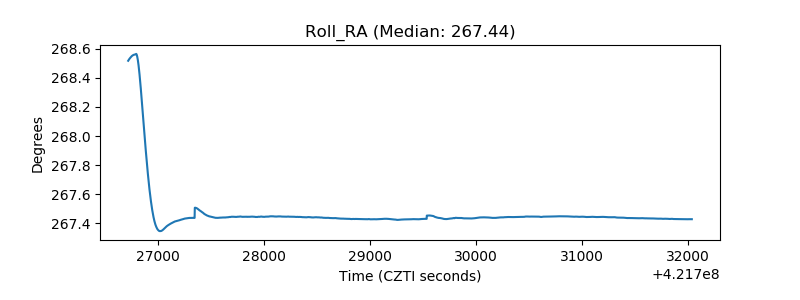 |
| Veto Counter | 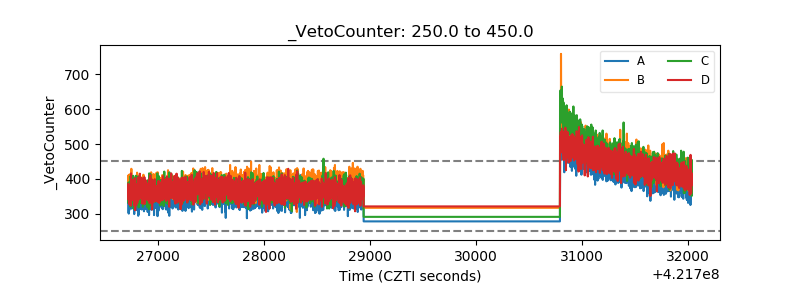 |