| Param | Original file | Final file |
|---|---|---|
| Filename | modeM0/AS1T05_102T01_9000005634_41227cztM0_level2.fits | modeM0/AS1T05_102T01_9000005634_41227cztM0_level2_quad_clean.evt |
| Size (bytes) | 379,532,160 | 79,248,960 |
| Size | 362.0 MB | 75.6 MB |
| Events in quadrant A | 5,132,735 | 460,849 |
| Events in quadrant B | 3,318,231 | 561,225 |
| Events in quadrant C | 2,658,327 | 546,938 |
| Events in quadrant D | 2,577,755 | 504,540 |
| Mode M9 | |||
|---|---|---|---|
| Quadrant | BADHDUFLAG | Total packets | Discarded packets |
| A | 0 | 20 | 0 |
| B | 0 | 20 | 0 |
| C | 0 | 20 | 0 |
| D | 0 | 20 | 0 |
| Mode M0 | |||
|---|---|---|---|
| Quadrant | BADHDUFLAG | Total packets | Discarded packets |
| A | 0 | 18225 | 2 |
| B | 0 | 12863 | 1 |
| C | 0 | 10609 | 1 |
| D | 0 | 10590 | 1 |
| Mode SS | |||
|---|---|---|---|
| Quadrant | BADHDUFLAG | Total packets | Discarded packets |
| A | 0 | 94 | 0 |
| B | 0 | 94 | 0 |
| C | 0 | 94 | 0 |
| D | 0 | 94 | 0 |
| Quadrant | Total seconds | Saturated seconds | Saturation percentage |
|---|---|---|---|
| A | 4649 | 945 | 20.326952% |
| B | 4649 | 249 | 5.355991% |
| C | 4649 | 81 | 1.742310% |
| D | 4649 | 65 | 1.398150% |
Noise dominated data is calculated using 1-second bins in cleaned event files. If a bin has >2000 counts, and if more than 50% of those come from <1% of pixels, then it is considered to be noise-dominated and hence unusable.
| Quadrant | # 1 sec bins | Bins with >0 counts | Bins with >2000 counts | High rate bins dominated by noise | Noise dominated (total time) | Noise dominated (detector-on time) | Marked lightcurve |
|---|---|---|---|---|---|---|---|
| A | 6623 | 4650 | 916 | 916 | 13.83% | 19.70% | 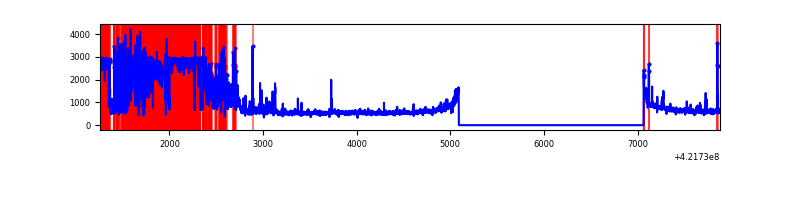 |
| B | 6623 | 4650 | 172 | 172 | 2.60% | 3.70% | 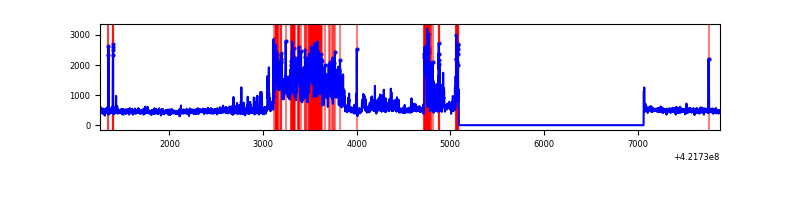 |
| C | 6623 | 4650 | 73 | 73 | 1.10% | 1.57% | 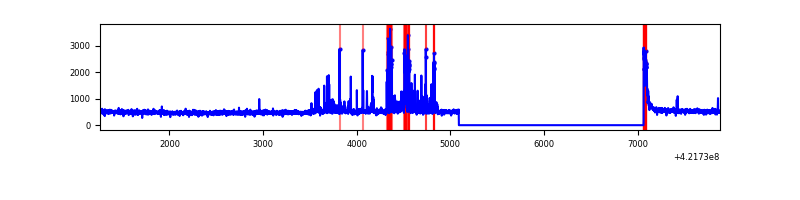 |
| D | 6623 | 4650 | 66 | 66 | 1.00% | 1.42% | 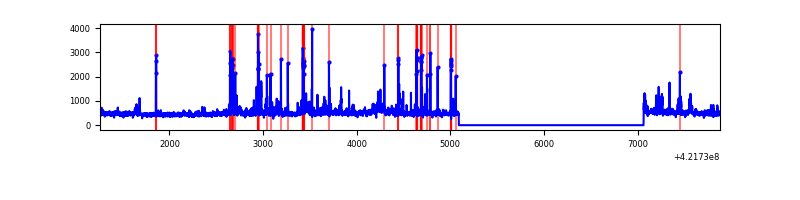 |
Top three noisy pixels from each quadrant. If the there are fewer than three noisy pixels in the level2.evt file, extra rows are filled as -1
| Pixel properties | Quadrant properties | ||||||
|---|---|---|---|---|---|---|---|
| Quadrant | DetID | PixID | Counts | Sigma | Mean | Median | Sigma |
| A | 0 | 8 | 2828912 | 28263.38 | 490 | 479 | 100.1 |
| A | 10 | 83 | 365499 | 3647.5 | 490 | 479 | 100.1 |
| A | 2 | 79 | 33101 | 325.98 | 490 | 479 | 100.1 |
| B | 0 | 186 | 723903 | 7021.01 | 532 | 518 | 103.0 |
| B | 5 | 255 | 195012 | 1887.71 | 532 | 518 | 103.0 |
| B | 0 | 190 | 155896 | 1508.06 | 532 | 518 | 103.0 |
| C | 9 | 54 | 312042 | 2513.14 | 531 | 535 | 124.0 |
| C | 15 | 214 | 195676 | 1574.33 | 531 | 535 | 124.0 |
| C | 0 | 10 | 81717 | 654.95 | 531 | 535 | 124.0 |
| D | 13 | 249 | 319117 | 2431.09 | 533 | 520 | 131.1 |
| D | 1 | 52 | 78623 | 595.97 | 533 | 520 | 131.1 |
| D | 2 | 249 | 50957 | 384.87 | 533 | 520 | 131.1 |
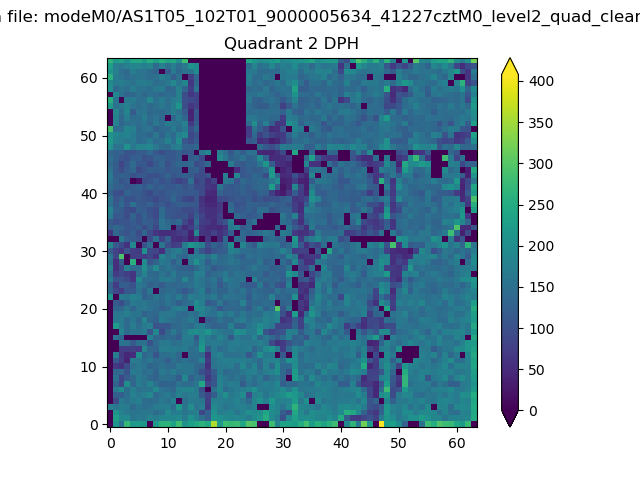
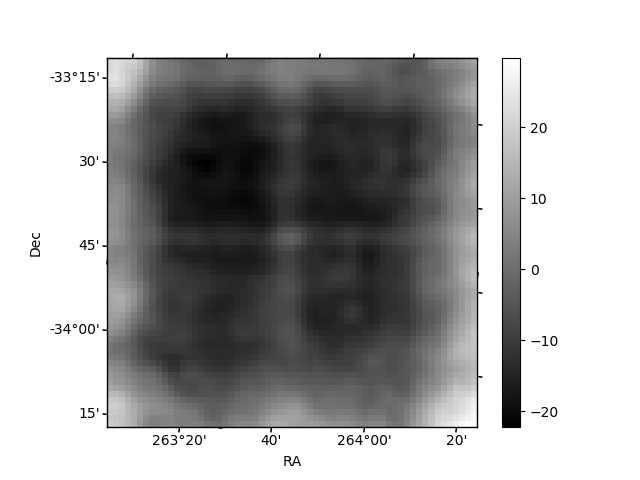
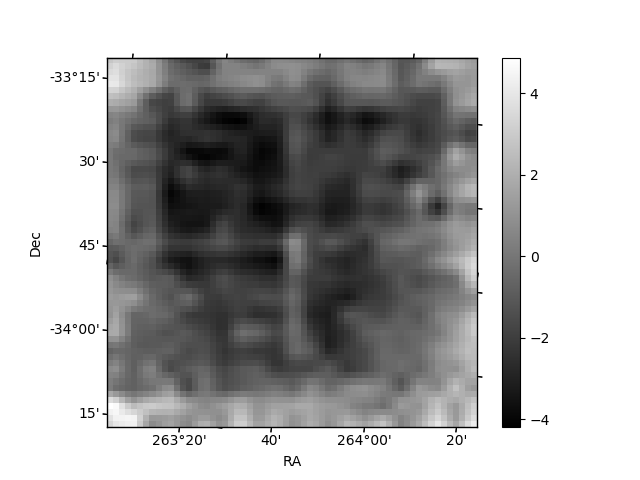
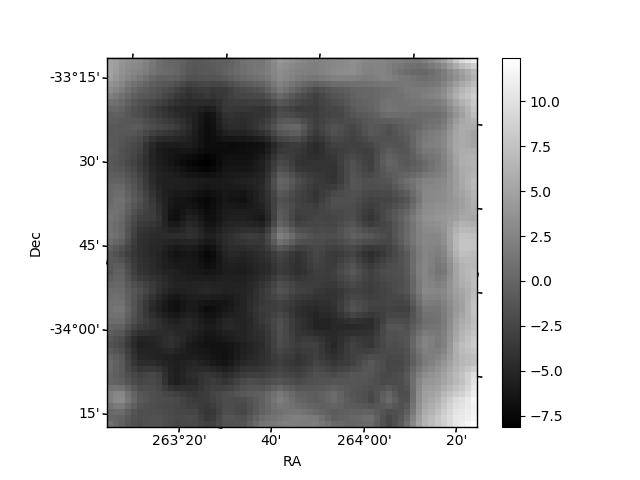
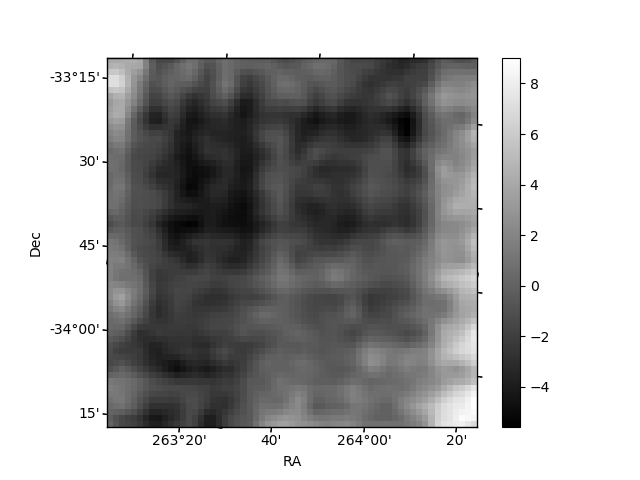
Histogram calculated using DETX and DETY for each event in the final _common_clean file
| Quadrant A | 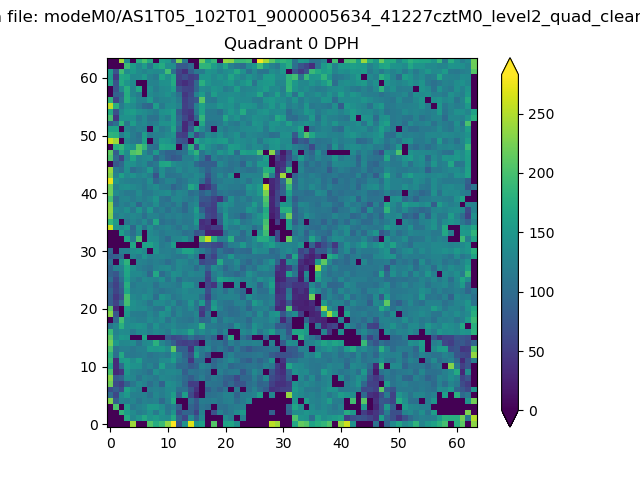 |
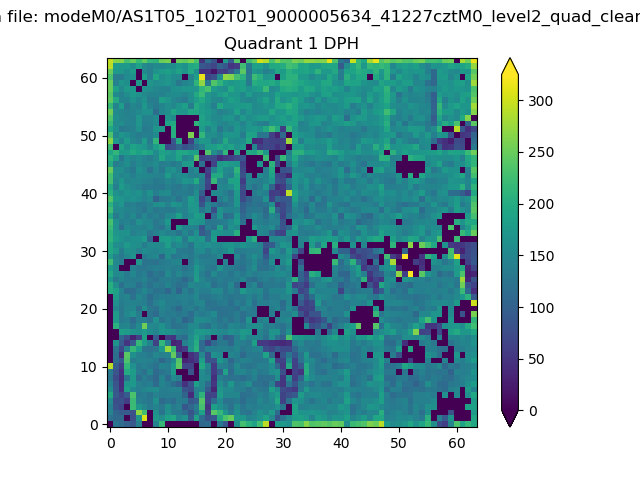 |
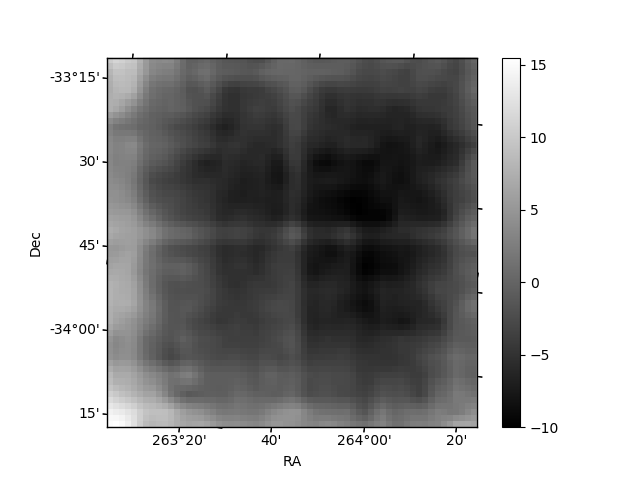
Quadrant B |
|---|---|---|---|
| Quadrant D | 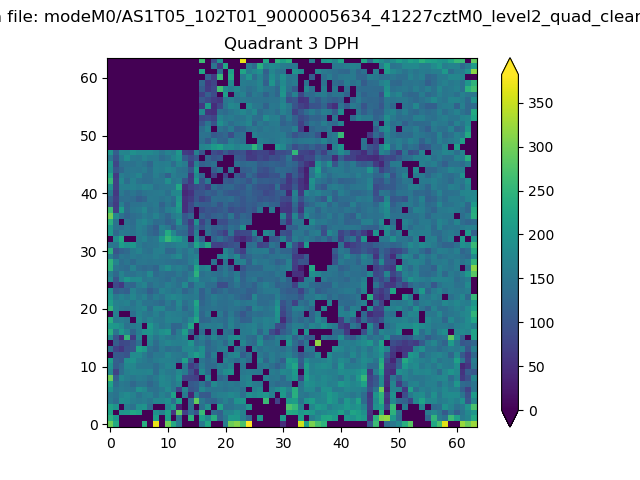 |
 |
Quadrant C |
| Plot type | Count rate plots | Images |
|---|---|---|
| Comparison with Poisson distribution Blue bars denote a histogram of data divided into 1 sec bins. Red curve is a Poisson curve with rate = median count rate of data. |
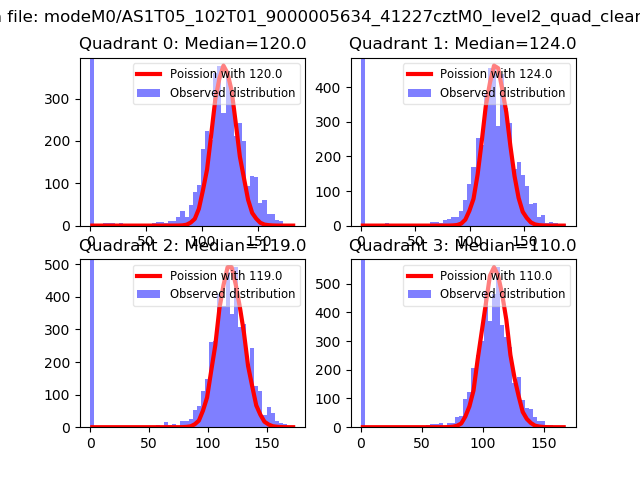 |
 |
| Quadrant-wise count rates Data is divided into 100 sec bins |
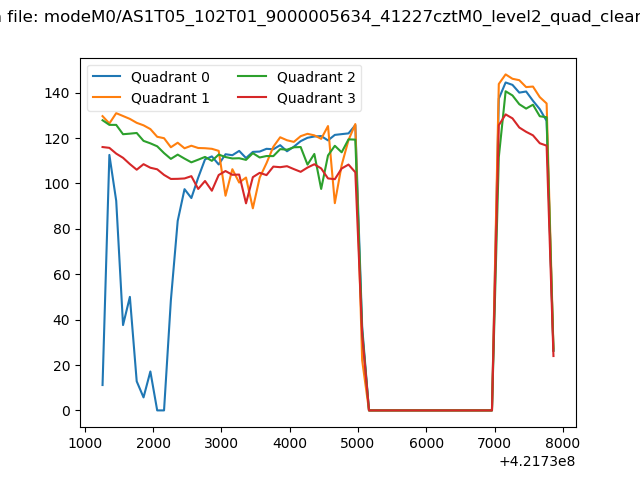 |
|
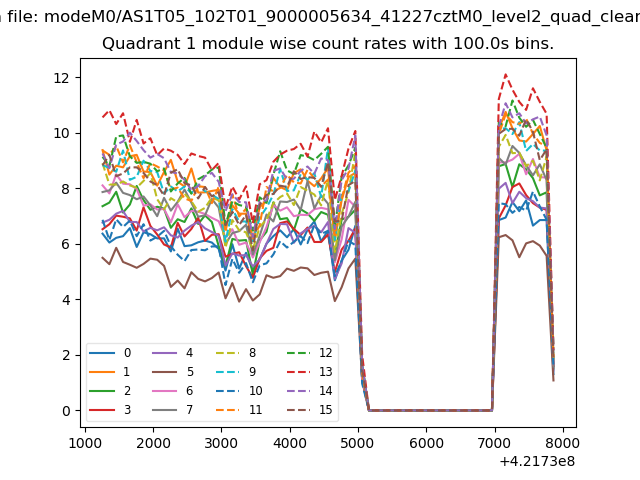
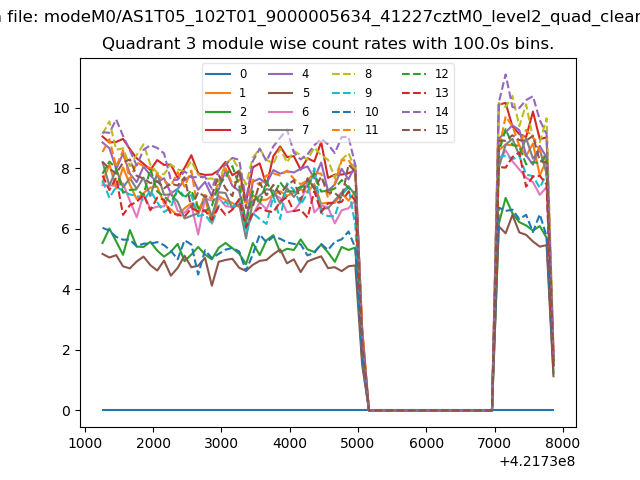
| Module-wise count rates for Quadrant A Data is divided into 100 sec bins |
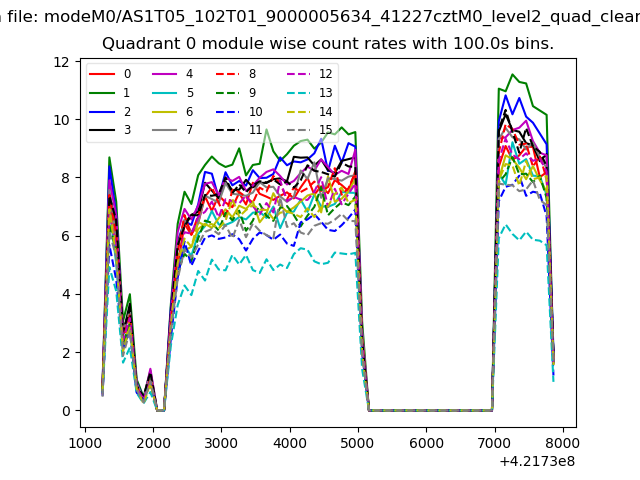 |
 |
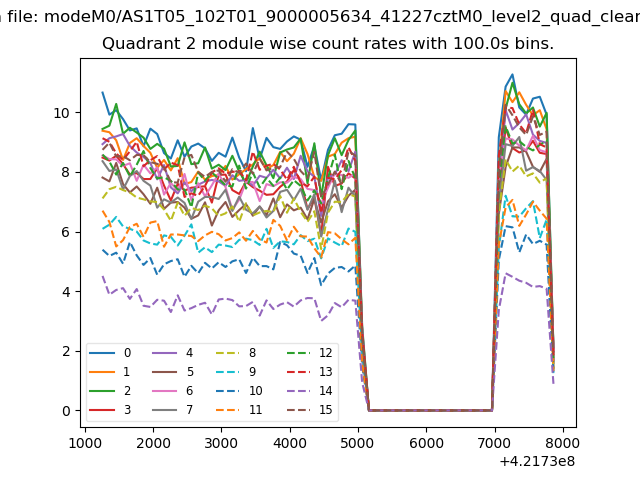
| Module-wise count rates for Quadrant B Data is divided into 100 sec bins |
 |
 |
| Module-wise count rates for Quadrant C Data is divided into 100 sec bins |
 |
 |
| Module-wise count rates for Quadrant D Data is divided into 100 sec bins |
 |
 |
| Parameter | Plot |
|---|---|
| CZT HV Monitor | 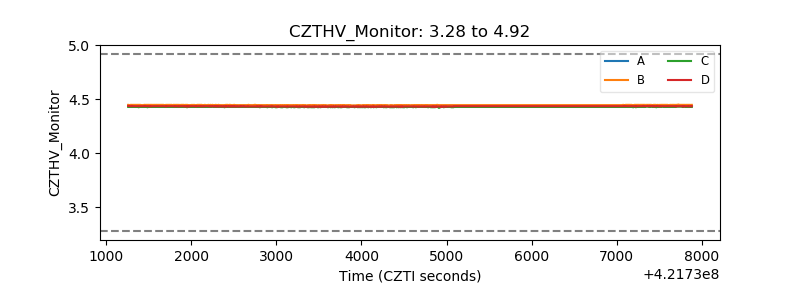 |
| D_VDD | 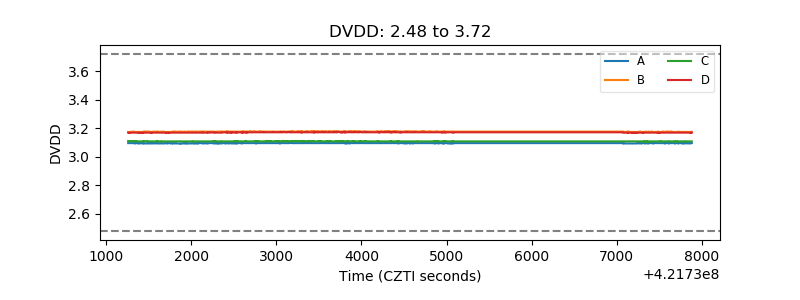 |
| Temperature 1 | 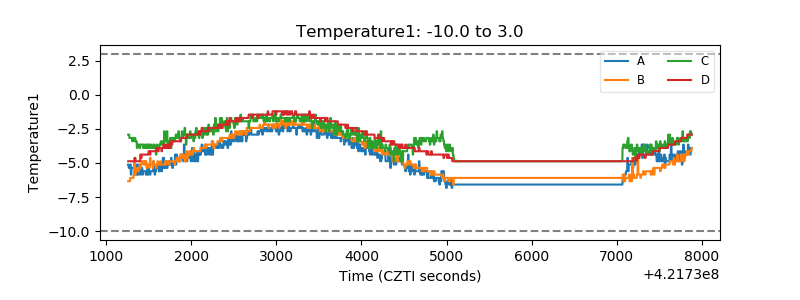 |
| Veto HV Monitor | 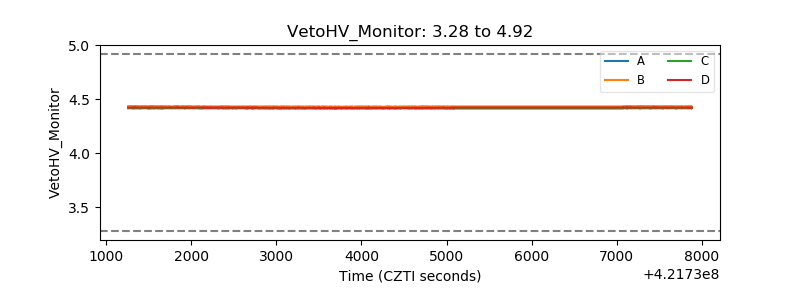 |
| Veto LLD | 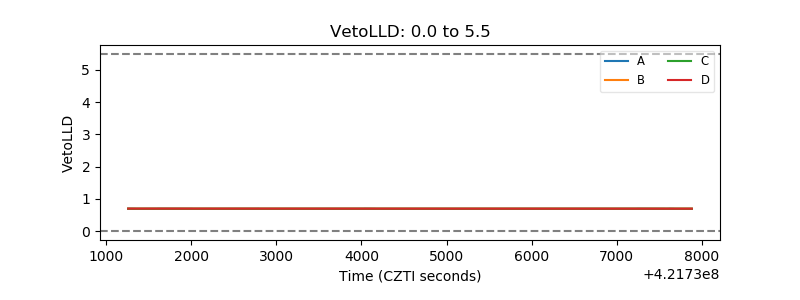 |
| Alpha Counter | 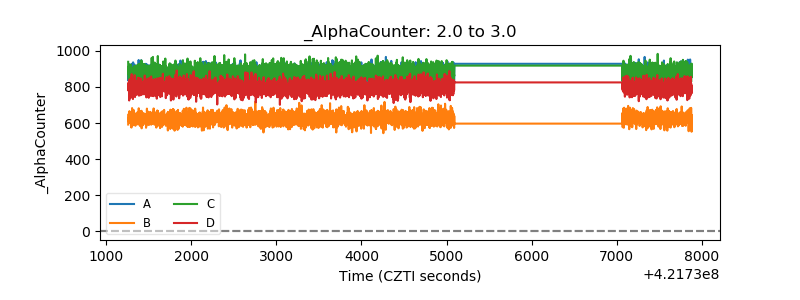 |
| _CPM_Rate | 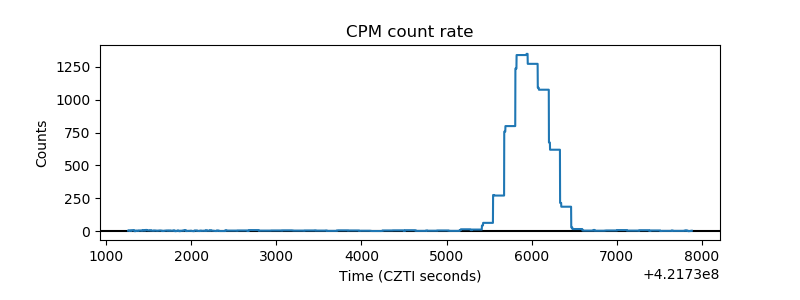 |
| CZT Counter | 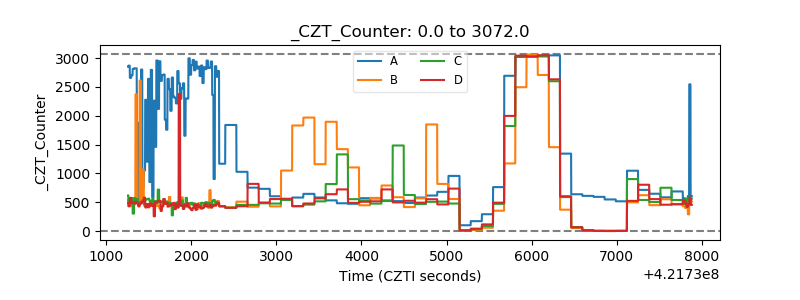 |
| +2.5 Volts monitor | 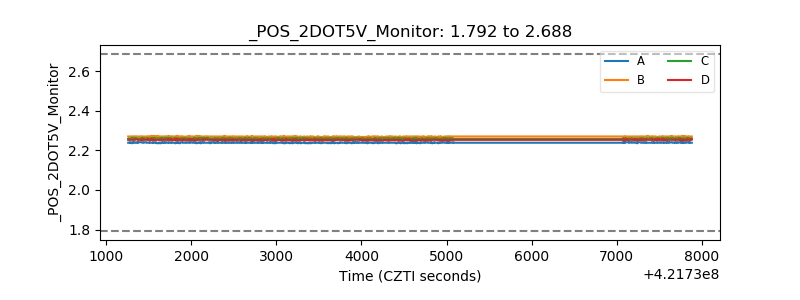 |
| +5 Volts monitor |  |
| _ROLL_ROT | 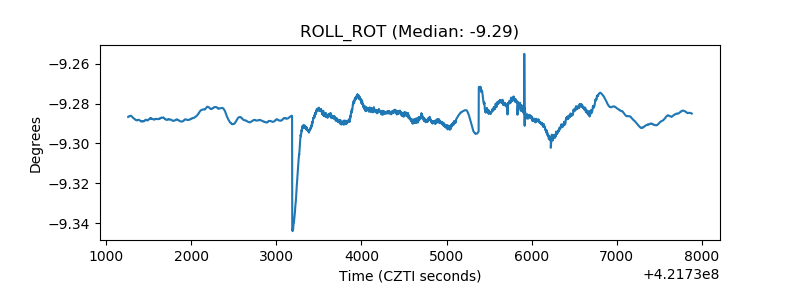 |
| _Roll_DEC | 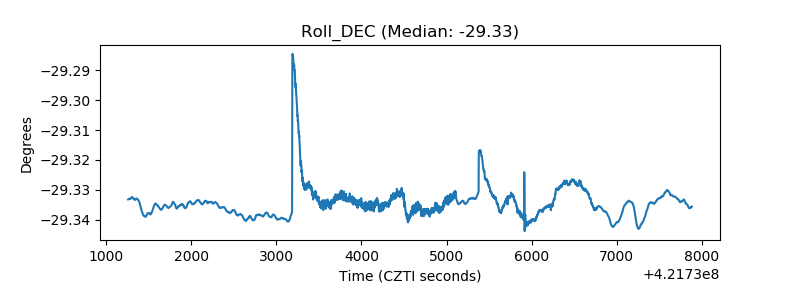 |
| _Roll_RA | 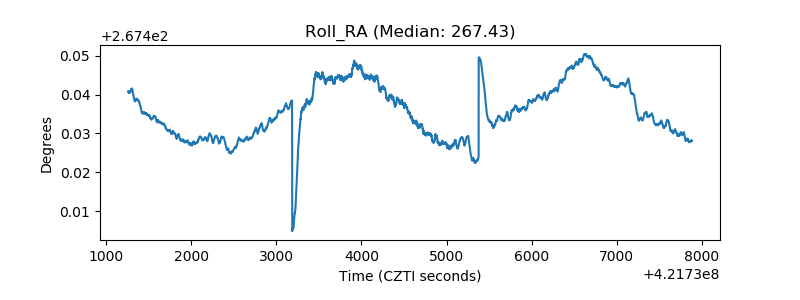 |
| Veto Counter | 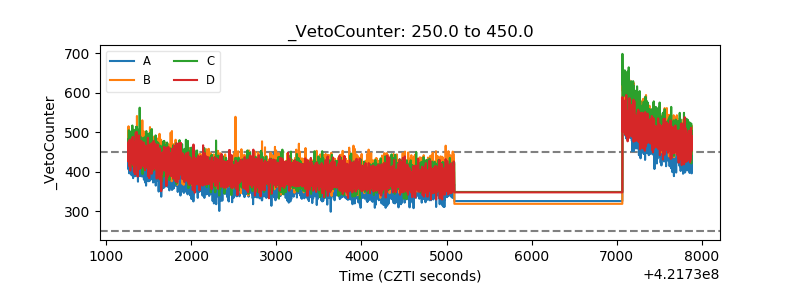 |