| Param | Original file | Final file |
|---|---|---|
| Filename | modeM0/AS1T05_102T01_9000005634_41228cztM0_level2.fits | modeM0/AS1T05_102T01_9000005634_41228cztM0_level2_quad_clean.evt |
| Size (bytes) | 344,018,880 | 93,646,080 |
| Size | 328.1 MB | 89.3 MB |
| Events in quadrant A | 3,295,308 | 644,834 |
| Events in quadrant B | 3,433,561 | 636,845 |
| Events in quadrant C | 2,856,672 | 619,151 |
| Events in quadrant D | 2,751,290 | 577,204 |
| Mode M9 | |||
|---|---|---|---|
| Quadrant | BADHDUFLAG | Total packets | Discarded packets |
| A | 0 | 32 | 0 |
| B | 0 | 32 | 0 |
| C | 0 | 32 | 0 |
| D | 0 | 33 | 0 |
| Mode M0 | |||
|---|---|---|---|
| Quadrant | BADHDUFLAG | Total packets | Discarded packets |
| A | 0 | 12985 | 5 |
| B | 0 | 13352 | 2 |
| C | 0 | 11325 | 2 |
| D | 0 | 11391 | 2 |
| Mode SS | |||
|---|---|---|---|
| Quadrant | BADHDUFLAG | Total packets | Discarded packets |
| A | 0 | 104 | 0 |
| B | 0 | 104 | 0 |
| C | 0 | 104 | 0 |
| D | 0 | 104 | 0 |
| Quadrant | Total seconds | Saturated seconds | Saturation percentage |
|---|---|---|---|
| A | 5106 | 35 | 0.685468% |
| B | 5107 | 291 | 5.698061% |
| C | 5107 | 91 | 1.781868% |
| D | 5107 | 53 | 1.037791% |
Noise dominated data is calculated using 1-second bins in cleaned event files. If a bin has >2000 counts, and if more than 50% of those come from <1% of pixels, then it is considered to be noise-dominated and hence unusable.
| Quadrant | # 1 sec bins | Bins with >0 counts | Bins with >2000 counts | High rate bins dominated by noise | Noise dominated (total time) | Noise dominated (detector-on time) | Marked lightcurve |
|---|---|---|---|---|---|---|---|
| A | 7200 | 5108 | 25 | 25 | 0.35% | 0.49% | 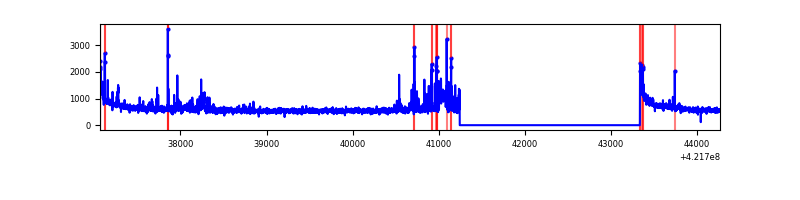 |
| B | 7200 | 5108 | 207 | 207 | 2.88% | 4.05% | 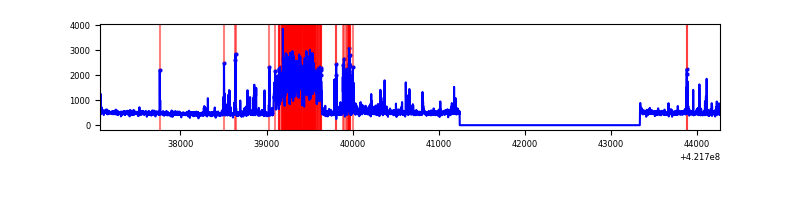 |
| C | 7200 | 5108 | 94 | 94 | 1.31% | 1.84% | 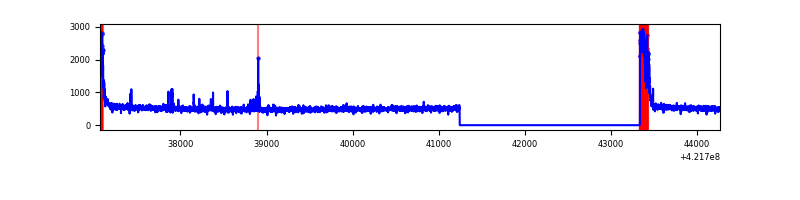 |
| D | 7200 | 5108 | 49 | 49 | 0.68% | 0.96% | 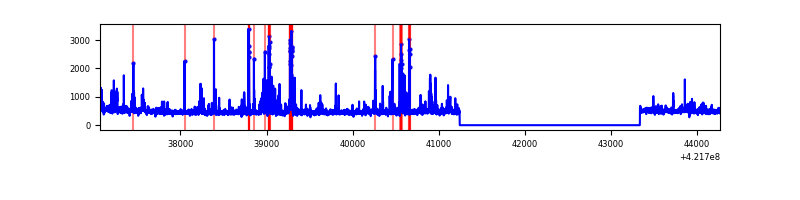 |
Top three noisy pixels from each quadrant. If the there are fewer than three noisy pixels in the level2.evt file, extra rows are filled as -1
| Pixel properties | Quadrant properties | ||||||
|---|---|---|---|---|---|---|---|
| Quadrant | DetID | PixID | Counts | Sigma | Mean | Median | Sigma |
| A | 10 | 83 | 513749 | 4110.92 | 617 | 606 | 124.8 |
| A | 0 | 8 | 359840 | 2877.92 | 617 | 606 | 124.8 |
| A | 2 | 79 | 21364 | 166.29 | 617 | 606 | 124.8 |
| B | 0 | 186 | 741883 | 6501.2 | 599 | 583 | 114.0 |
| B | 5 | 255 | 188218 | 1645.56 | 599 | 583 | 114.0 |
| B | 0 | 190 | 60774 | 527.88 | 599 | 583 | 114.0 |
| C | 0 | 10 | 294235 | 2121.17 | 594 | 600 | 138.4 |
| C | 15 | 214 | 219963 | 1584.64 | 594 | 600 | 138.4 |
| C | 9 | 54 | 30004 | 212.41 | 594 | 600 | 138.4 |
| D | 13 | 249 | 295891 | 2029.24 | 600 | 584 | 145.5 |
| D | 2 | 249 | 52924 | 359.66 | 600 | 584 | 145.5 |
| D | 5 | 222 | 43453 | 294.58 | 600 | 584 | 145.5 |
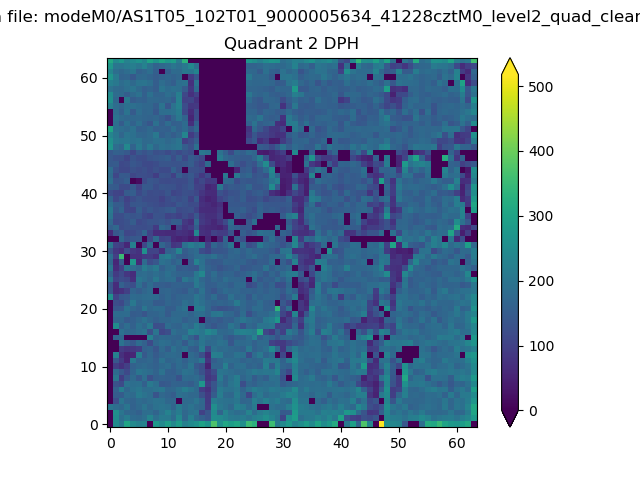
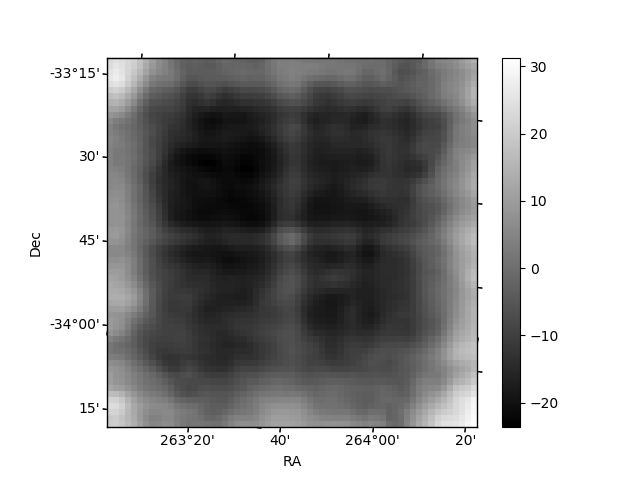
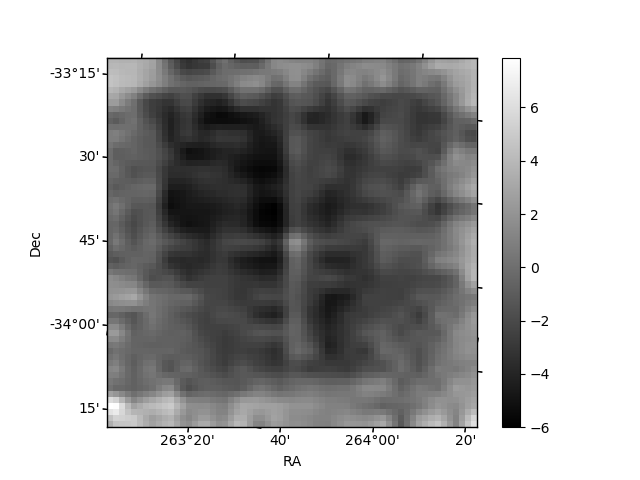
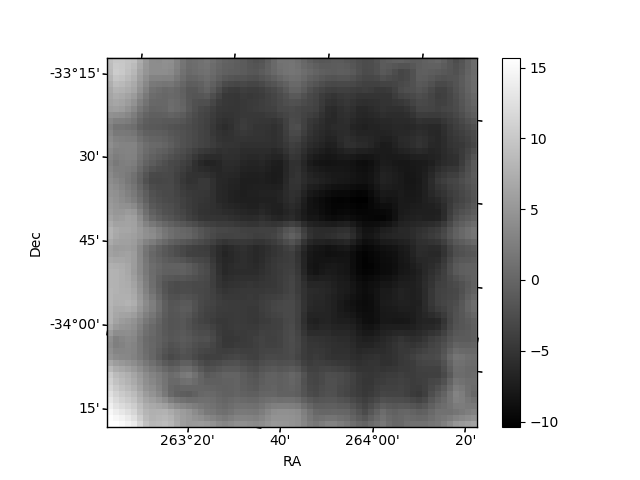
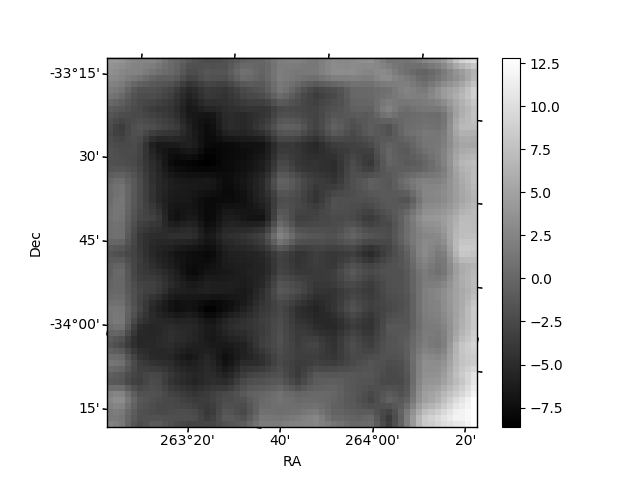
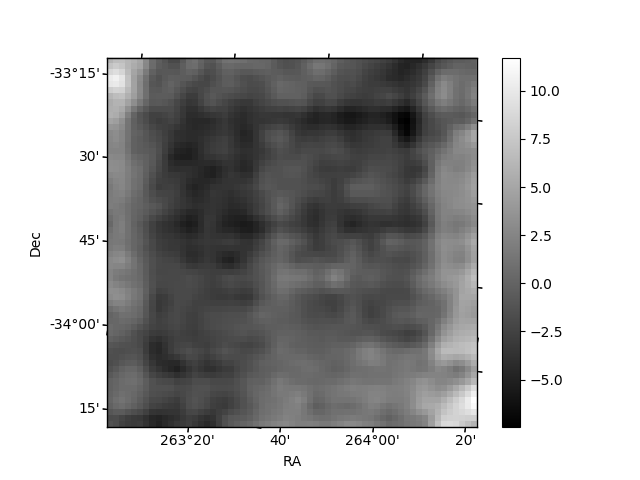
Histogram calculated using DETX and DETY for each event in the final _common_clean file
| Quadrant A | 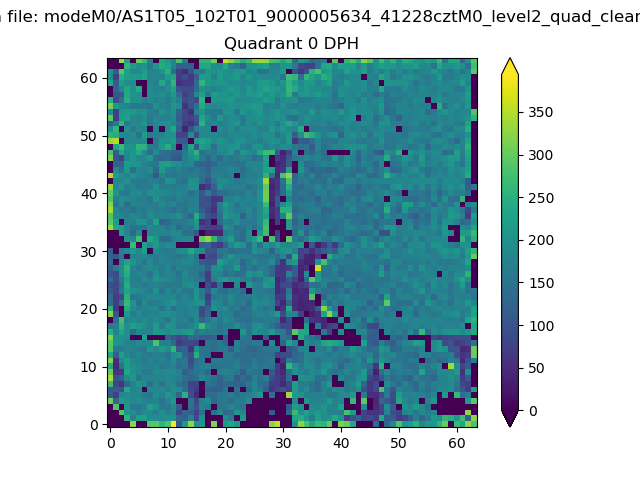 |
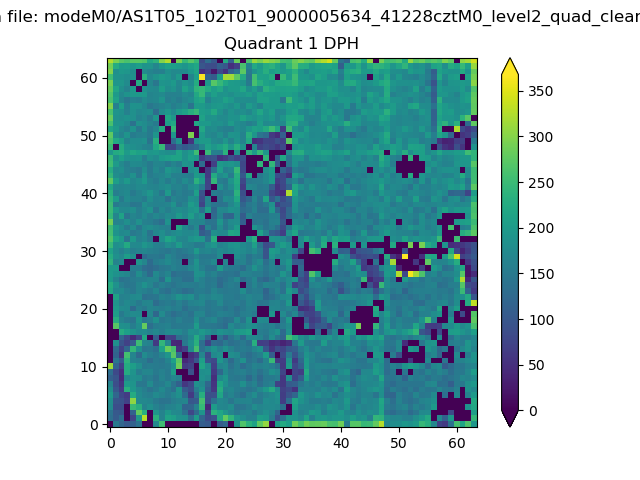 |
Quadrant B |
|---|---|---|---|
| Quadrant D | 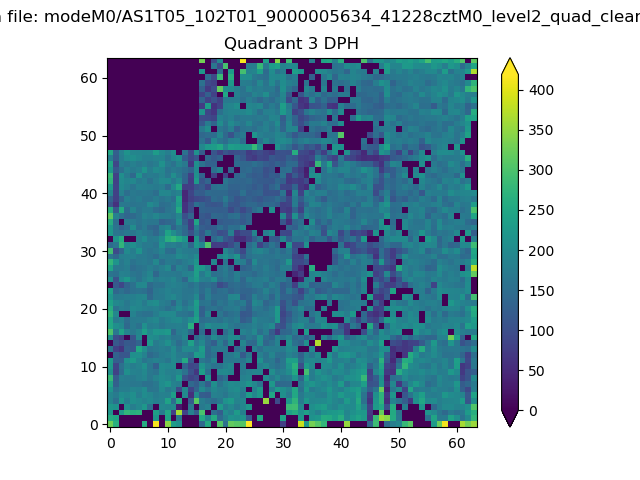 |
 |
Quadrant C |
| Plot type | Count rate plots | Images |
|---|---|---|
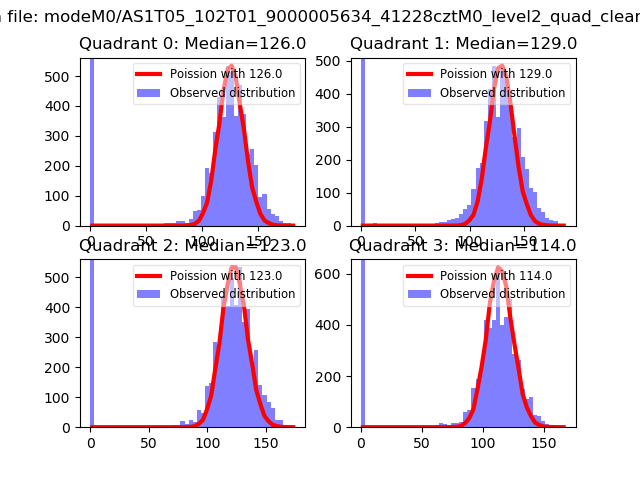
| Comparison with Poisson distribution Blue bars denote a histogram of data divided into 1 sec bins. Red curve is a Poisson curve with rate = median count rate of data. |
 |
 |
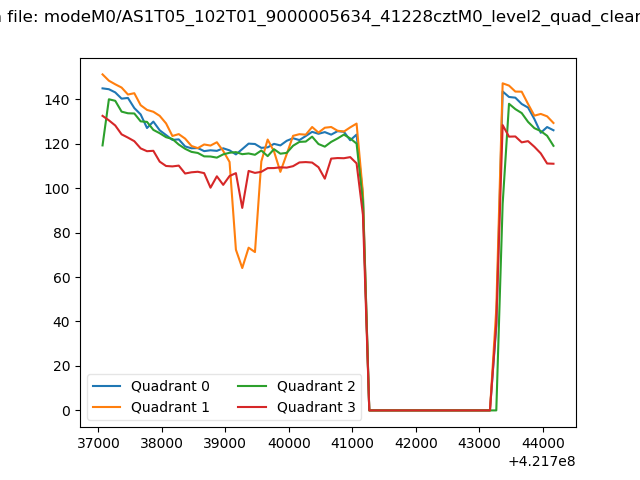
| Quadrant-wise count rates Data is divided into 100 sec bins |
 |
|
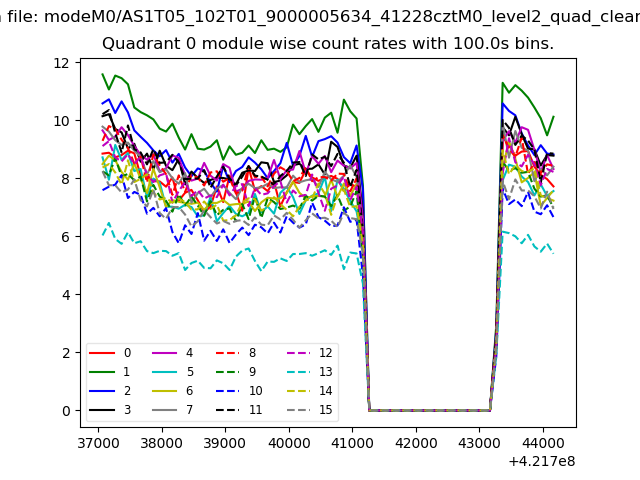
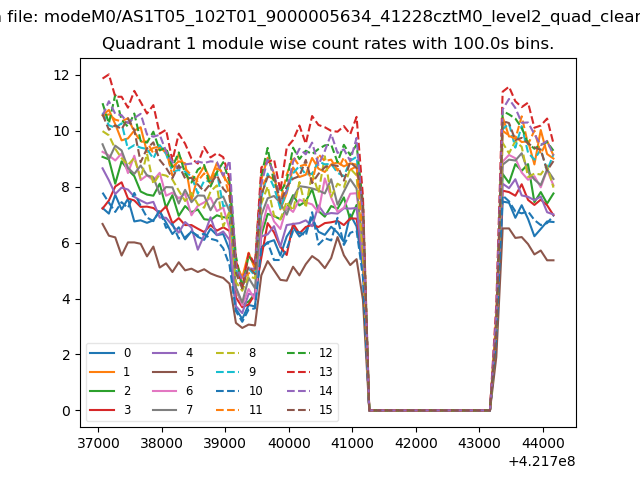
| Module-wise count rates for Quadrant A Data is divided into 100 sec bins |
 |
 |
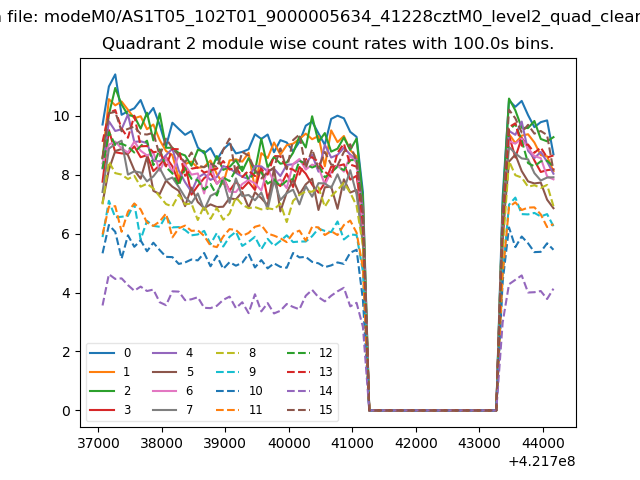
| Module-wise count rates for Quadrant B Data is divided into 100 sec bins |
 |
 |
| Module-wise count rates for Quadrant C Data is divided into 100 sec bins |
 |
 |
| Module-wise count rates for Quadrant D Data is divided into 100 sec bins |
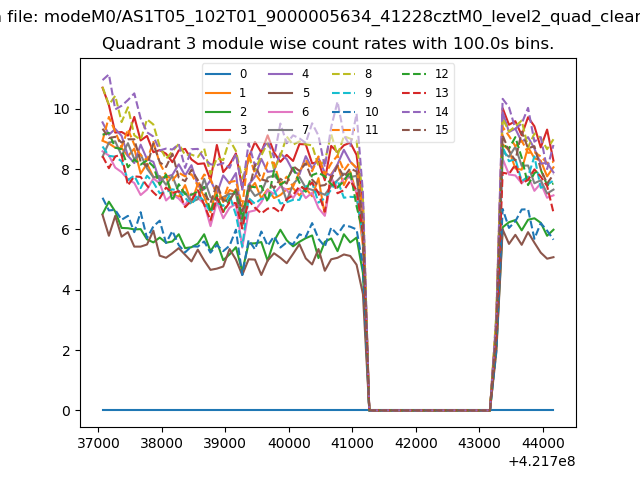 |
 |
| Parameter | Plot |
|---|---|
| CZT HV Monitor | 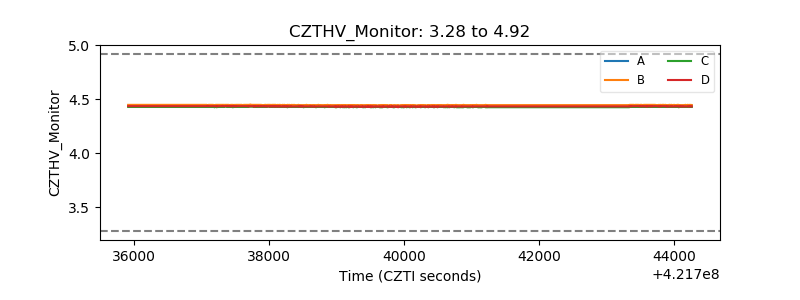 |
| D_VDD | 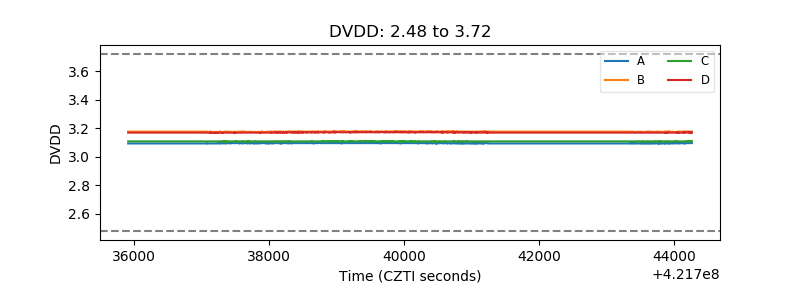 |
| Temperature 1 | 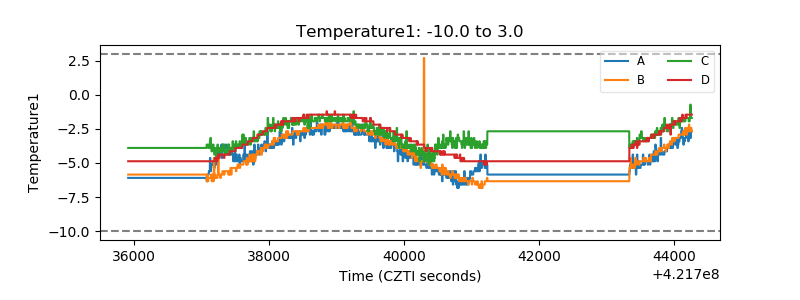 |
| Veto HV Monitor | 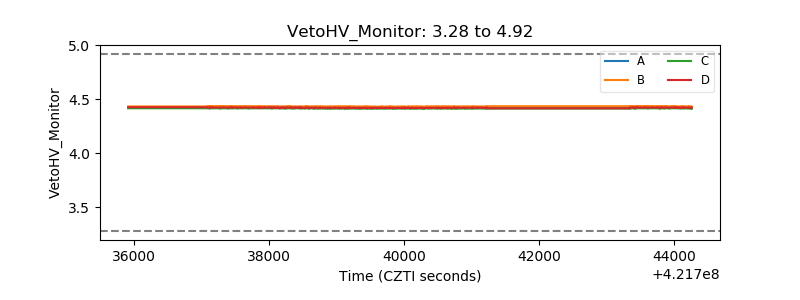 |
| Veto LLD | 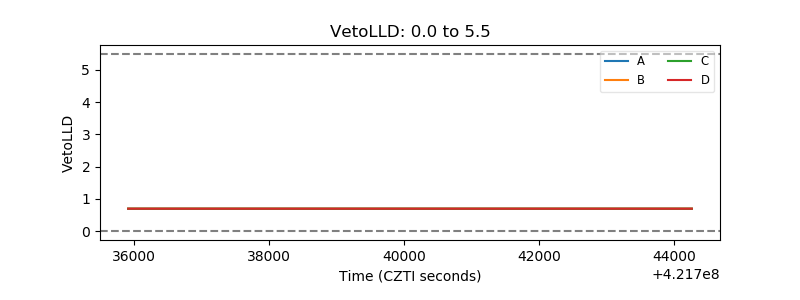 |
| Alpha Counter | 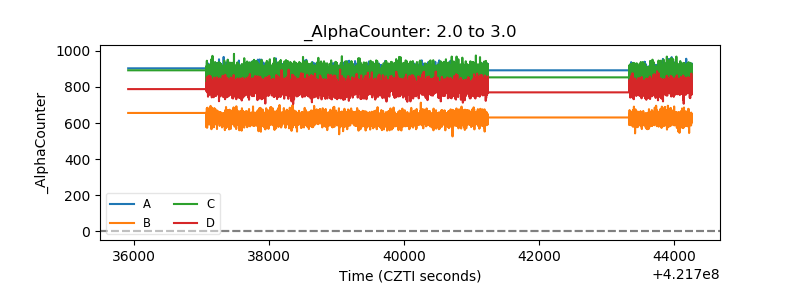 |
| _CPM_Rate | 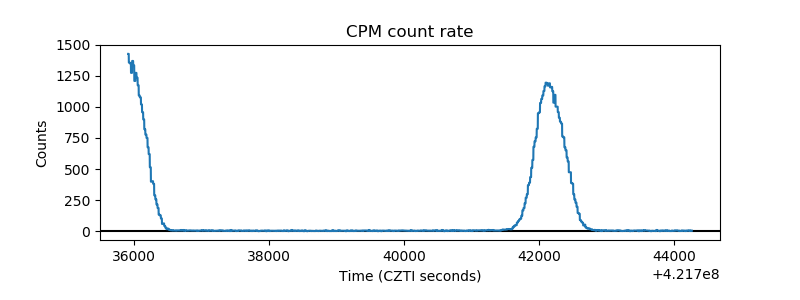 |
| CZT Counter | 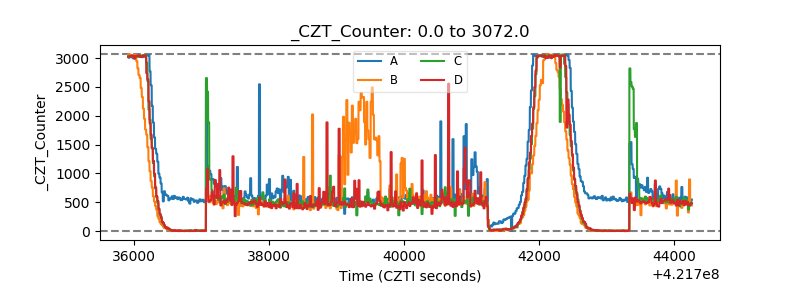 |
| +2.5 Volts monitor | 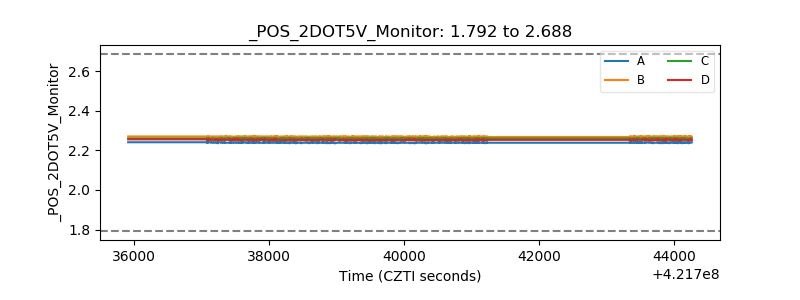 |
| +5 Volts monitor | 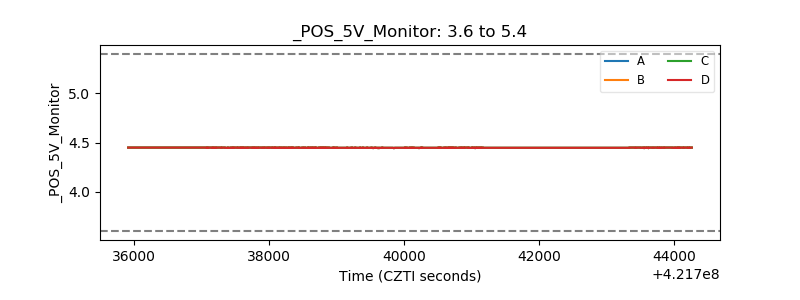 |
| _ROLL_ROT |  |
| _Roll_DEC | 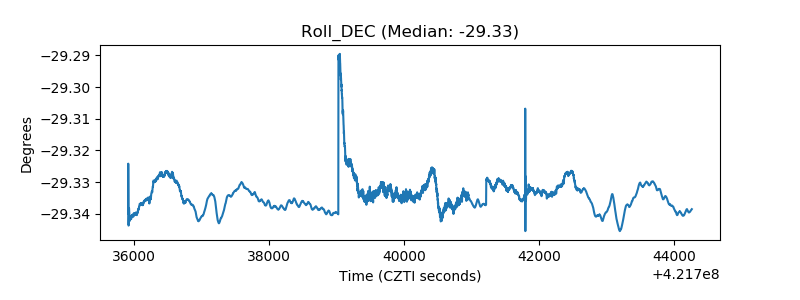 |
| _Roll_RA | 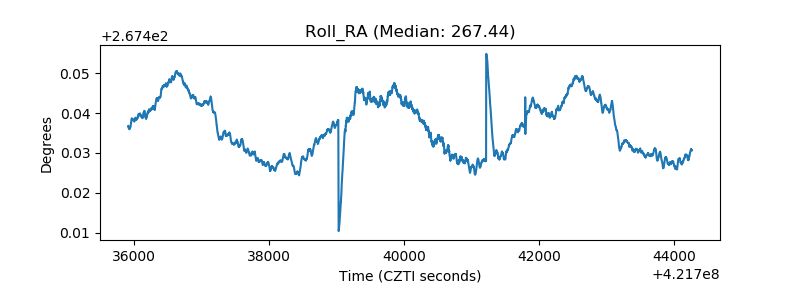 |
| Veto Counter | 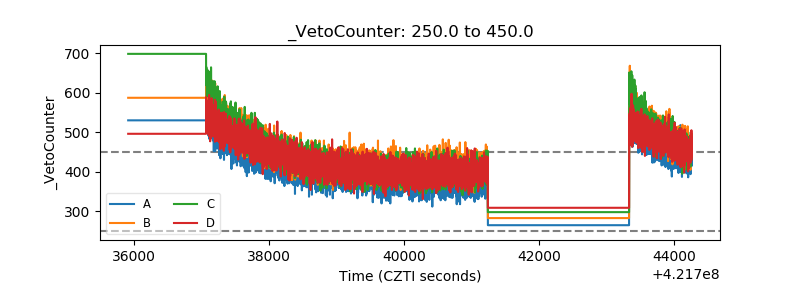 |