| Param | Original file | Final file |
|---|---|---|
| Filename | modeM0/AS1T05_102T01_9000005634_41229cztM0_level2.fits | modeM0/AS1T05_102T01_9000005634_41229cztM0_level2_quad_clean.evt |
| Size (bytes) | 375,022,080 | 93,810,240 |
| Size | 357.6 MB | 89.5 MB |
| Events in quadrant A | 3,795,164 | 639,272 |
| Events in quadrant B | 3,198,070 | 654,492 |
| Events in quadrant C | 3,245,750 | 610,974 |
| Events in quadrant D | 3,237,748 | 570,924 |
| Mode M9 | |||
|---|---|---|---|
| Quadrant | BADHDUFLAG | Total packets | Discarded packets |
| A | 0 | 30 | 0 |
| B | 0 | 30 | 0 |
| C | 0 | 30 | 0 |
| D | 0 | 31 | 0 |
| Mode M0 | |||
|---|---|---|---|
| Quadrant | BADHDUFLAG | Total packets | Discarded packets |
| A | 0 | 14324 | 3 |
| B | 0 | 12772 | 2 |
| C | 0 | 12687 | 2 |
| D | 0 | 12941 | 2 |
| Mode SS | |||
|---|---|---|---|
| Quadrant | BADHDUFLAG | Total packets | Discarded packets |
| A | 0 | 106 | 0 |
| B | 0 | 106 | 0 |
| C | 0 | 106 | 0 |
| D | 0 | 106 | 0 |
| Quadrant | Total seconds | Saturated seconds | Saturation percentage |
|---|---|---|---|
| A | 5215 | 121 | 2.320230% |
| B | 5215 | 88 | 1.687440% |
| C | 5215 | 157 | 3.010547% |
| D | 5215 | 170 | 3.259827% |
Noise dominated data is calculated using 1-second bins in cleaned event files. If a bin has >2000 counts, and if more than 50% of those come from <1% of pixels, then it is considered to be noise-dominated and hence unusable.
| Quadrant | # 1 sec bins | Bins with >0 counts | Bins with >2000 counts | High rate bins dominated by noise | Noise dominated (total time) | Noise dominated (detector-on time) | Marked lightcurve |
|---|---|---|---|---|---|---|---|
| A | 7368 | 5216 | 78 | 78 | 1.06% | 1.50% | 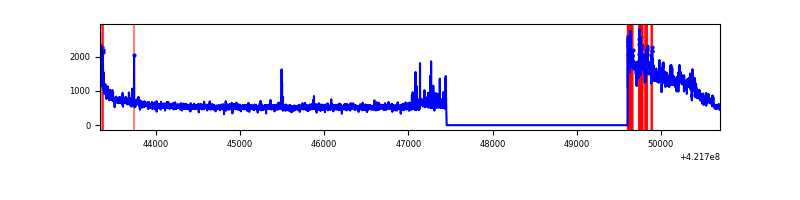 |
| B | 7368 | 5216 | 55 | 55 | 0.75% | 1.05% | 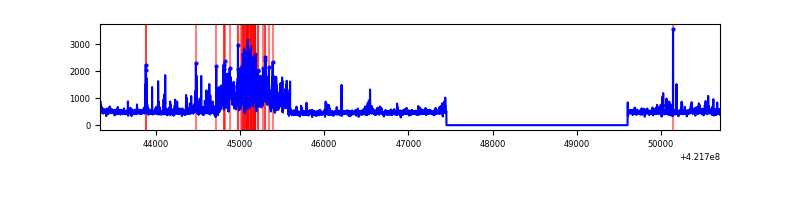 |
| C | 7368 | 5216 | 150 | 150 | 2.04% | 2.88% | 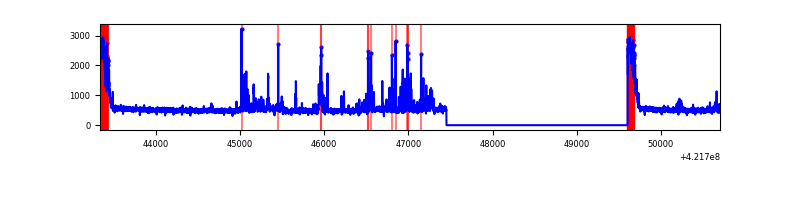 |
| D | 7368 | 5216 | 154 | 154 | 2.09% | 2.95% | 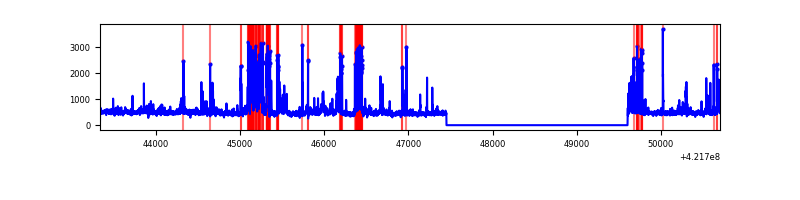 |
Top three noisy pixels from each quadrant. If the there are fewer than three noisy pixels in the level2.evt file, extra rows are filled as -1
| Pixel properties | Quadrant properties | ||||||
|---|---|---|---|---|---|---|---|
| Quadrant | DetID | PixID | Counts | Sigma | Mean | Median | Sigma |
| A | 0 | 8 | 850749 | 6753.62 | 620 | 609 | 125.9 |
| A | 10 | 83 | 512455 | 4066.17 | 620 | 609 | 125.9 |
| A | 13 | 254 | 9361 | 69.53 | 620 | 609 | 125.9 |
| B | 0 | 186 | 580100 | 4938.19 | 610 | 595 | 117.4 |
| B | 5 | 255 | 104526 | 885.64 | 610 | 595 | 117.4 |
| B | 0 | 190 | 46927 | 394.81 | 610 | 595 | 117.4 |
| C | 0 | 10 | 420283 | 3034.63 | 592 | 596 | 138.3 |
| C | 9 | 54 | 287793 | 2076.63 | 592 | 596 | 138.3 |
| C | 15 | 214 | 221486 | 1597.19 | 592 | 596 | 138.3 |
| D | 13 | 249 | 725303 | 4935.22 | 600 | 585 | 146.8 |
| D | 5 | 222 | 72912 | 492.54 | 600 | 585 | 146.8 |
| D | 2 | 249 | 59885 | 403.82 | 600 | 585 | 146.8 |
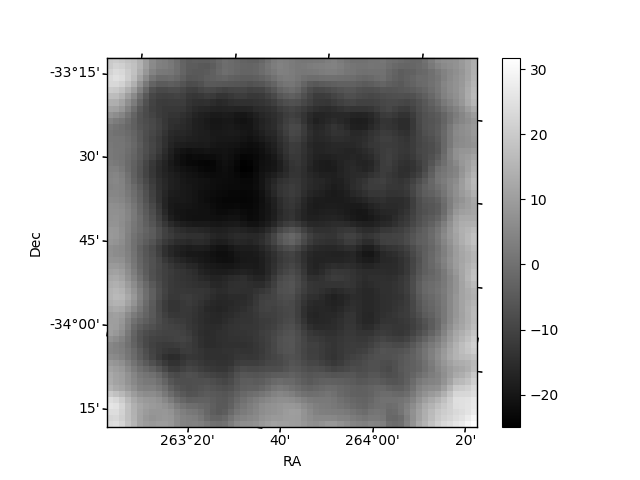
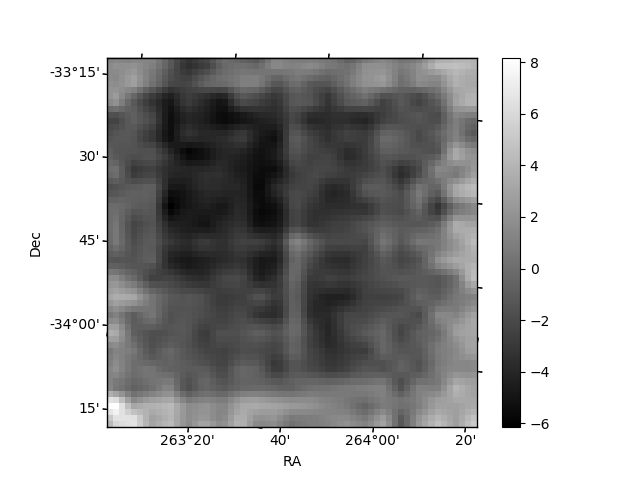
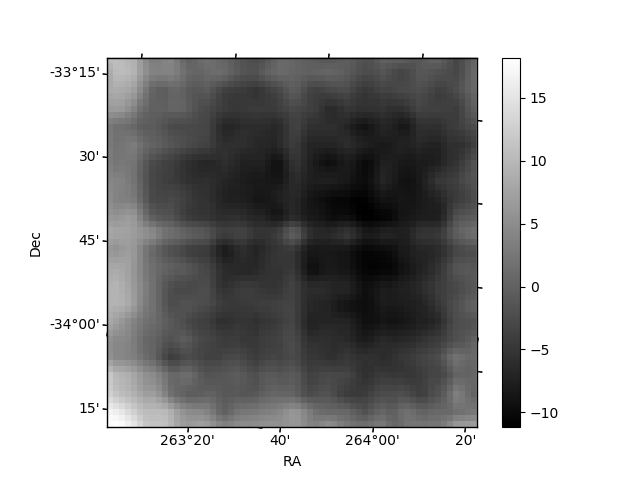
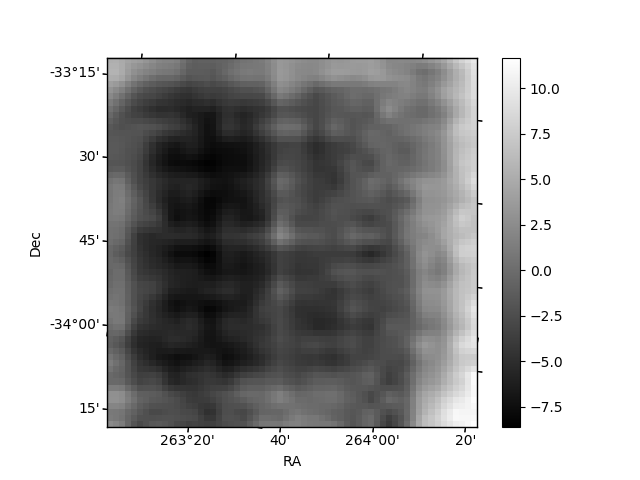
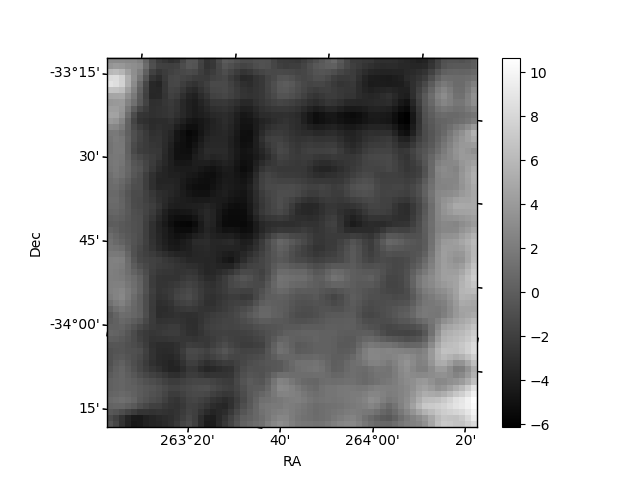
Histogram calculated using DETX and DETY for each event in the final _common_clean file
| Quadrant A | 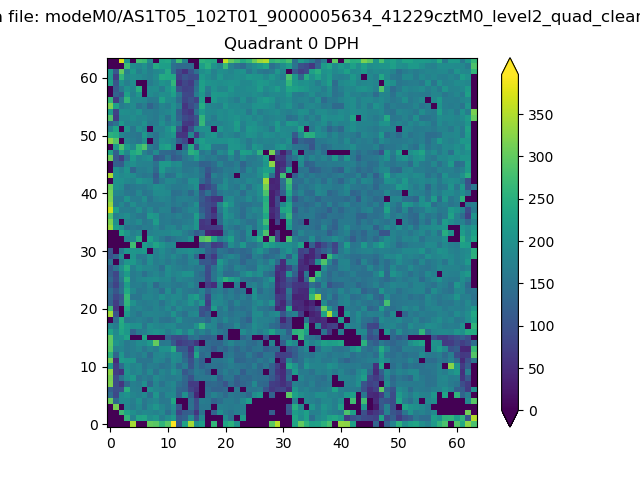 |
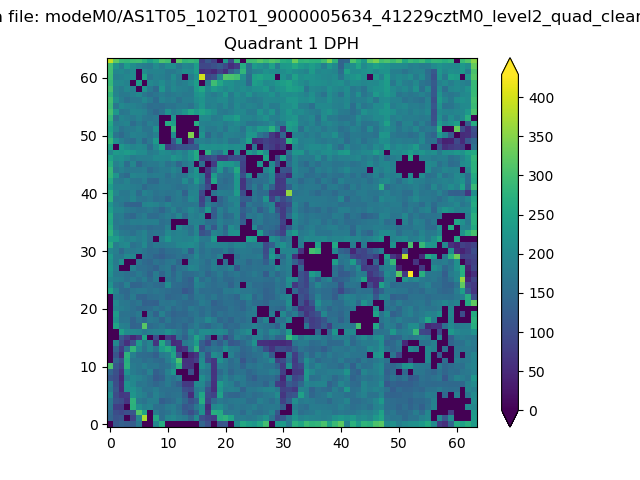 |
Quadrant B |
|---|---|---|---|
| Quadrant D | 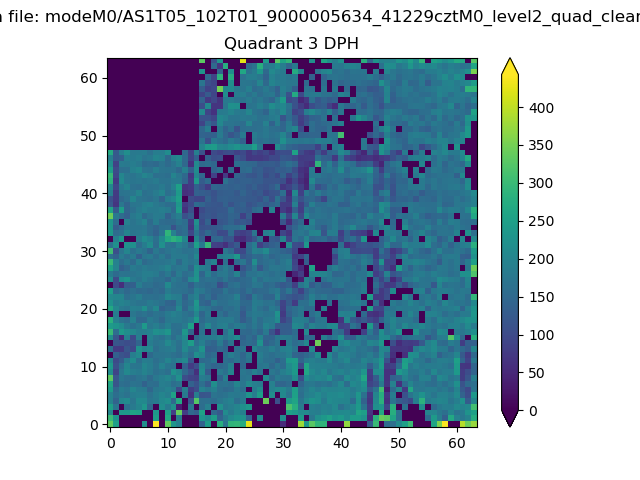 |
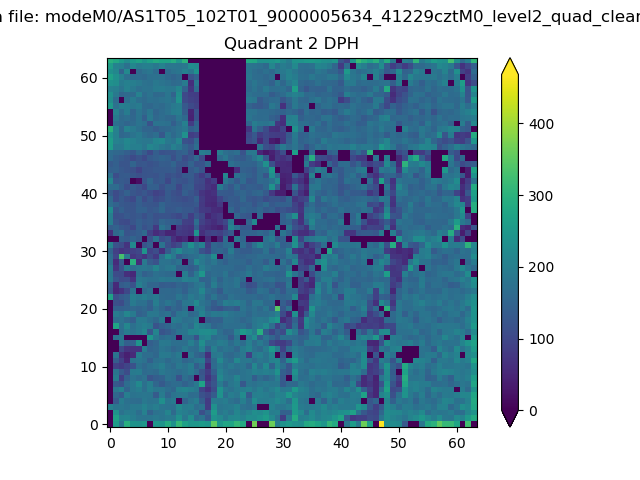 |
Quadrant C |
| Plot type | Count rate plots | Images |
|---|---|---|
| Comparison with Poisson distribution Blue bars denote a histogram of data divided into 1 sec bins. Red curve is a Poisson curve with rate = median count rate of data. |
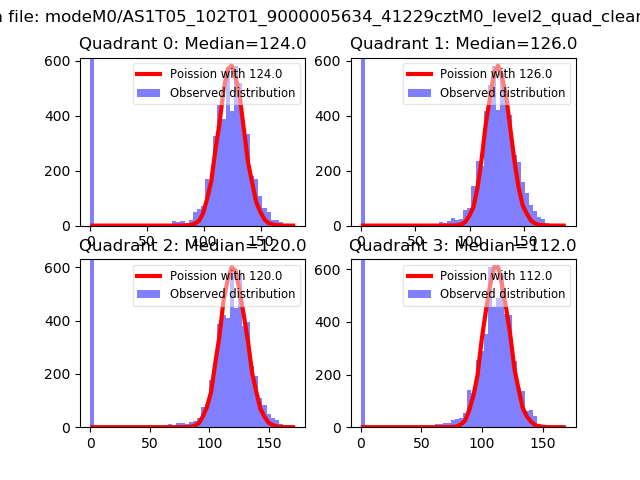 |
 |
| Quadrant-wise count rates Data is divided into 100 sec bins |
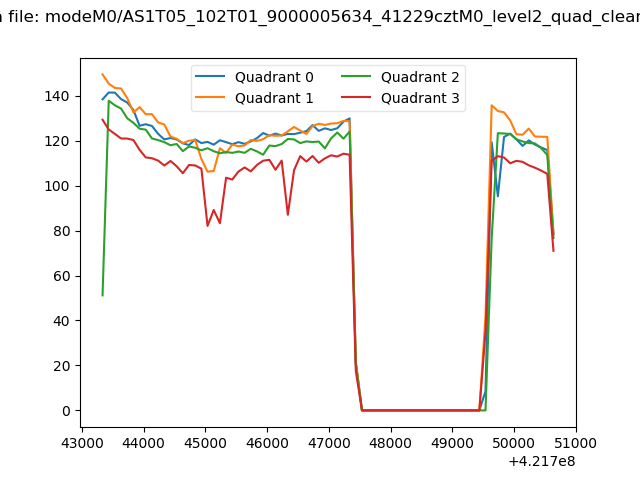 |
|
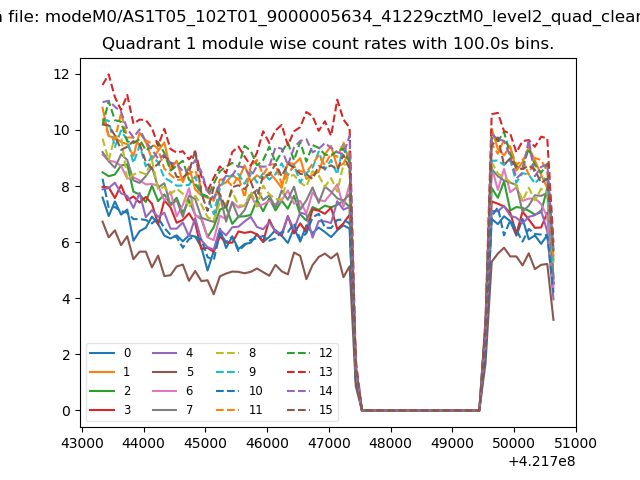
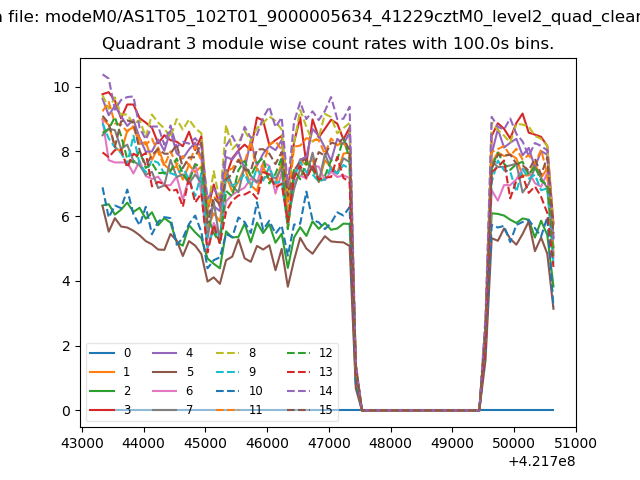
| Module-wise count rates for Quadrant A Data is divided into 100 sec bins |
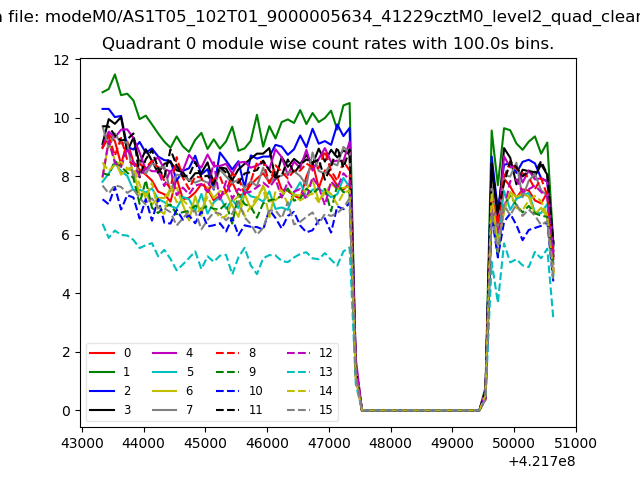 |
 |
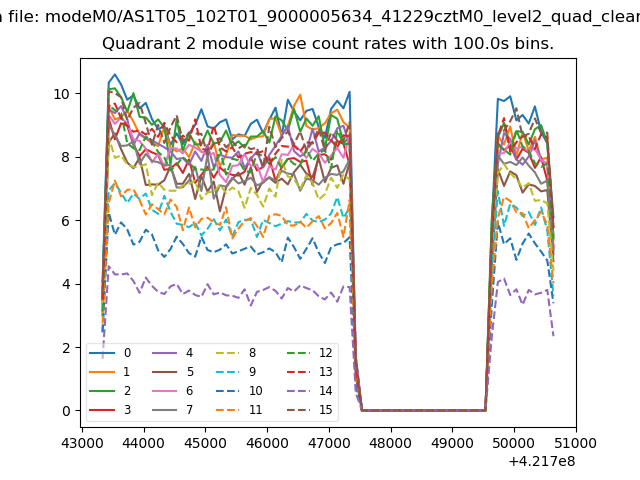
| Module-wise count rates for Quadrant B Data is divided into 100 sec bins |
 |
 |
| Module-wise count rates for Quadrant C Data is divided into 100 sec bins |
 |
 |
| Module-wise count rates for Quadrant D Data is divided into 100 sec bins |
 |
 |
| Parameter | Plot |
|---|---|
| CZT HV Monitor | 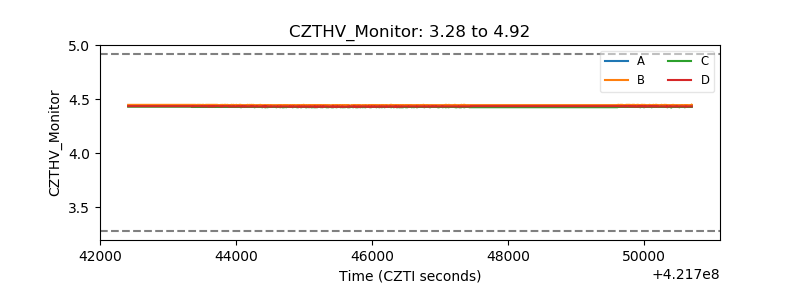 |
| D_VDD | 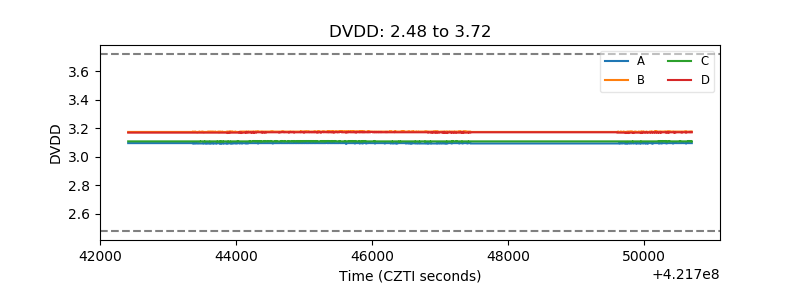 |
| Temperature 1 | 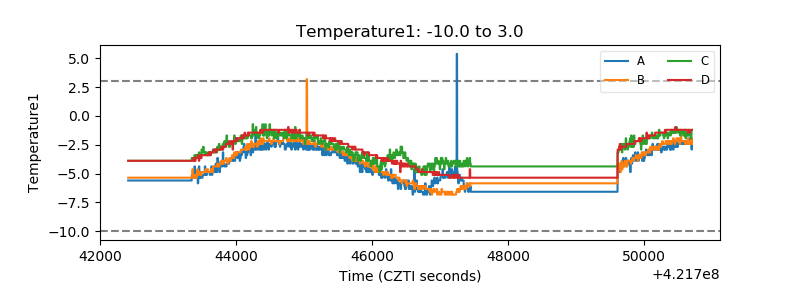 |
| Veto HV Monitor | 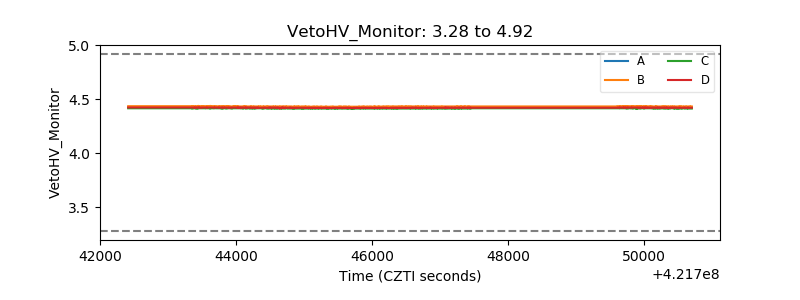 |
| Veto LLD | 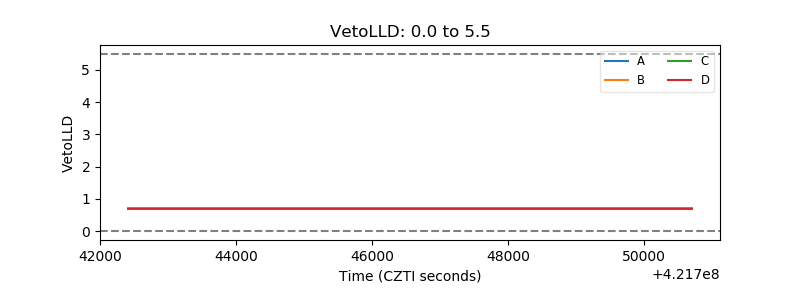 |
| Alpha Counter | 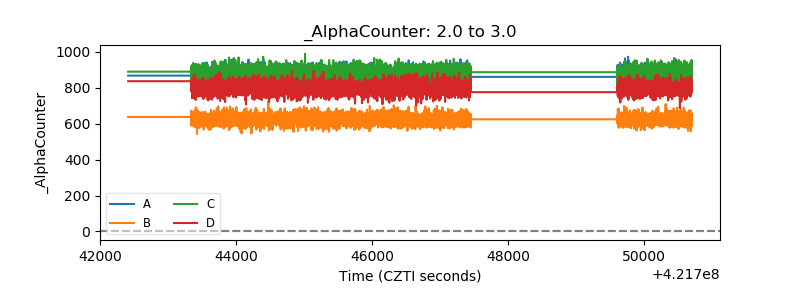 |
| _CPM_Rate | 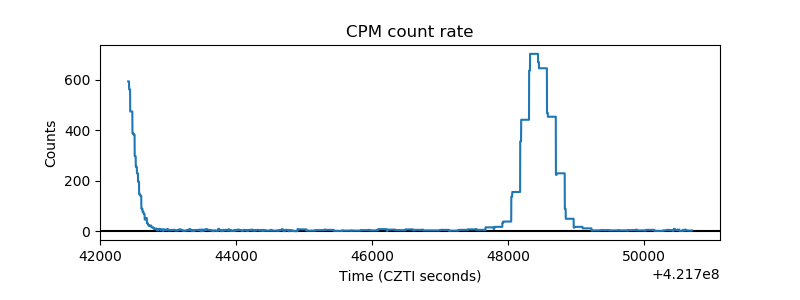 |
| CZT Counter | 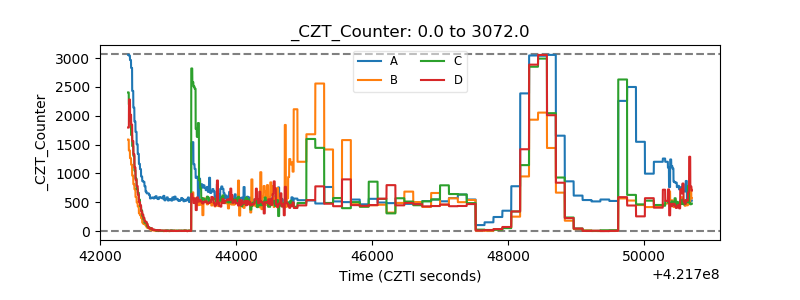 |
| +2.5 Volts monitor | 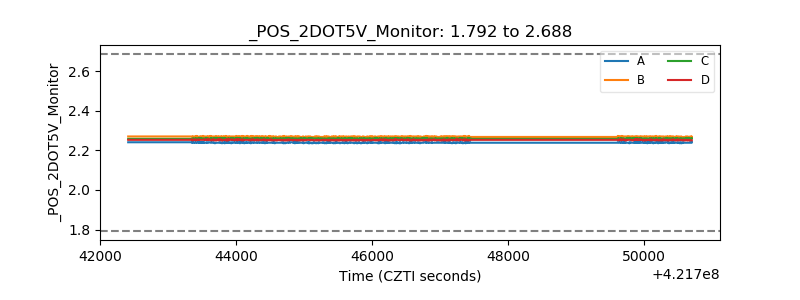 |
| +5 Volts monitor | 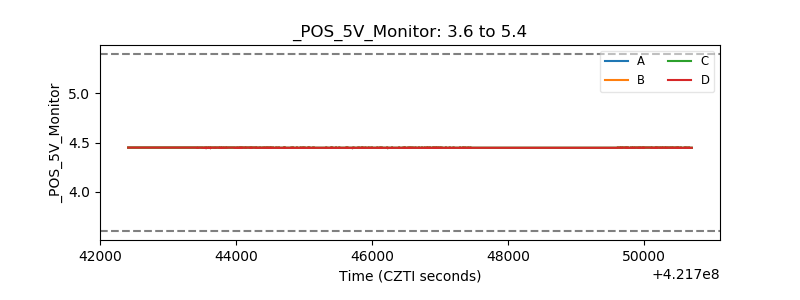 |
| _ROLL_ROT | 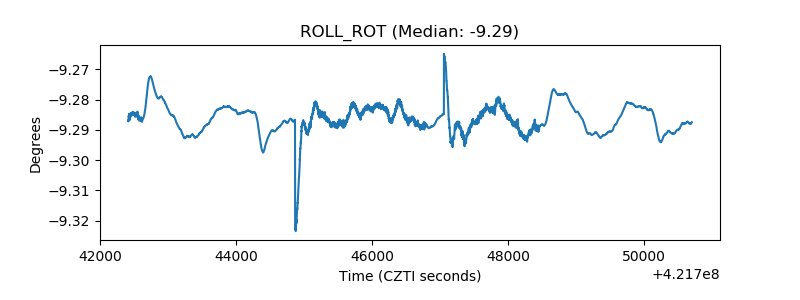 |
| _Roll_DEC | 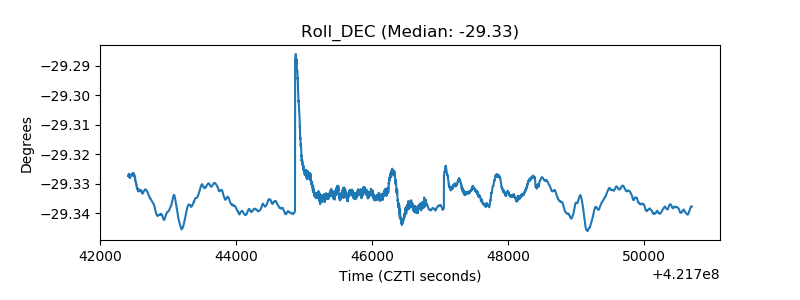 |
| _Roll_RA | 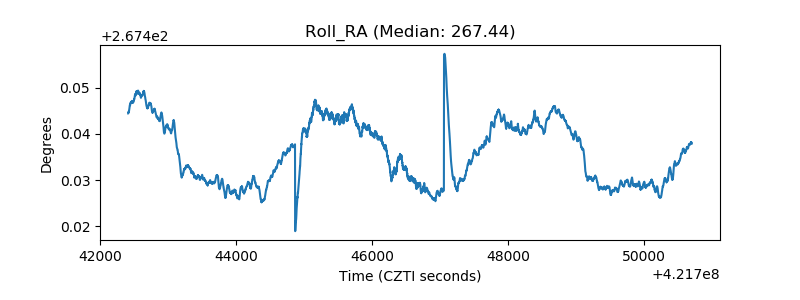 |
| Veto Counter |  |