| Param | Original file | Final file |
|---|---|---|
| Filename | modeM0/AS1T05_102T01_9000005634_41230cztM0_level2.fits | modeM0/AS1T05_102T01_9000005634_41230cztM0_level2_quad_clean.evt |
| Size (bytes) | 402,883,200 | 86,169,600 |
| Size | 384.2 MB | 82.2 MB |
| Events in quadrant A | 5,456,596 | 530,097 |
| Events in quadrant B | 2,568,340 | 614,023 |
| Events in quadrant C | 3,555,966 | 571,137 |
| Events in quadrant D | 2,937,596 | 538,062 |
| Mode M9 | |||
|---|---|---|---|
| Quadrant | BADHDUFLAG | Total packets | Discarded packets |
| A | 0 | 25 | 0 |
| B | 0 | 25 | 0 |
| C | 0 | 25 | 0 |
| D | 0 | 26 | 0 |
| Mode M0 | |||
|---|---|---|---|
| Quadrant | BADHDUFLAG | Total packets | Discarded packets |
| A | 0 | 19470 | 3 |
| B | 0 | 10841 | 2 |
| C | 0 | 13867 | 2 |
| D | 0 | 12164 | 2 |
| Mode SS | |||
|---|---|---|---|
| Quadrant | BADHDUFLAG | Total packets | Discarded packets |
| A | 0 | 104 | 0 |
| B | 0 | 104 | 0 |
| C | 0 | 104 | 0 |
| D | 0 | 104 | 0 |
| Quadrant | Total seconds | Saturated seconds | Saturation percentage |
|---|---|---|---|
| A | 5078 | 716 | 14.100039% |
| B | 5078 | 25 | 0.492320% |
| C | 5078 | 171 | 3.367468% |
| D | 5078 | 135 | 2.658527% |
Noise dominated data is calculated using 1-second bins in cleaned event files. If a bin has >2000 counts, and if more than 50% of those come from <1% of pixels, then it is considered to be noise-dominated and hence unusable.
| Quadrant | # 1 sec bins | Bins with >0 counts | Bins with >2000 counts | High rate bins dominated by noise | Noise dominated (total time) | Noise dominated (detector-on time) | Marked lightcurve |
|---|---|---|---|---|---|---|---|
| A | 7201 | 5079 | 835 | 835 | 11.60% | 16.44% | 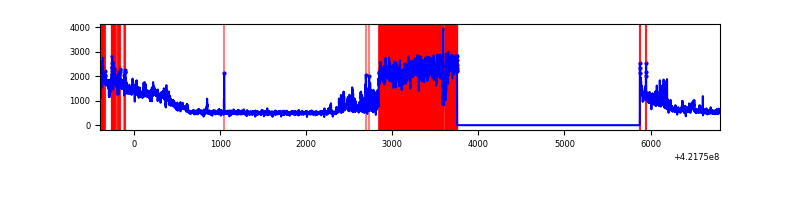 |
| B | 7201 | 5079 | 15 | 15 | 0.21% | 0.30% | 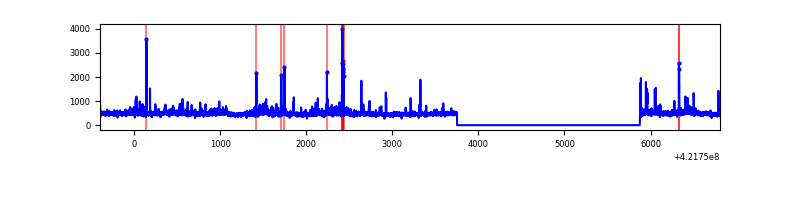 |
| C | 7201 | 5079 | 150 | 150 | 2.08% | 2.95% | 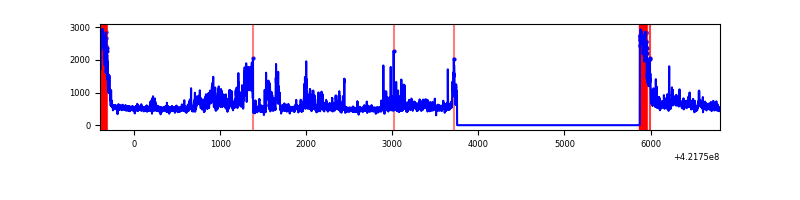 |
| D | 7201 | 5079 | 133 | 133 | 1.85% | 2.62% | 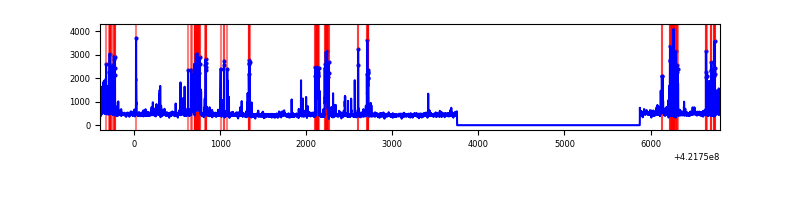 |
Top three noisy pixels from each quadrant. If the there are fewer than three noisy pixels in the level2.evt file, extra rows are filled as -1
| Pixel properties | Quadrant properties | ||||||
|---|---|---|---|---|---|---|---|
| Quadrant | DetID | PixID | Counts | Sigma | Mean | Median | Sigma |
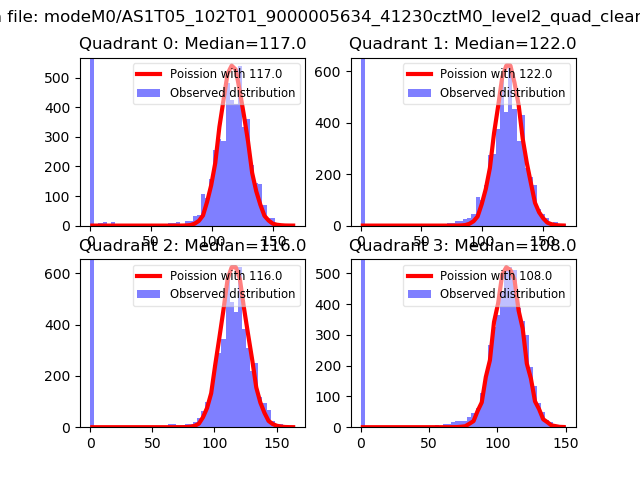
| A | 0 | 8 | 2733654 | 23568.12 | 569 | 559 | 116.0 |
| A | 10 | 83 | 493537 | 4251.07 | 569 | 559 | 116.0 |
| A | 2 | 79 | 11149 | 91.32 | 569 | 559 | 116.0 |
| B | 5 | 255 | 113993 | 1014.98 | 579 | 564 | 111.8 |
| B | 0 | 245 | 79561 | 706.88 | 579 | 564 | 111.8 |
| B | 0 | 190 | 54332 | 481.12 | 579 | 564 | 111.8 |
| C | 9 | 54 | 743650 | 5703.2 | 560 | 564 | 130.3 |
| C | 0 | 10 | 410377 | 3145.32 | 560 | 564 | 130.3 |
| C | 15 | 214 | 213384 | 1633.4 | 560 | 564 | 130.3 |
| D | 13 | 249 | 335518 | 2372.43 | 568 | 551 | 141.2 |
| D | 5 | 222 | 246911 | 1744.86 | 568 | 551 | 141.2 |
| D | 2 | 249 | 43462 | 303.92 | 568 | 551 | 141.2 |
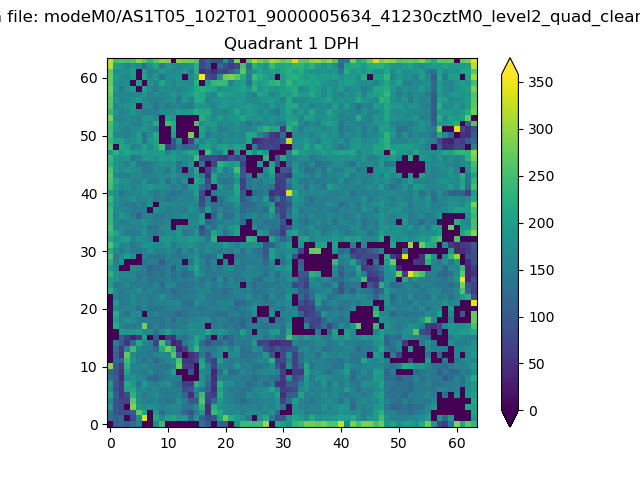
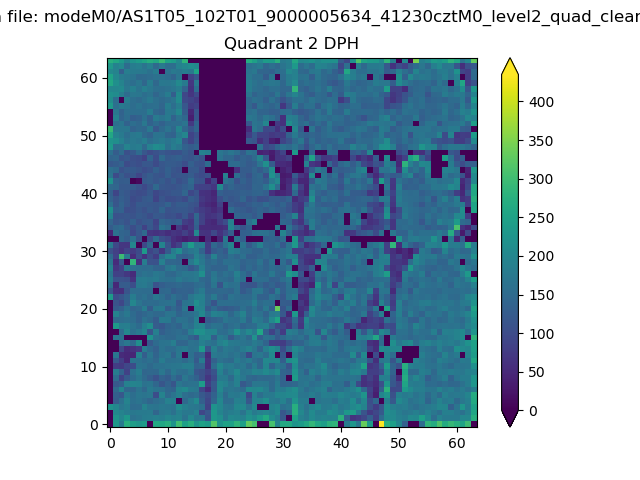
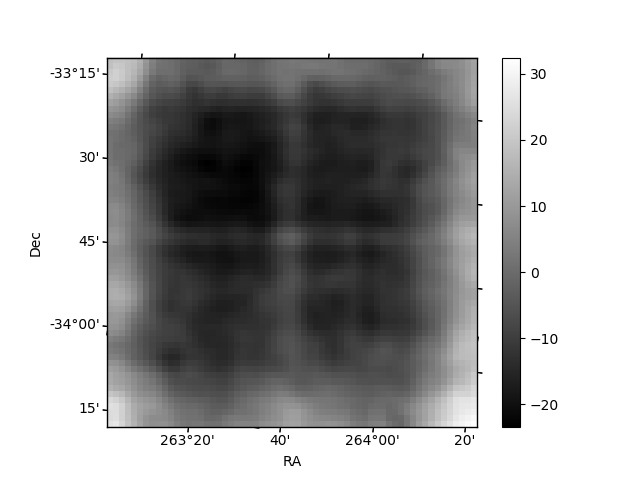
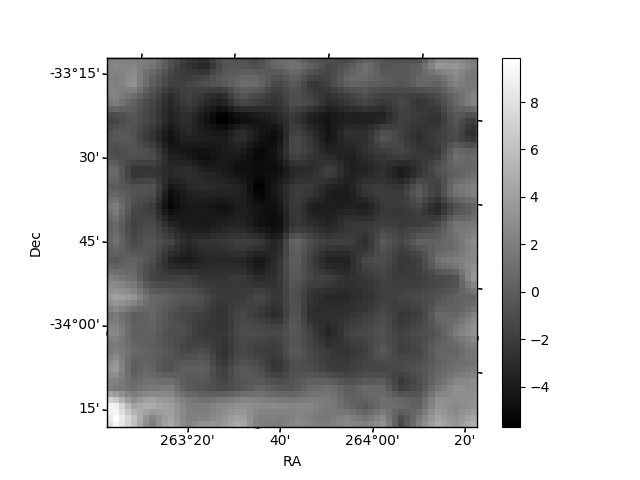
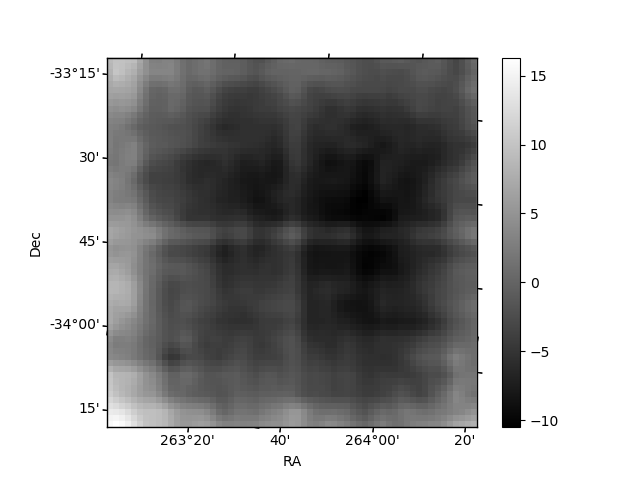
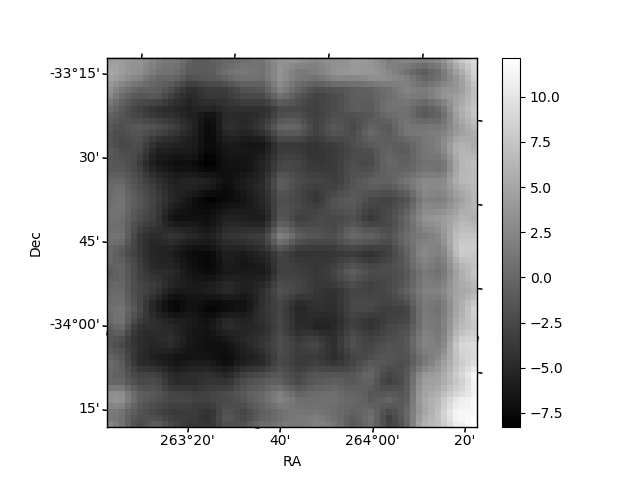
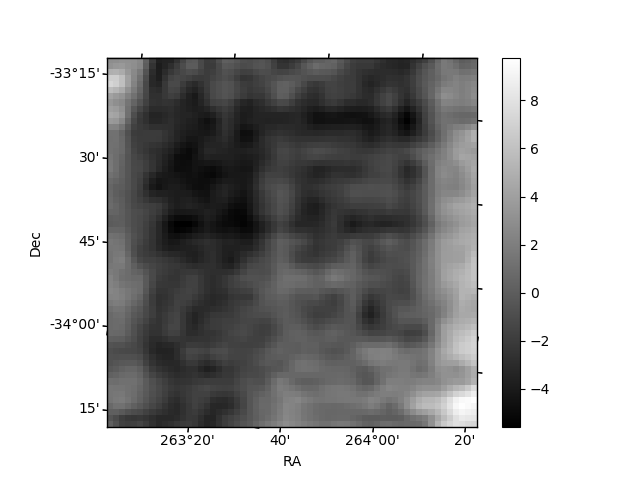
Histogram calculated using DETX and DETY for each event in the final _common_clean file
| Quadrant A | 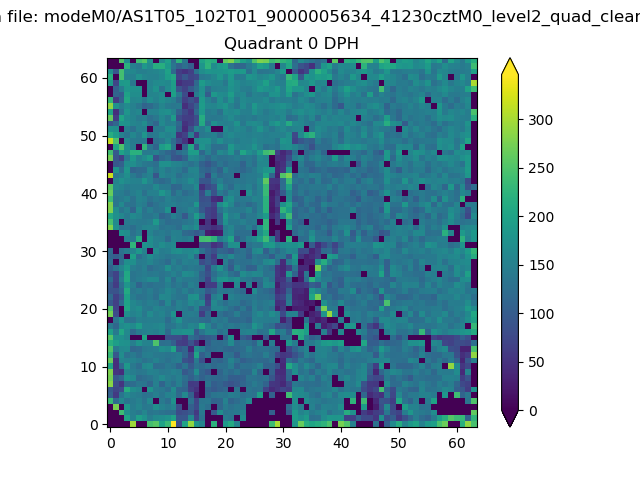 |
 |
Quadrant B |
|---|---|---|---|
| Quadrant D | 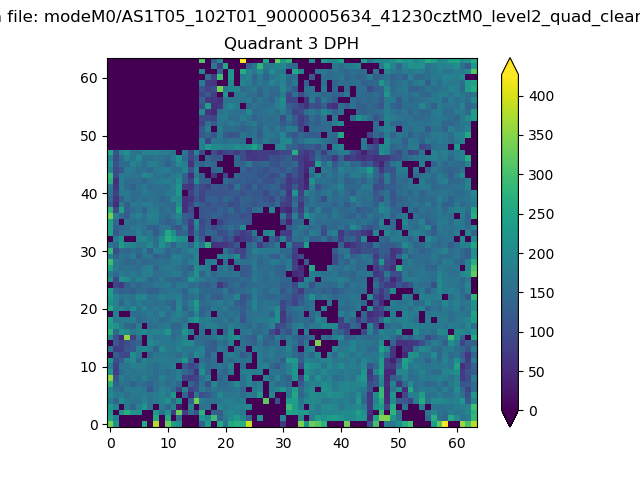 |
 |
Quadrant C |
| Plot type | Count rate plots | Images |
|---|---|---|
| Comparison with Poisson distribution Blue bars denote a histogram of data divided into 1 sec bins. Red curve is a Poisson curve with rate = median count rate of data. |
 |
 |
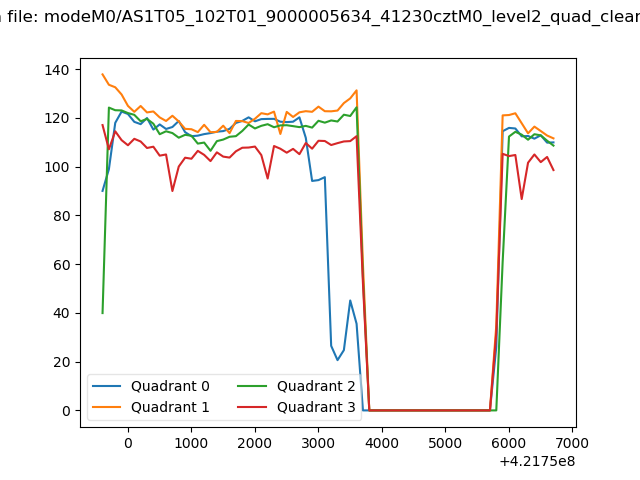
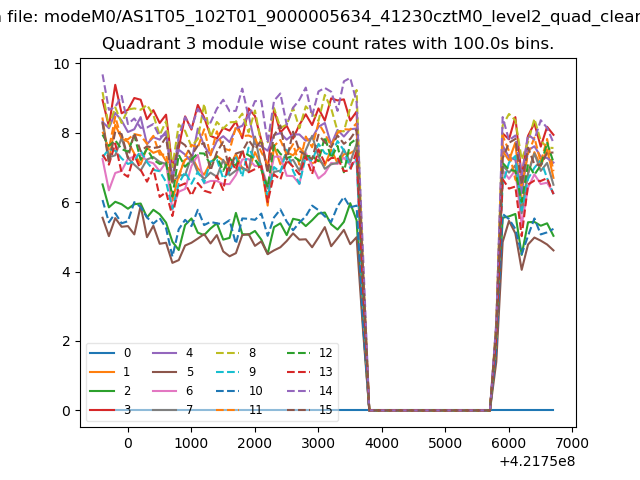
| Quadrant-wise count rates Data is divided into 100 sec bins |
 |
|
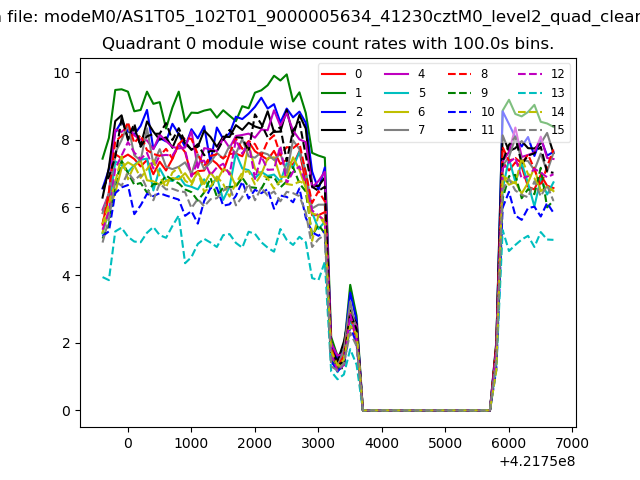
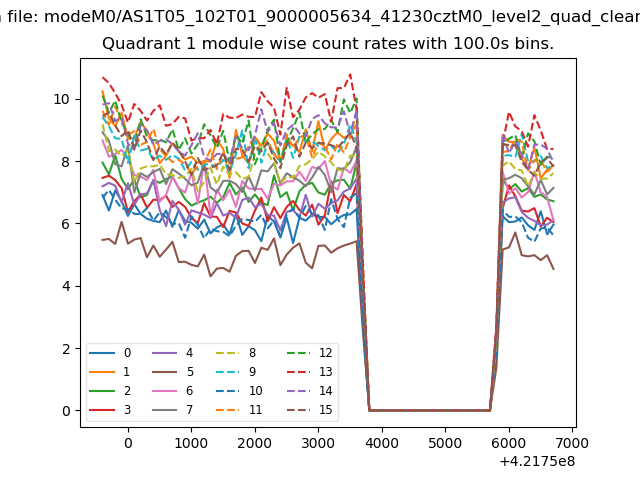
| Module-wise count rates for Quadrant A Data is divided into 100 sec bins |
 |
 |
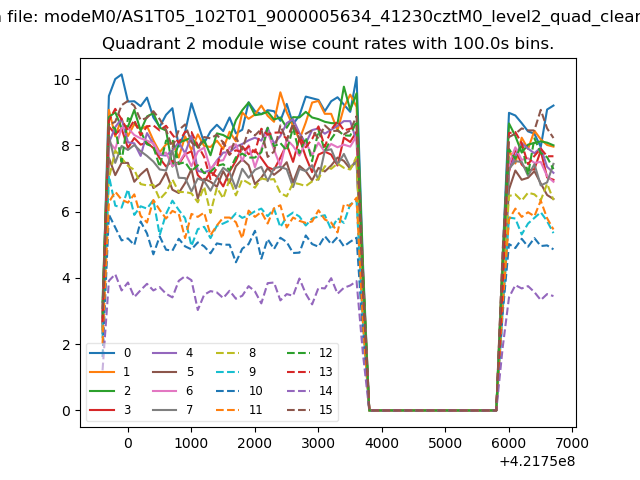
| Module-wise count rates for Quadrant B Data is divided into 100 sec bins |
 |
 |
| Module-wise count rates for Quadrant C Data is divided into 100 sec bins |
 |
 |
| Module-wise count rates for Quadrant D Data is divided into 100 sec bins |
 |
 |
| Parameter | Plot |
|---|---|
| CZT HV Monitor | 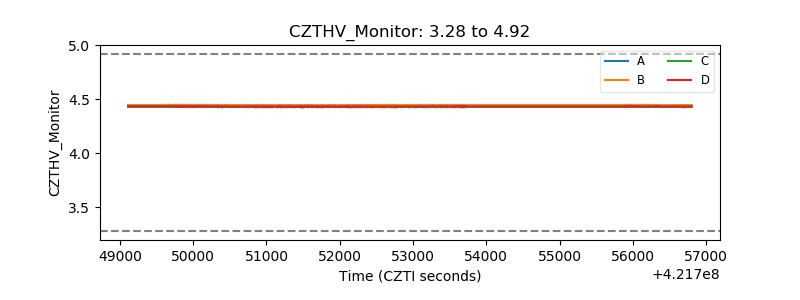 |
| D_VDD | 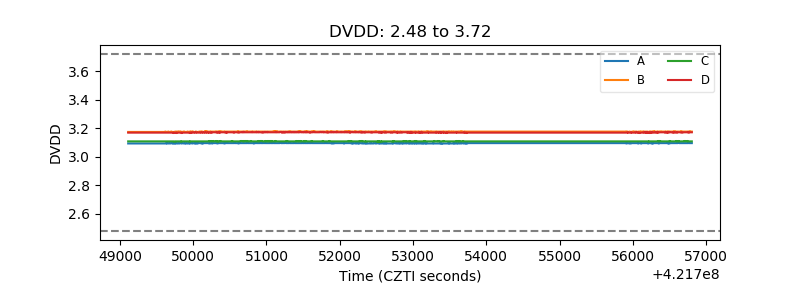 |
| Temperature 1 |  |
| Veto HV Monitor | 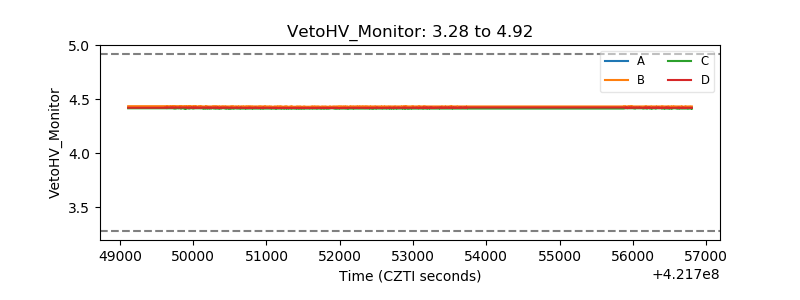 |
| Veto LLD | 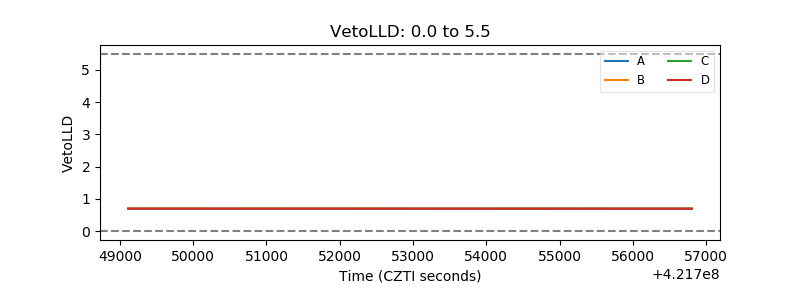 |
| Alpha Counter | 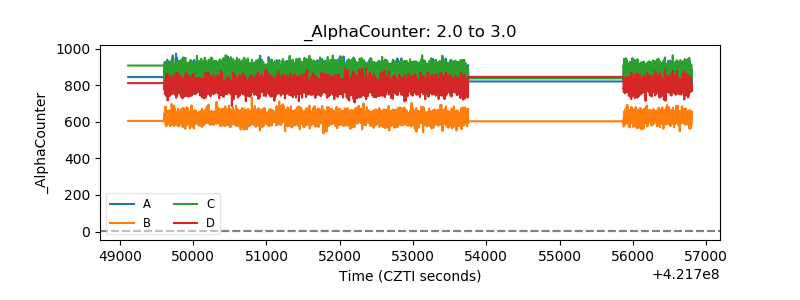 |
| _CPM_Rate | 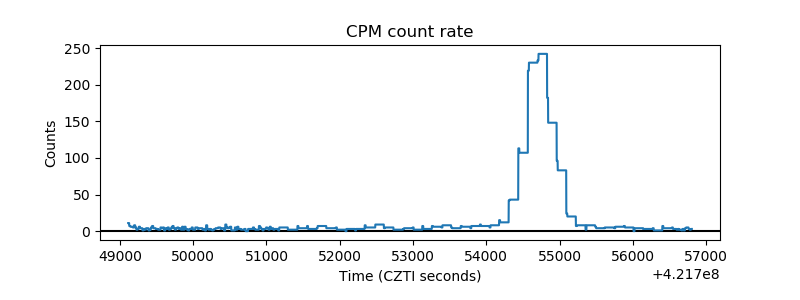 |
| CZT Counter | 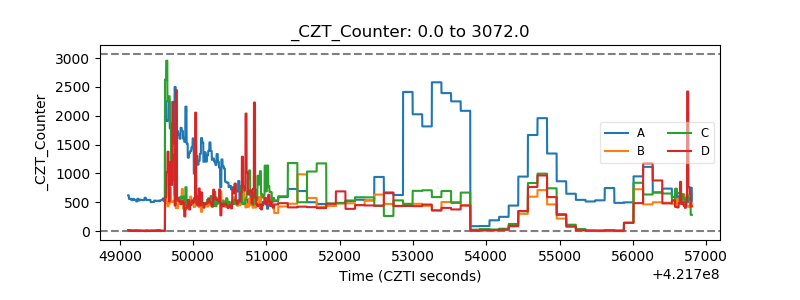 |
| +2.5 Volts monitor | 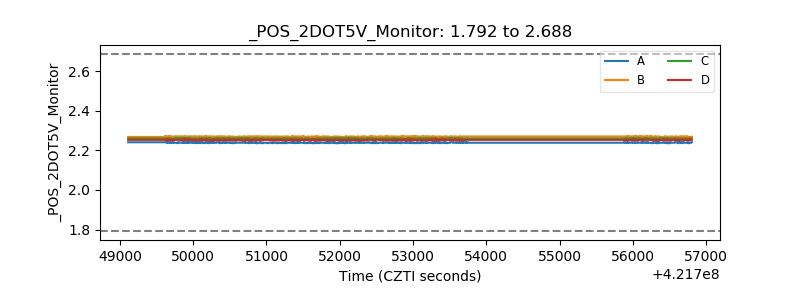 |
| +5 Volts monitor | 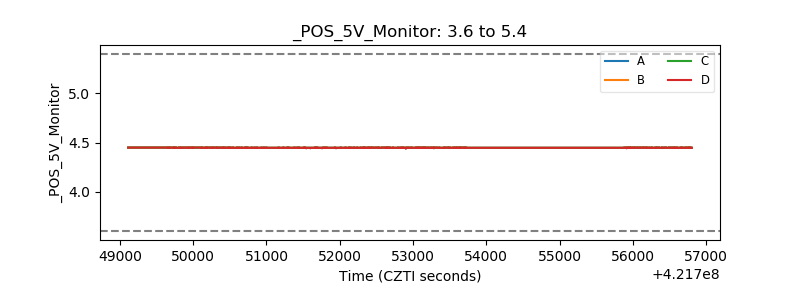 |
| _ROLL_ROT |  |
| _Roll_DEC | 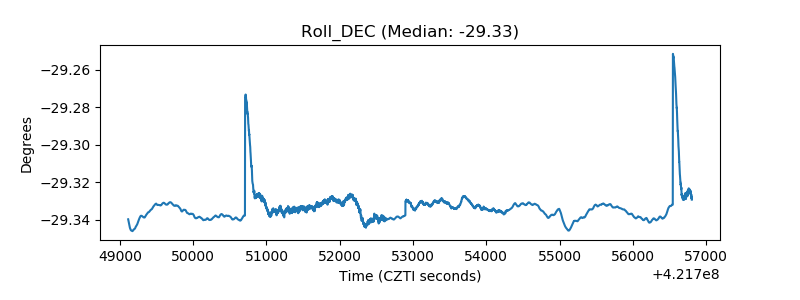 |
| _Roll_RA | 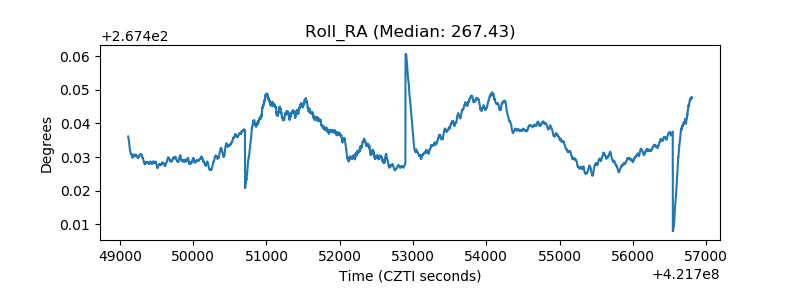 |
| Veto Counter | 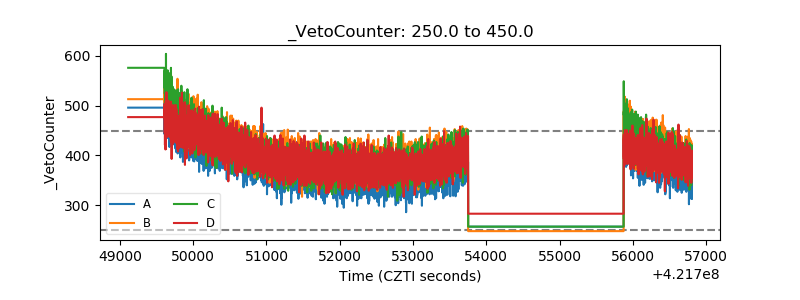 |