| Param | Original file | Final file |
|---|---|---|
| Filename | modeM0/AS1T05_102T01_9000005634_41231cztM0_level2.fits | modeM0/AS1T05_102T01_9000005634_41231cztM0_level2_quad_clean.evt |
| Size (bytes) | 380,197,440 | 86,500,800 |
| Size | 362.6 MB | 82.5 MB |
| Events in quadrant A | 4,300,793 | 565,031 |
| Events in quadrant B | 2,929,326 | 593,606 |
| Events in quadrant C | 3,080,509 | 567,795 |
| Events in quadrant D | 3,357,100 | 527,952 |
| Mode M9 | |||
|---|---|---|---|
| Quadrant | BADHDUFLAG | Total packets | Discarded packets |
| A | 0 | 35 | 0 |
| B | 0 | 35 | 0 |
| C | 0 | 35 | 0 |
| D | 0 | 36 | 0 |
| Mode M0 | |||
|---|---|---|---|
| Quadrant | BADHDUFLAG | Total packets | Discarded packets |
| A | 0 | 16023 | 3 |
| B | 0 | 12234 | 2 |
| C | 0 | 12422 | 2 |
| D | 0 | 13522 | 2 |
| Mode SS | |||
|---|---|---|---|
| Quadrant | BADHDUFLAG | Total packets | Discarded packets |
| A | 0 | 104 | 0 |
| B | 0 | 104 | 0 |
| C | 0 | 104 | 0 |
| D | 0 | 104 | 0 |
| Quadrant | Total seconds | Saturated seconds | Saturation percentage |
|---|---|---|---|
| A | 5217 | 324 | 6.210466% |
| B | 5217 | 117 | 2.242668% |
| C | 5217 | 151 | 2.894384% |
| D | 5217 | 166 | 3.181905% |
Noise dominated data is calculated using 1-second bins in cleaned event files. If a bin has >2000 counts, and if more than 50% of those come from <1% of pixels, then it is considered to be noise-dominated and hence unusable.
| Quadrant | # 1 sec bins | Bins with >0 counts | Bins with >2000 counts | High rate bins dominated by noise | Noise dominated (total time) | Noise dominated (detector-on time) | Marked lightcurve |
|---|---|---|---|---|---|---|---|
| A | 7131 | 5218 | 382 | 382 | 5.36% | 7.32% | 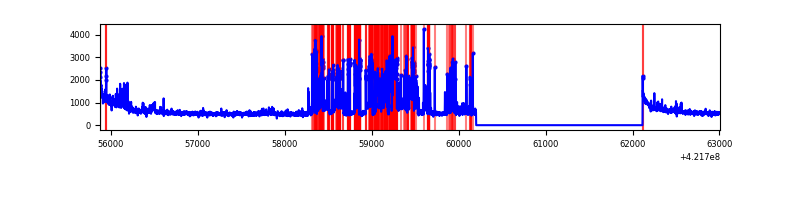 |
| B | 7131 | 5218 | 90 | 90 | 1.26% | 1.72% | 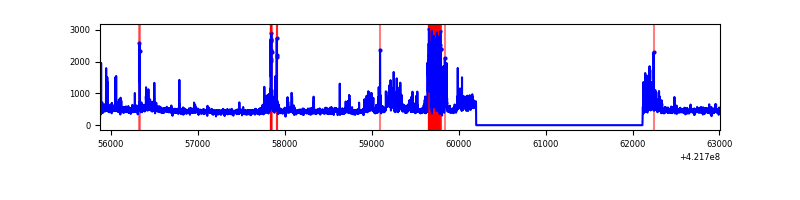 |
| C | 7131 | 5218 | 146 | 146 | 2.05% | 2.80% | 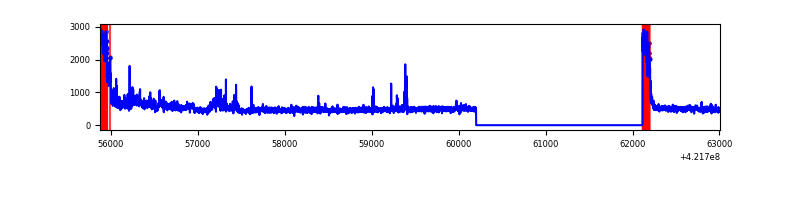 |
| D | 7131 | 5218 | 174 | 174 | 2.44% | 3.33% | 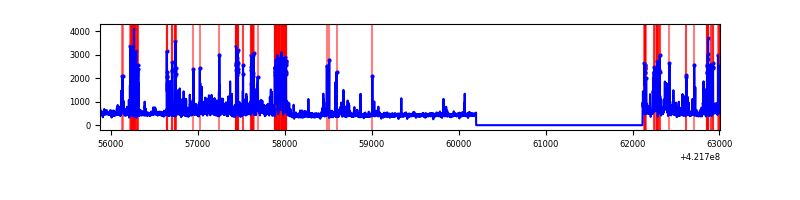 |
Top three noisy pixels from each quadrant. If the there are fewer than three noisy pixels in the level2.evt file, extra rows are filled as -1
| Pixel properties | Quadrant properties | ||||||
|---|---|---|---|---|---|---|---|
| Quadrant | DetID | PixID | Counts | Sigma | Mean | Median | Sigma |
| A | 0 | 8 | 1567653 | 13399.31 | 568 | 557 | 117.0 |
| A | 10 | 83 | 503556 | 4300.85 | 568 | 557 | 117.0 |
| A | 2 | 79 | 22134 | 184.49 | 568 | 557 | 117.0 |
| B | 0 | 229 | 441708 | 3908.76 | 576 | 559 | 112.9 |
| B | 0 | 190 | 129761 | 1144.78 | 576 | 559 | 112.9 |
| B | 5 | 255 | 56611 | 496.64 | 576 | 559 | 112.9 |
| C | 0 | 10 | 390145 | 2957.67 | 560 | 562 | 131.7 |
| C | 9 | 54 | 273014 | 2068.42 | 560 | 562 | 131.7 |
| C | 15 | 214 | 221729 | 1679.07 | 560 | 562 | 131.7 |
| D | 5 | 222 | 628055 | 4493.54 | 563 | 547 | 139.6 |
| D | 13 | 249 | 291766 | 2085.4 | 563 | 547 | 139.6 |
| D | 2 | 249 | 93088 | 662.68 | 563 | 547 | 139.6 |
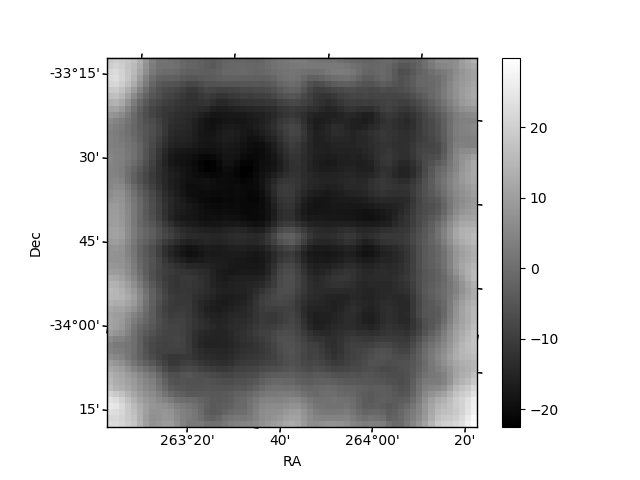
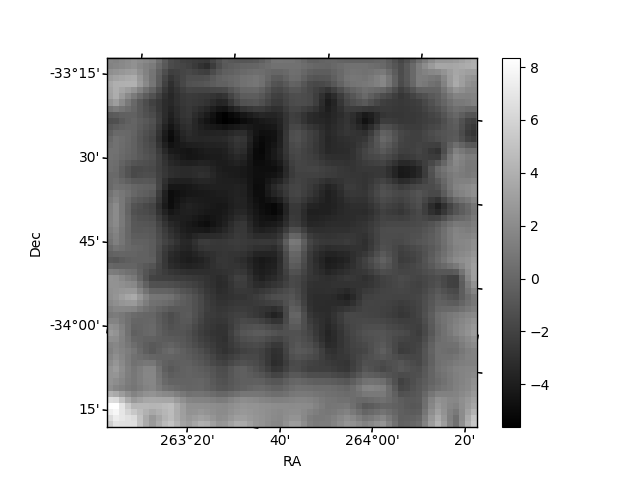
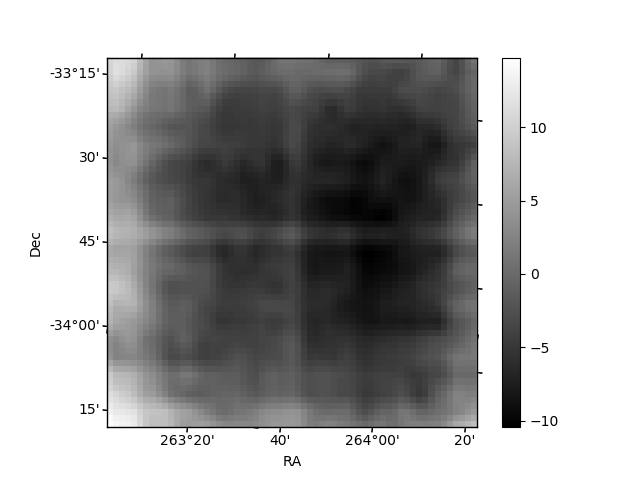
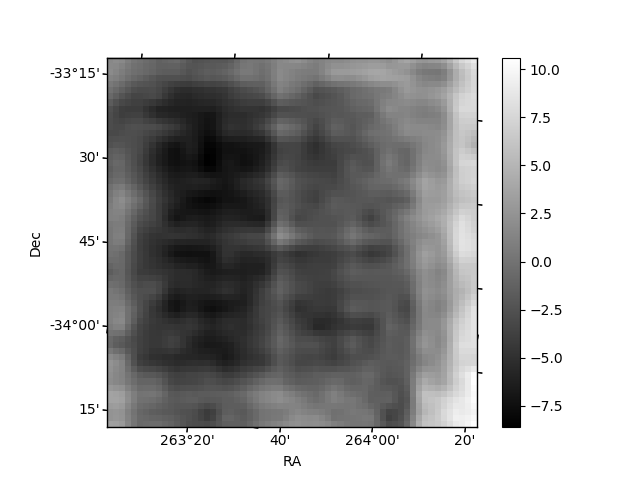
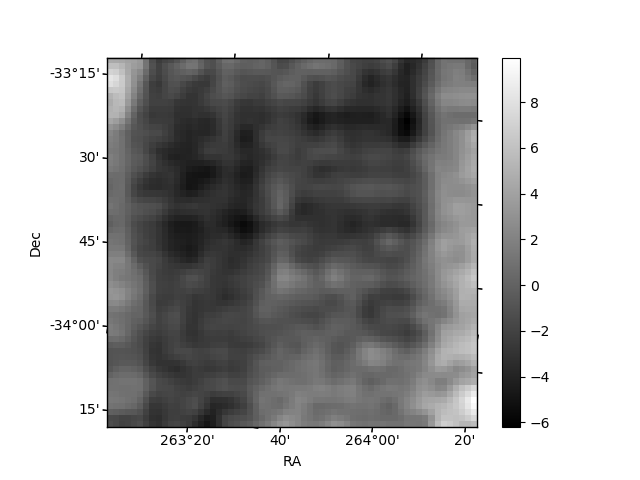
Histogram calculated using DETX and DETY for each event in the final _common_clean file
| Quadrant A | 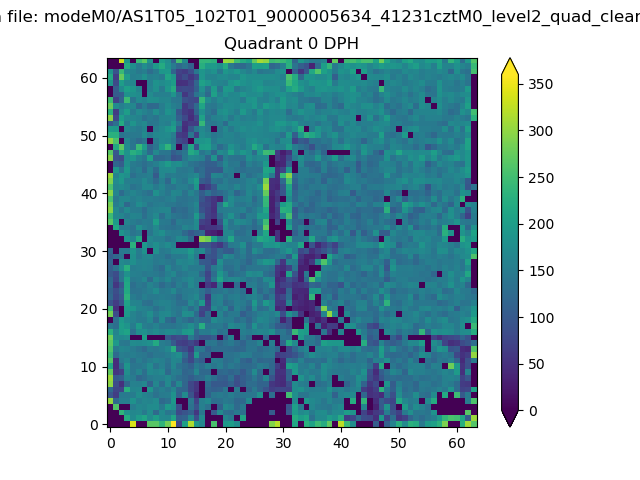 |
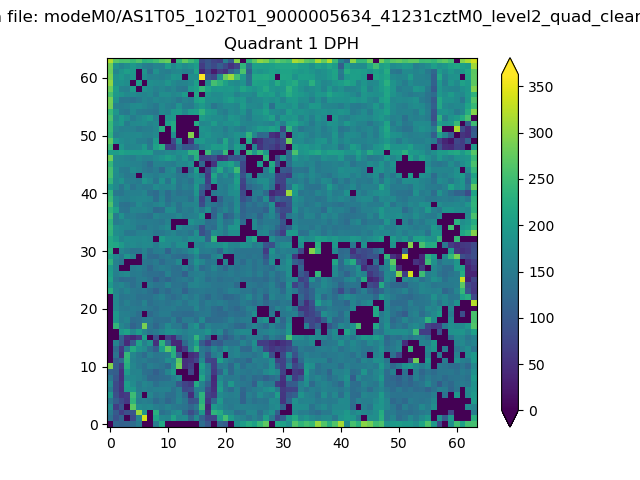 |
Quadrant B |
|---|---|---|---|
| Quadrant D | 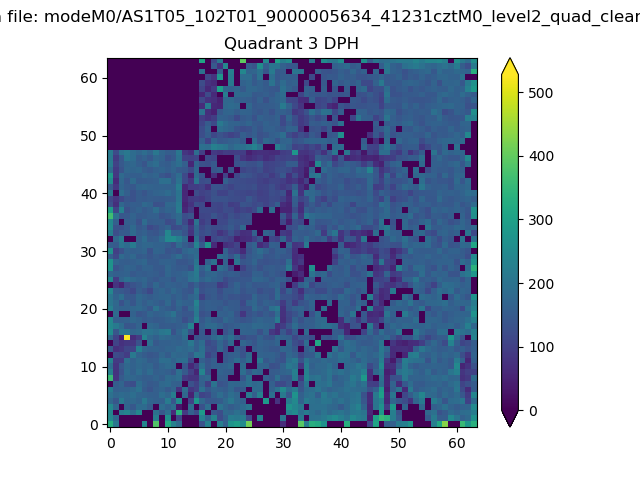 |
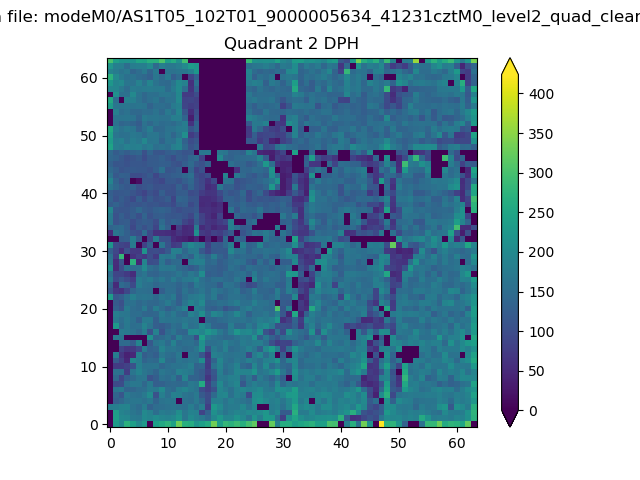 |
Quadrant C |
| Plot type | Count rate plots | Images |
|---|---|---|
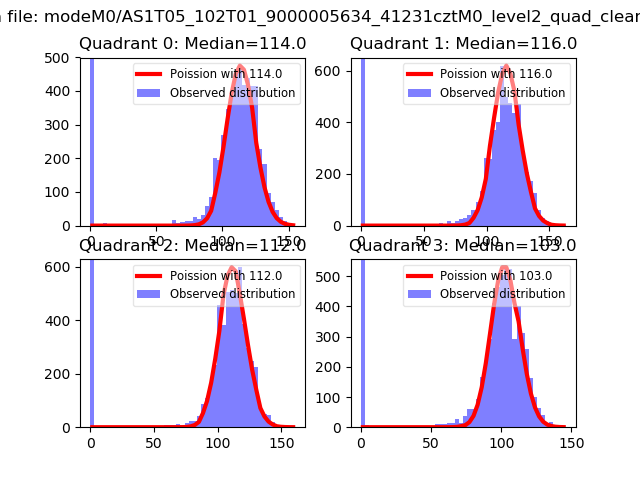
| Comparison with Poisson distribution Blue bars denote a histogram of data divided into 1 sec bins. Red curve is a Poisson curve with rate = median count rate of data. |
 |
 |
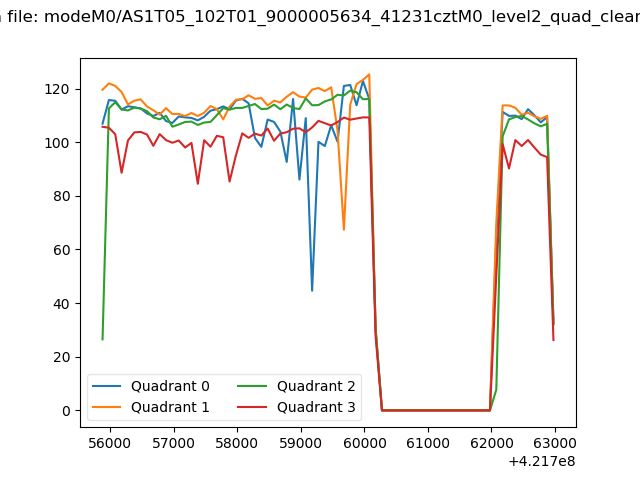
| Quadrant-wise count rates Data is divided into 100 sec bins |
 |
|
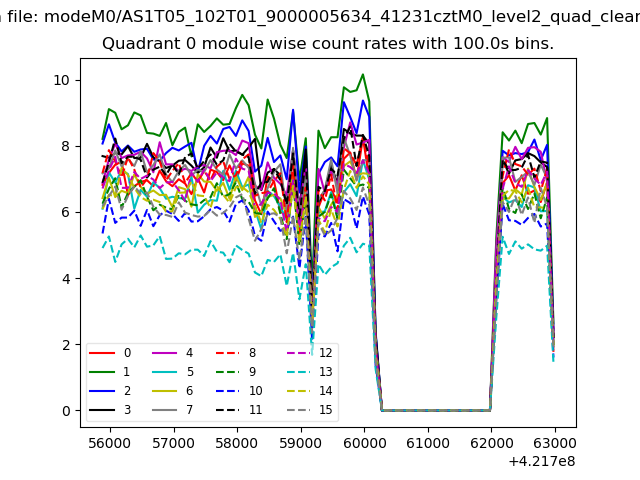
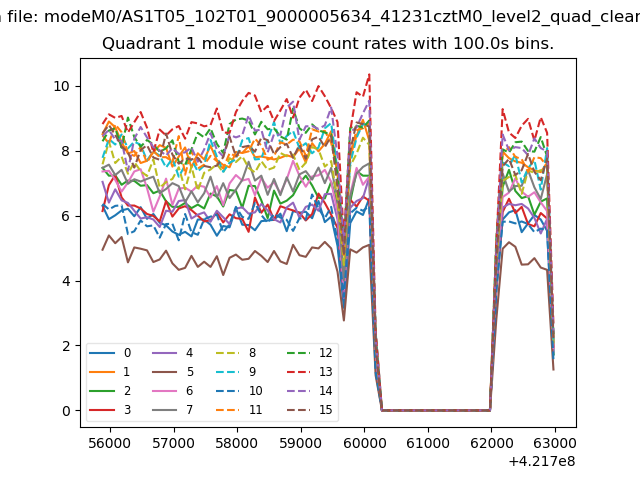
| Module-wise count rates for Quadrant A Data is divided into 100 sec bins |
 |
 |
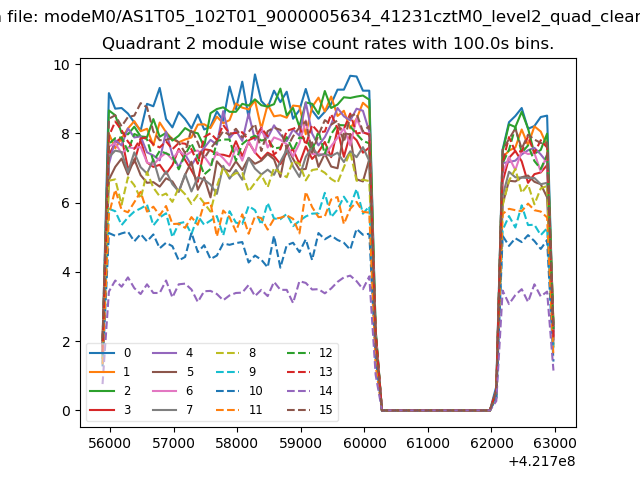
| Module-wise count rates for Quadrant B Data is divided into 100 sec bins |
 |
 |
| Module-wise count rates for Quadrant C Data is divided into 100 sec bins |
 |
 |
| Module-wise count rates for Quadrant D Data is divided into 100 sec bins |
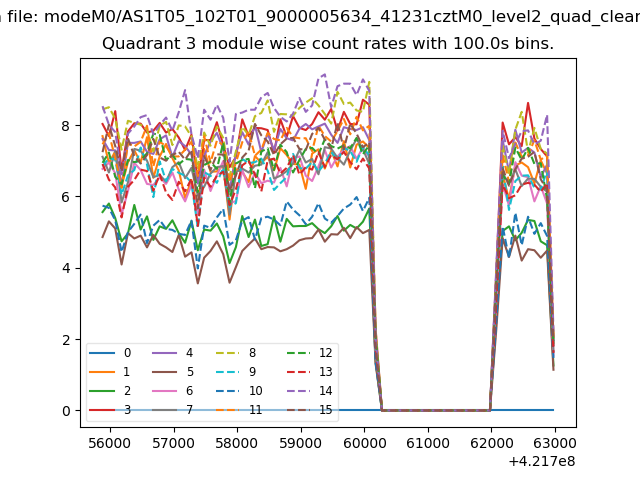 |
 |
| Parameter | Plot |
|---|---|
| CZT HV Monitor | 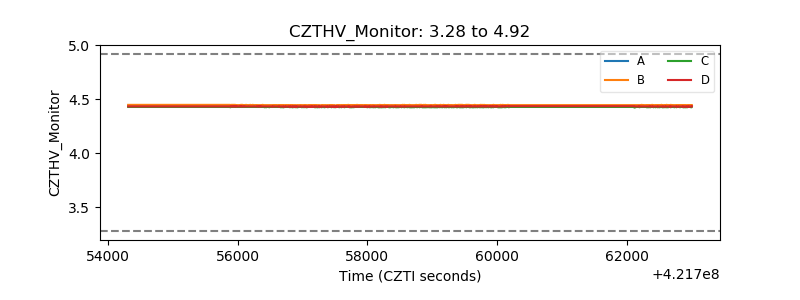 |
| D_VDD | 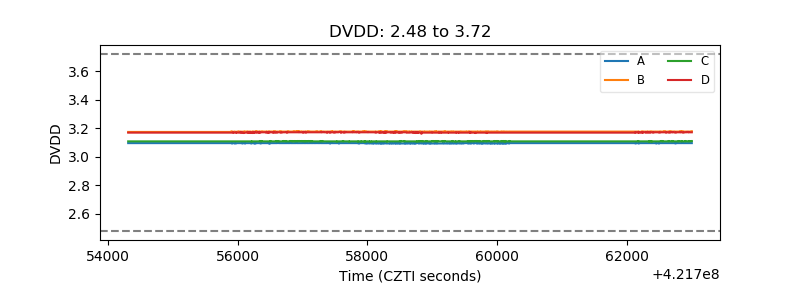 |
| Temperature 1 | 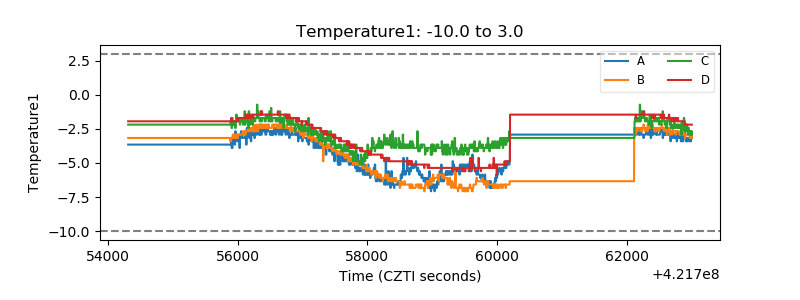 |
| Veto HV Monitor | 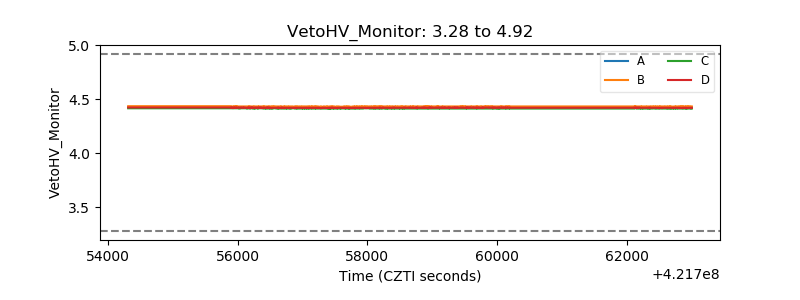 |
| Veto LLD | 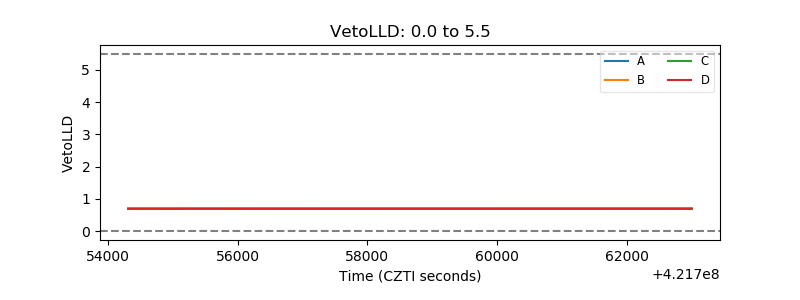 |
| Alpha Counter | 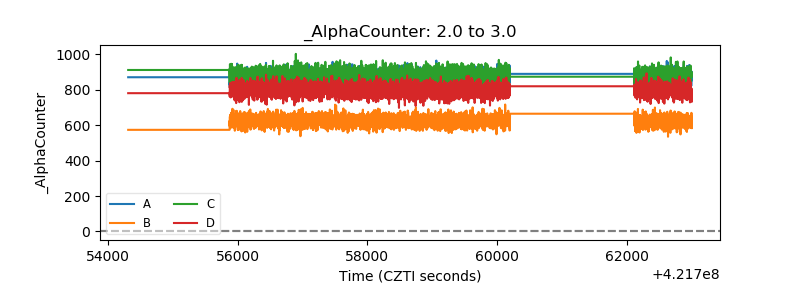 |
| _CPM_Rate | 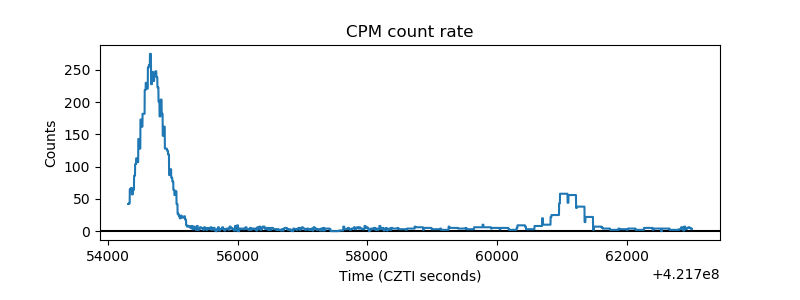 |
| CZT Counter | 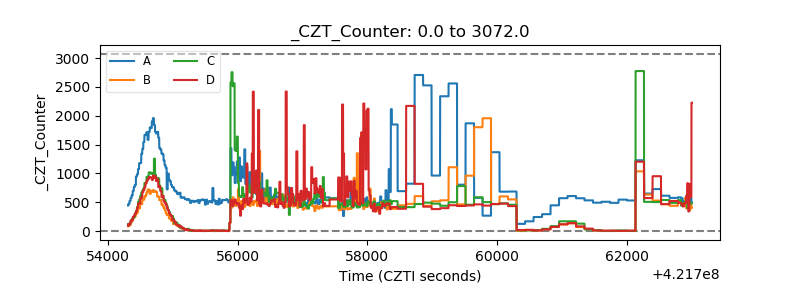 |
| +2.5 Volts monitor | 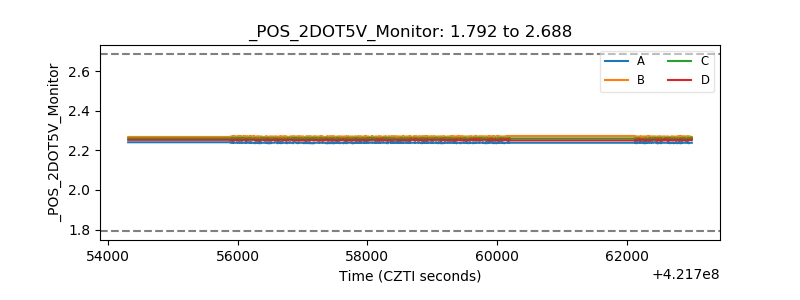 |
| +5 Volts monitor | 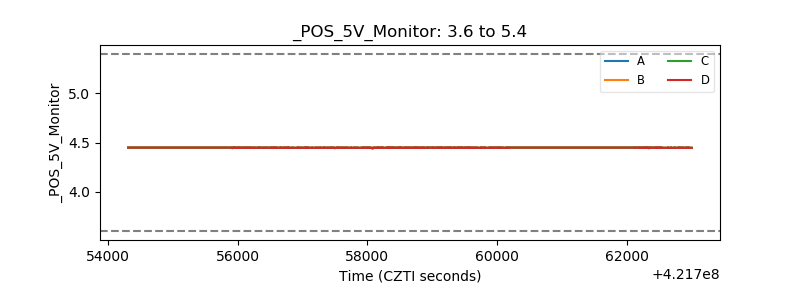 |
| _ROLL_ROT | 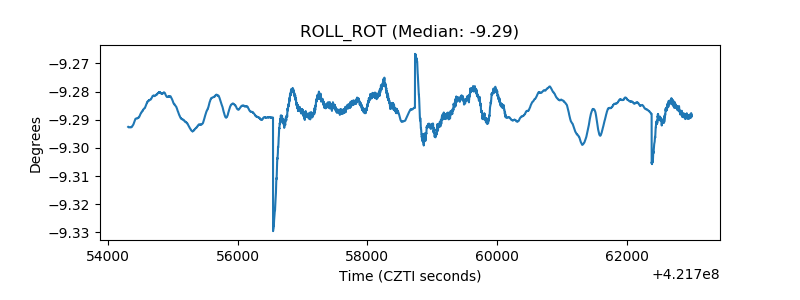 |
| _Roll_DEC | 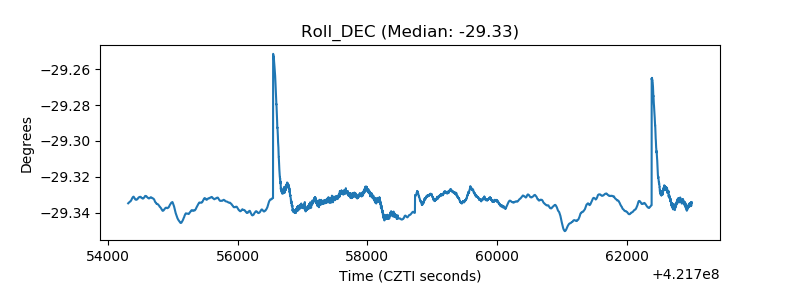 |
| _Roll_RA | 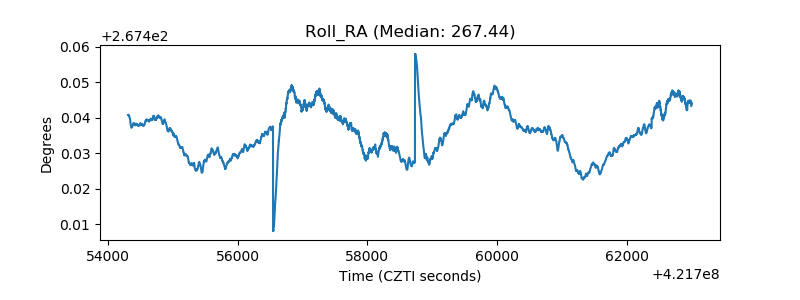 |
| Veto Counter | 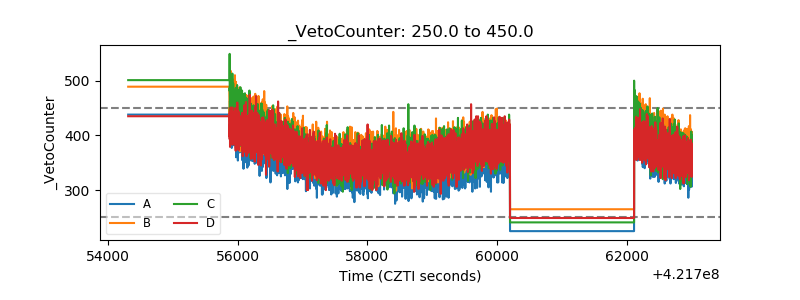 |