| Param | Original file | Final file |
|---|---|---|
| Filename | modeM0/AS1T05_102T01_9000005634_41232cztM0_level2.fits | modeM0/AS1T05_102T01_9000005634_41232cztM0_level2_quad_clean.evt |
| Size (bytes) | 361,653,120 | 91,722,240 |
| Size | 344.9 MB | 87.5 MB |
| Events in quadrant A | 3,261,046 | 619,945 |
| Events in quadrant B | 2,648,684 | 633,666 |
| Events in quadrant C | 3,042,047 | 595,993 |
| Events in quadrant D | 4,000,144 | 537,201 |
| Mode M9 | |||
|---|---|---|---|
| Quadrant | BADHDUFLAG | Total packets | Discarded packets |
| A | 0 | 27 | 0 |
| B | 0 | 27 | 0 |
| C | 0 | 27 | 0 |
| D | 0 | 28 | 0 |
| Mode M0 | |||
|---|---|---|---|
| Quadrant | BADHDUFLAG | Total packets | Discarded packets |
| A | 0 | 13131 | 3 |
| B | 0 | 11763 | 2 |
| C | 0 | 12493 | 2 |
| D | 0 | 15633 | 2 |
| Mode SS | |||
|---|---|---|---|
| Quadrant | BADHDUFLAG | Total packets | Discarded packets |
| A | 0 | 112 | 0 |
| B | 0 | 112 | 0 |
| C | 0 | 112 | 0 |
| D | 0 | 112 | 0 |
| Quadrant | Total seconds | Saturated seconds | Saturation percentage |
|---|---|---|---|
| A | 5588 | 62 | 1.109520% |
| B | 5588 | 17 | 0.304223% |
| C | 5588 | 166 | 2.970651% |
| D | 5588 | 363 | 6.496063% |
Noise dominated data is calculated using 1-second bins in cleaned event files. If a bin has >2000 counts, and if more than 50% of those come from <1% of pixels, then it is considered to be noise-dominated and hence unusable.
| Quadrant | # 1 sec bins | Bins with >0 counts | Bins with >2000 counts | High rate bins dominated by noise | Noise dominated (total time) | Noise dominated (detector-on time) | Marked lightcurve |
|---|---|---|---|---|---|---|---|
| A | 7171 | 5589 | 48 | 48 | 0.67% | 0.86% | 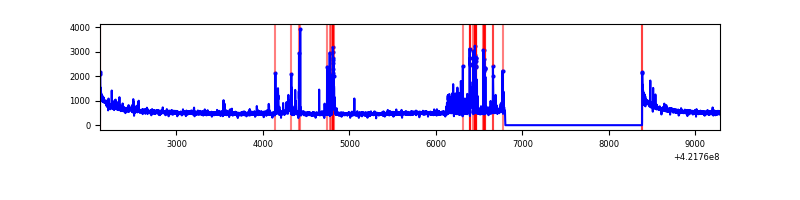 |
| B | 7171 | 5589 | 3 | 3 | 0.04% | 0.05% | 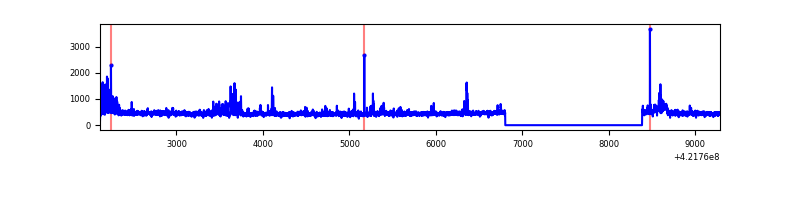 |
| C | 7171 | 5589 | 161 | 161 | 2.25% | 2.88% | 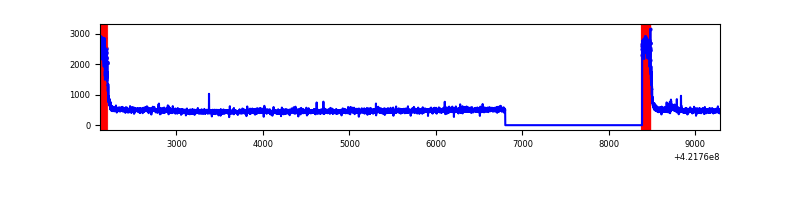 |
| D | 7171 | 5589 | 341 | 341 | 4.76% | 6.10% | 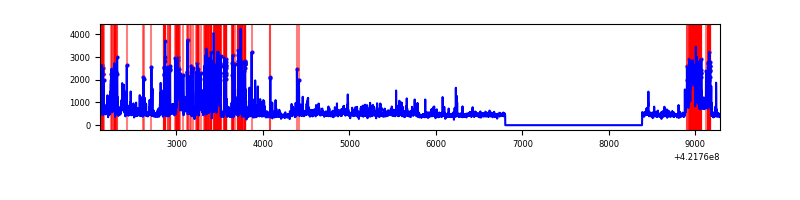 |
Top three noisy pixels from each quadrant. If the there are fewer than three noisy pixels in the level2.evt file, extra rows are filled as -1
| Pixel properties | Quadrant properties | ||||||
|---|---|---|---|---|---|---|---|
| Quadrant | DetID | PixID | Counts | Sigma | Mean | Median | Sigma |
| A | 10 | 83 | 538017 | 4299.44 | 611 | 598 | 125.0 |
| A | 0 | 8 | 327064 | 2611.78 | 611 | 598 | 125.0 |
| A | 2 | 79 | 12948 | 98.8 | 611 | 598 | 125.0 |
| B | 0 | 190 | 91520 | 760.22 | 610 | 591 | 119.6 |
| B | 0 | 229 | 46164 | 381.02 | 610 | 591 | 119.6 |
| B | 5 | 255 | 44224 | 364.8 | 610 | 591 | 119.6 |
| C | 0 | 10 | 441772 | 3175.31 | 591 | 594 | 138.9 |
| C | 15 | 214 | 237067 | 1701.98 | 591 | 594 | 138.9 |
| C | 9 | 54 | 58030 | 413.39 | 591 | 594 | 138.9 |
| D | 5 | 222 | 720637 | 4996.81 | 586 | 570 | 144.1 |
| D | 13 | 249 | 540903 | 3749.57 | 586 | 570 | 144.1 |
| D | 2 | 249 | 271732 | 1881.69 | 586 | 570 | 144.1 |
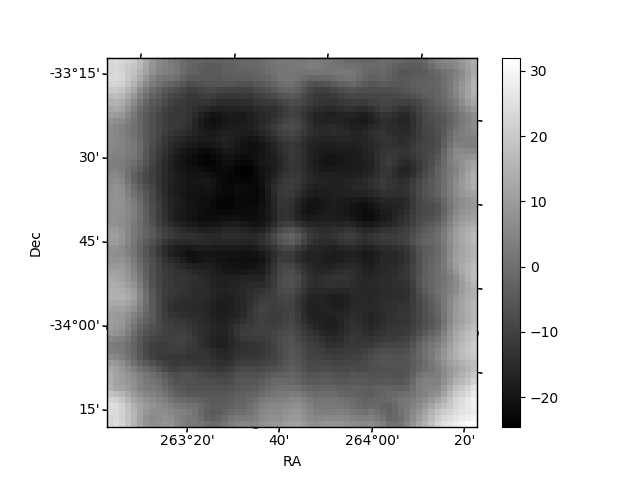
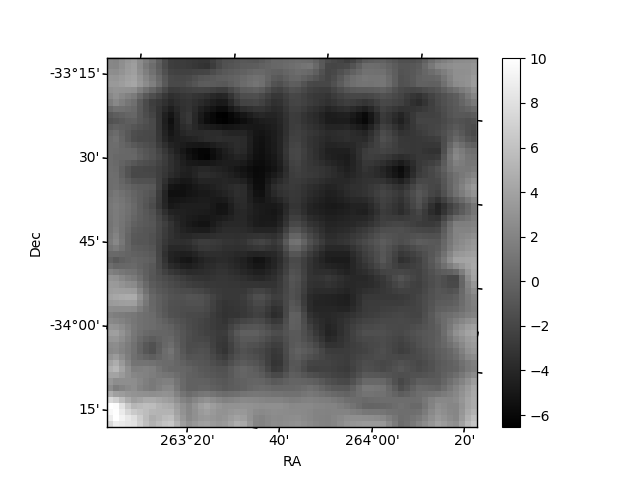
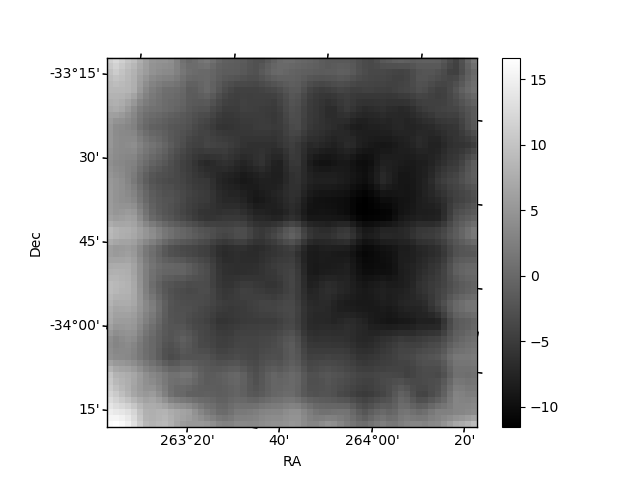
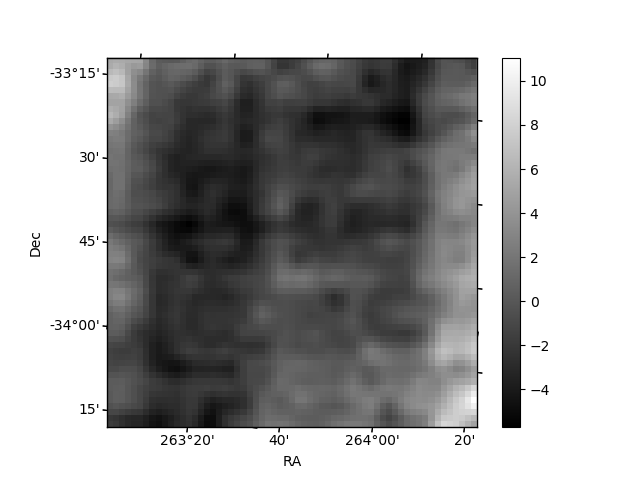
Histogram calculated using DETX and DETY for each event in the final _common_clean file
| Quadrant A | 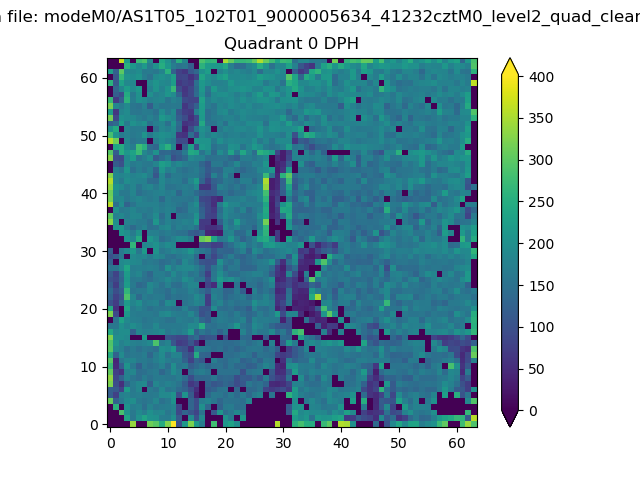 |
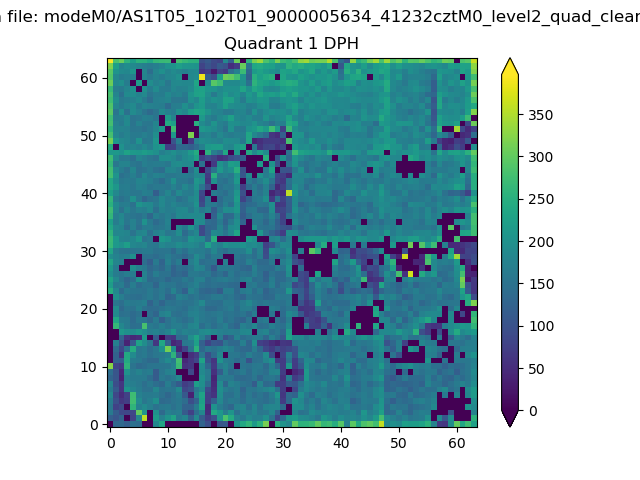 |
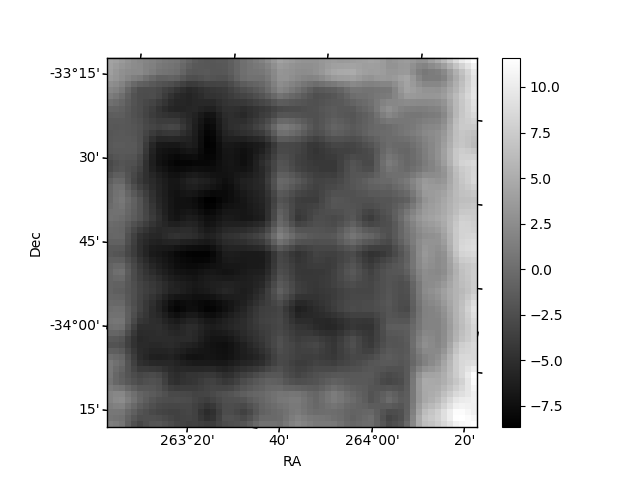
Quadrant B |
|---|---|---|---|
| Quadrant D | 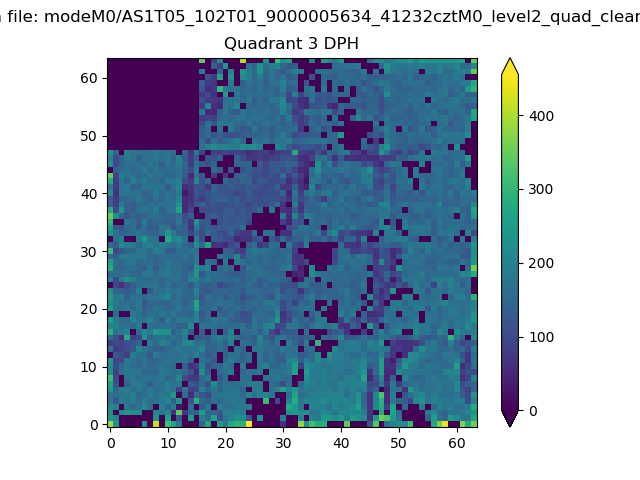 |
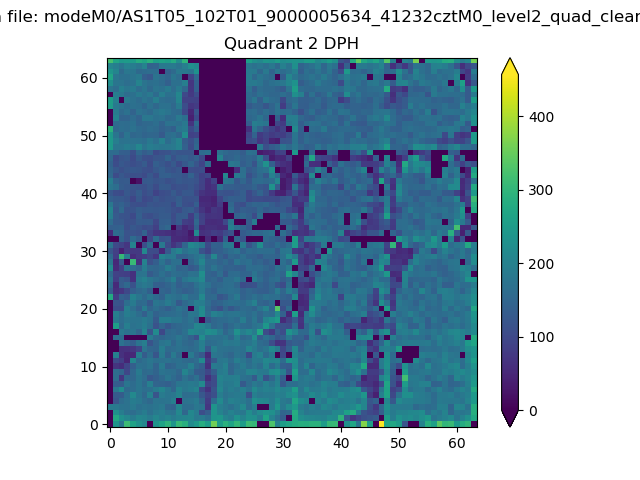 |
Quadrant C |
| Plot type | Count rate plots | Images |
|---|---|---|
| Comparison with Poisson distribution Blue bars denote a histogram of data divided into 1 sec bins. Red curve is a Poisson curve with rate = median count rate of data. |
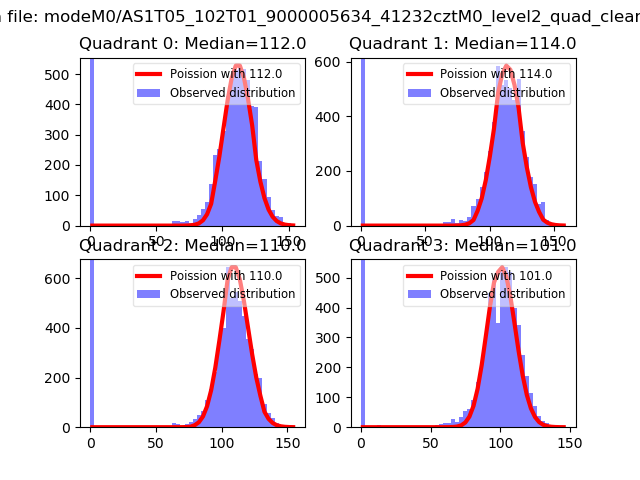 |
 |
| Quadrant-wise count rates Data is divided into 100 sec bins |
 |
|
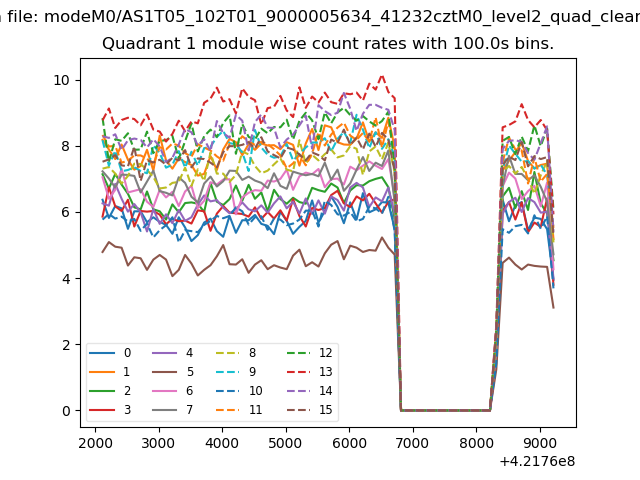
| Module-wise count rates for Quadrant A Data is divided into 100 sec bins |
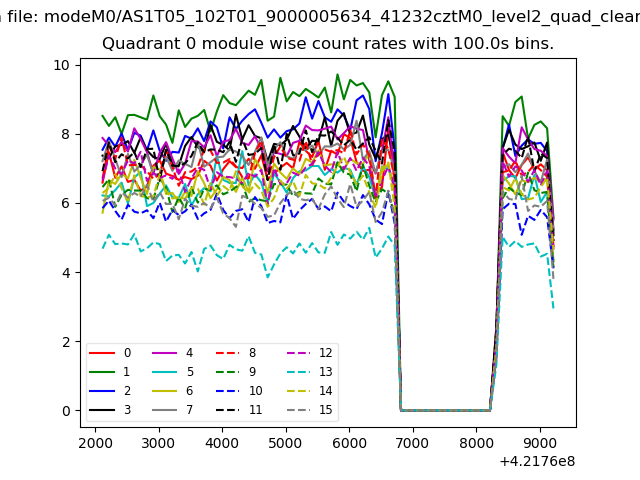 |
 |
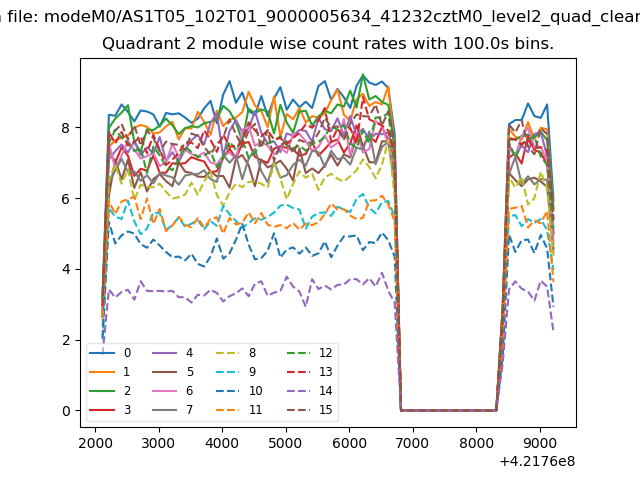
| Module-wise count rates for Quadrant B Data is divided into 100 sec bins |
 |
 |
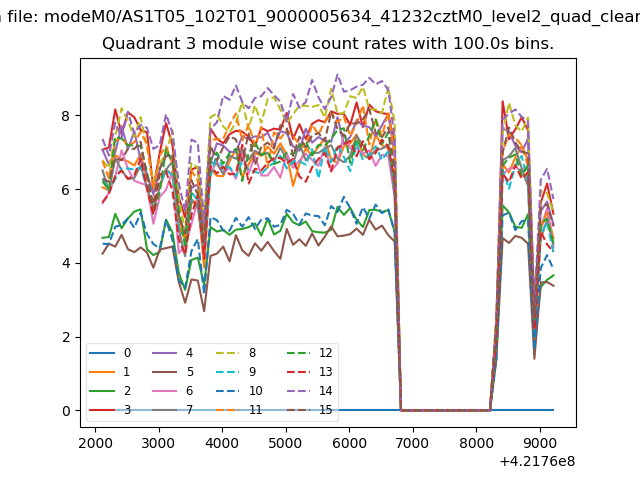
| Module-wise count rates for Quadrant C Data is divided into 100 sec bins |
 |
 |
| Module-wise count rates for Quadrant D Data is divided into 100 sec bins |
 |
 |
| Parameter | Plot |
|---|---|
| CZT HV Monitor | 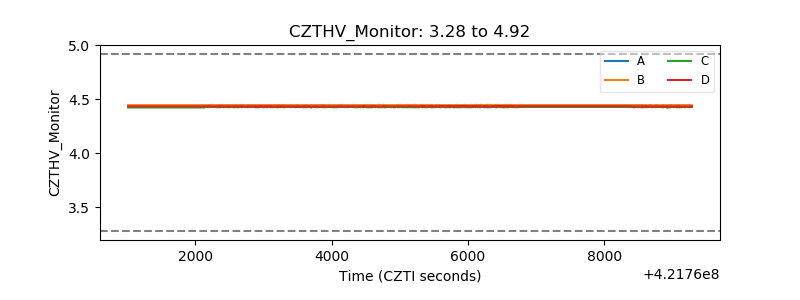 |
| D_VDD | 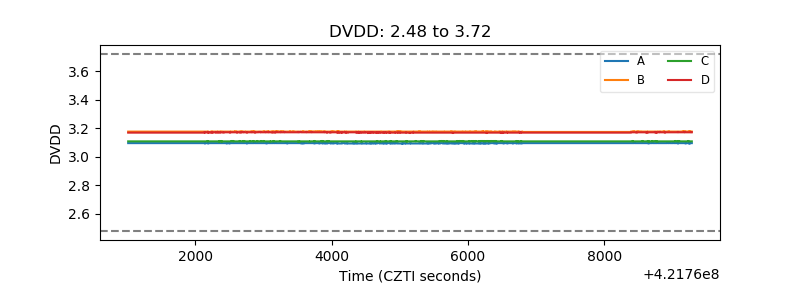 |
| Temperature 1 | 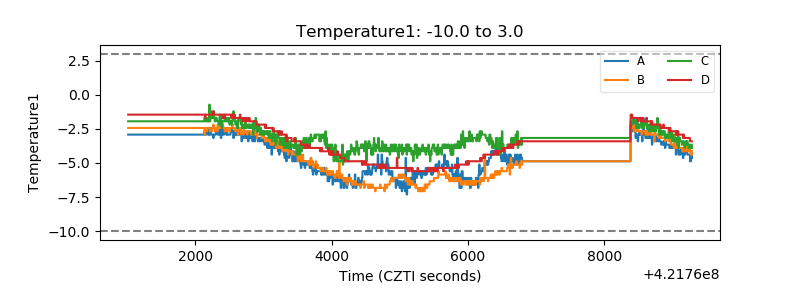 |
| Veto HV Monitor | 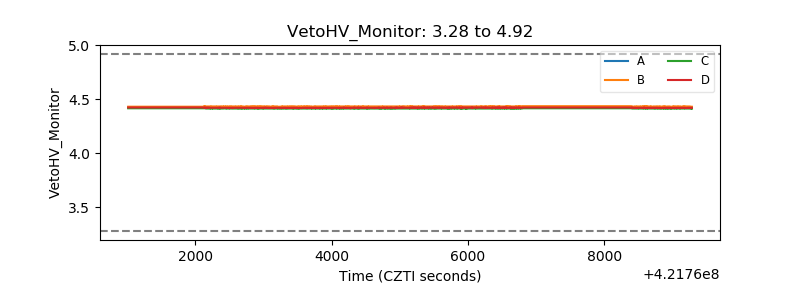 |
| Veto LLD | 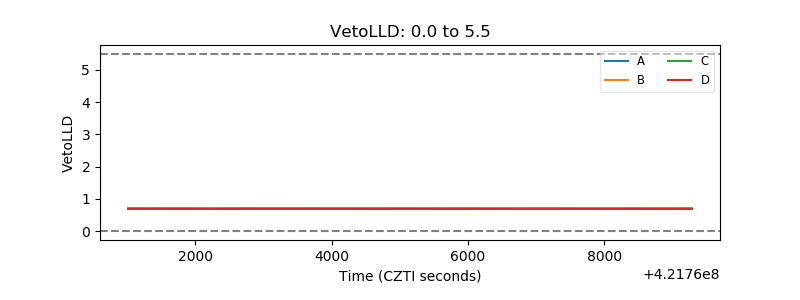 |
| Alpha Counter | 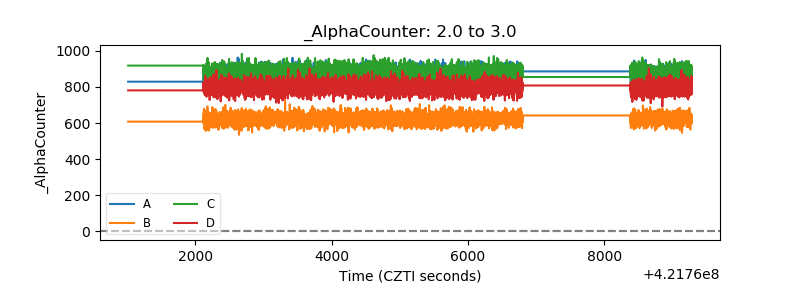 |
| _CPM_Rate | 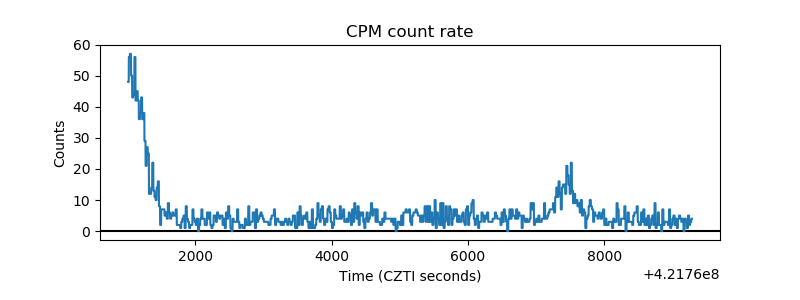 |
| CZT Counter | 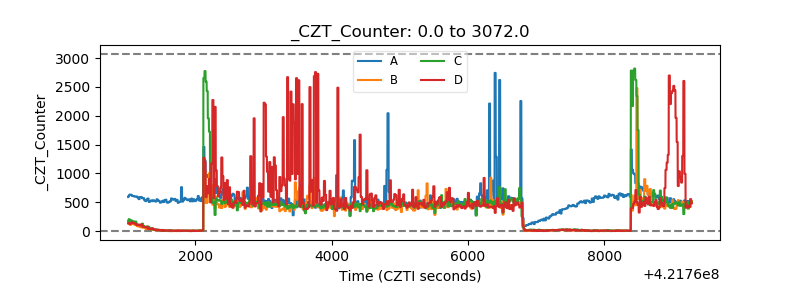 |
| +2.5 Volts monitor | 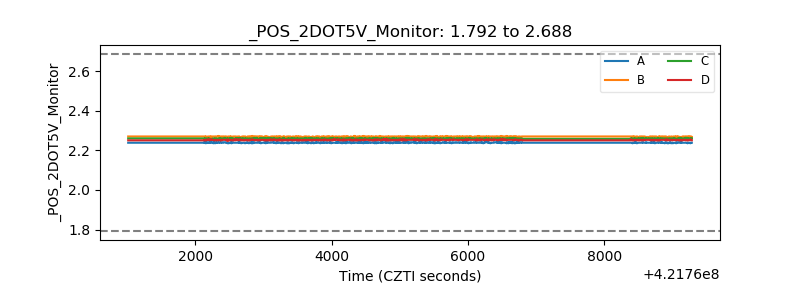 |
| +5 Volts monitor | 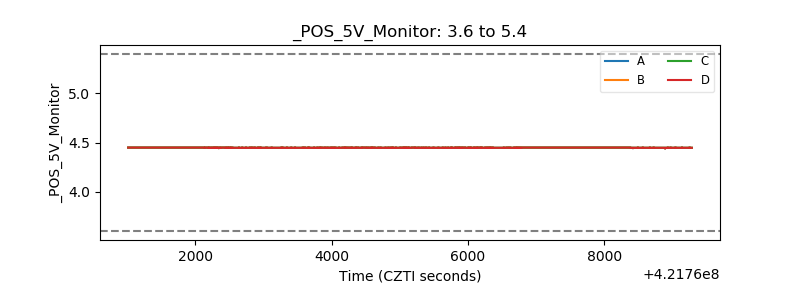 |
| _ROLL_ROT | 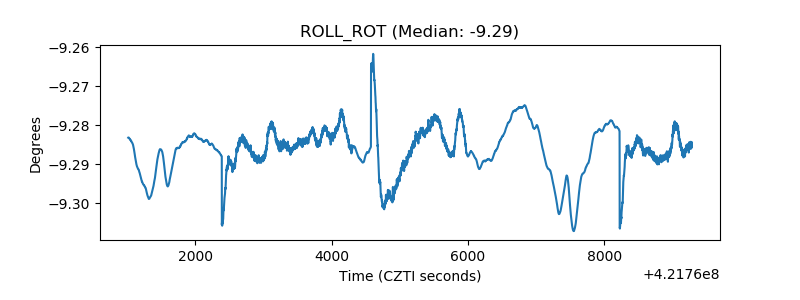 |
| _Roll_DEC | 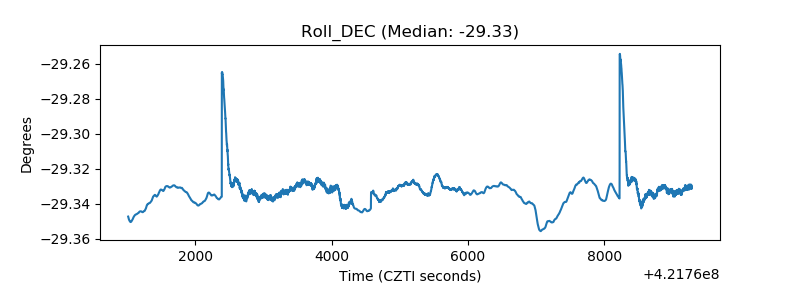 |
| _Roll_RA | 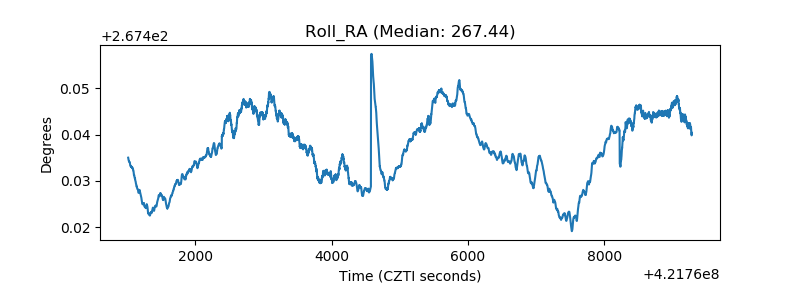 |
| Veto Counter | 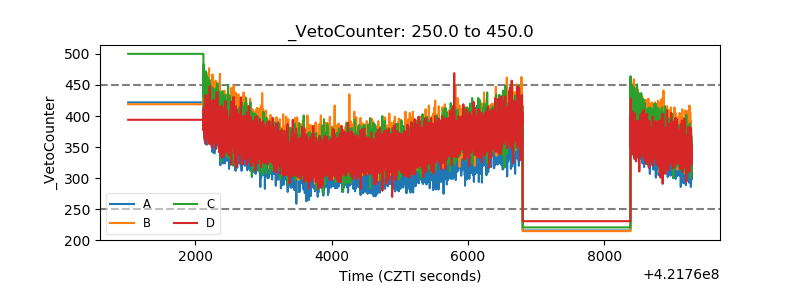 |