| Param | Original file | Final file |
|---|---|---|
| Filename | modeM0/AS1T05_102T01_9000005634_41234cztM0_level2.fits | modeM0/AS1T05_102T01_9000005634_41234cztM0_level2_quad_clean.evt |
| Size (bytes) | 482,434,560 | 99,613,440 |
| Size | 460.1 MB | 95.0 MB |
| Events in quadrant A | 5,497,528 | 612,950 |
| Events in quadrant B | 3,354,793 | 698,855 |
| Events in quadrant C | 5,125,115 | 655,022 |
| Events in quadrant D | 3,398,876 | 615,579 |
| Mode M9 | |||
|---|---|---|---|
| Quadrant | BADHDUFLAG | Total packets | Discarded packets |
| A | 0 | 26 | 0 |
| B | 0 | 26 | 0 |
| C | 0 | 26 | 0 |
| D | 0 | 26 | 0 |
| Mode M0 | |||
|---|---|---|---|
| Quadrant | BADHDUFLAG | Total packets | Discarded packets |
| A | 0 | 20428 | 3 |
| B | 0 | 14118 | 2 |
| C | 0 | 19472 | 2 |
| D | 0 | 14385 | 2 |
| Mode SS | |||
|---|---|---|---|
| Quadrant | BADHDUFLAG | Total packets | Discarded packets |
| A | 0 | 130 | 0 |
| B | 0 | 130 | 0 |
| C | 0 | 130 | 0 |
| D | 0 | 130 | 0 |
| Quadrant | Total seconds | Saturated seconds | Saturation percentage |
|---|---|---|---|
| A | 6207 | 736 | 11.857580% |
| B | 6207 | 56 | 0.902207% |
| C | 6207 | 200 | 3.222169% |
| D | 6207 | 89 | 1.433865% |
Noise dominated data is calculated using 1-second bins in cleaned event files. If a bin has >2000 counts, and if more than 50% of those come from <1% of pixels, then it is considered to be noise-dominated and hence unusable.
| Quadrant | # 1 sec bins | Bins with >0 counts | Bins with >2000 counts | High rate bins dominated by noise | Noise dominated (total time) | Noise dominated (detector-on time) | Marked lightcurve |
|---|---|---|---|---|---|---|---|
| A | 8864 | 6209 | 728 | 728 | 8.21% | 11.72% | 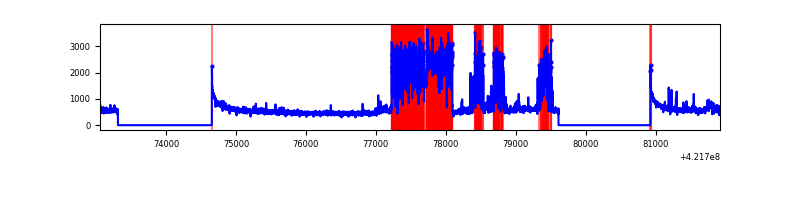 |
| B | 8864 | 6209 | 37 | 37 | 0.42% | 0.60% | 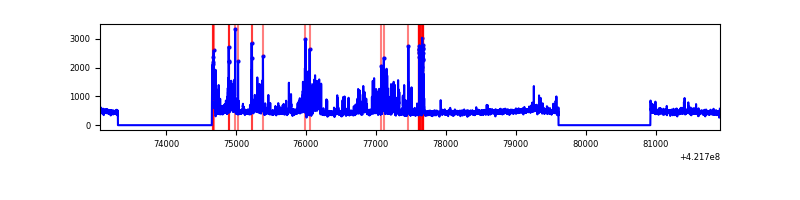 |
| C | 8864 | 6209 | 162 | 162 | 1.83% | 2.61% | 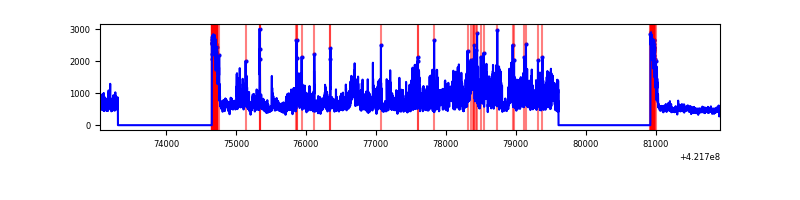 |
| D | 8864 | 6209 | 94 | 94 | 1.06% | 1.51% | 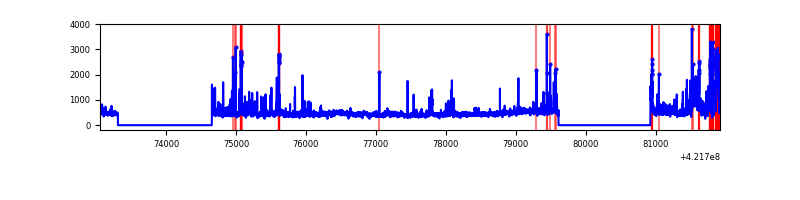 |
Top three noisy pixels from each quadrant. If the there are fewer than three noisy pixels in the level2.evt file, extra rows are filled as -1
| Pixel properties | Quadrant properties | ||||||
|---|---|---|---|---|---|---|---|
| Quadrant | DetID | PixID | Counts | Sigma | Mean | Median | Sigma |
| A | 0 | 8 | 2360541 | 17457.2 | 659 | 645 | 135.2 |
| A | 10 | 83 | 553015 | 4086.13 | 659 | 645 | 135.2 |
| A | 12 | 189 | 15029 | 106.4 | 659 | 645 | 135.2 |
| B | 5 | 255 | 460988 | 3480.24 | 675 | 656 | 132.3 |
| B | 0 | 229 | 148838 | 1120.3 | 675 | 656 | 132.3 |
| B | 0 | 245 | 33760 | 250.28 | 675 | 656 | 132.3 |
| C | 9 | 54 | 1888312 | 12138.96 | 659 | 663 | 155.5 |
| C | 0 | 10 | 379241 | 2434.53 | 659 | 663 | 155.5 |
| C | 15 | 214 | 261944 | 1680.22 | 659 | 663 | 155.5 |
| D | 2 | 120 | 256833 | 1557.64 | 665 | 646 | 164.5 |
| D | 13 | 249 | 166438 | 1008.03 | 665 | 646 | 164.5 |
| D | 2 | 249 | 144312 | 873.5 | 665 | 646 | 164.5 |
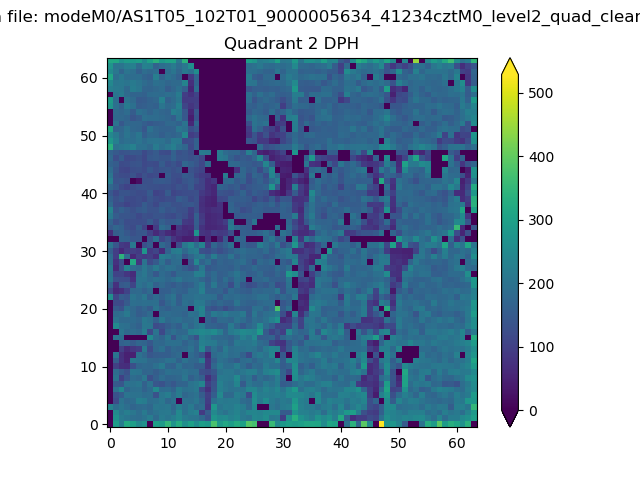
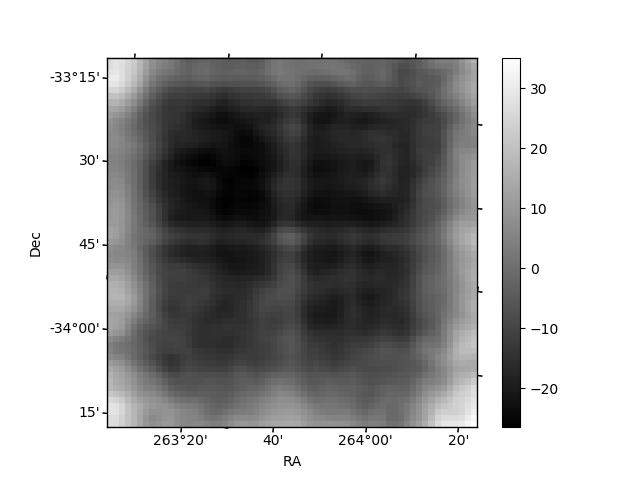
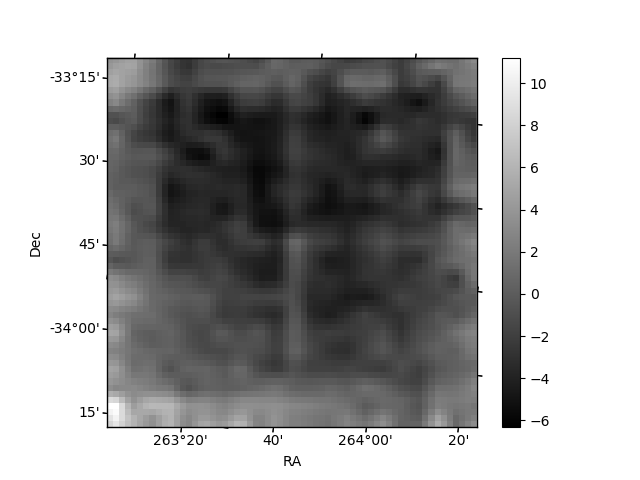
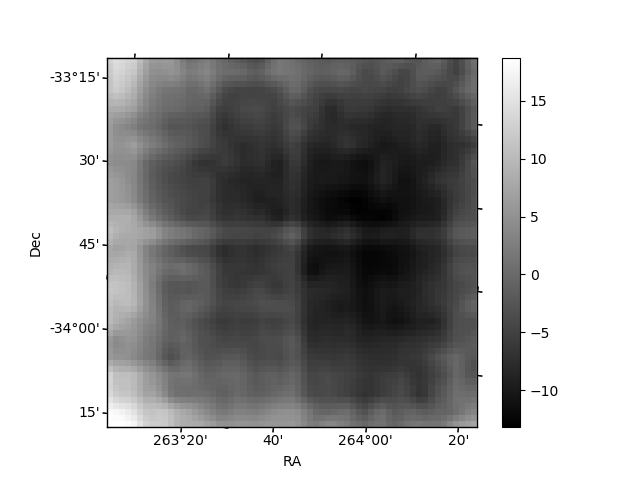
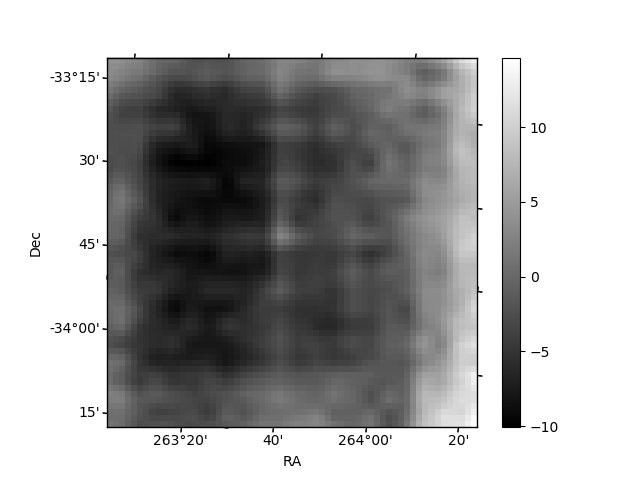
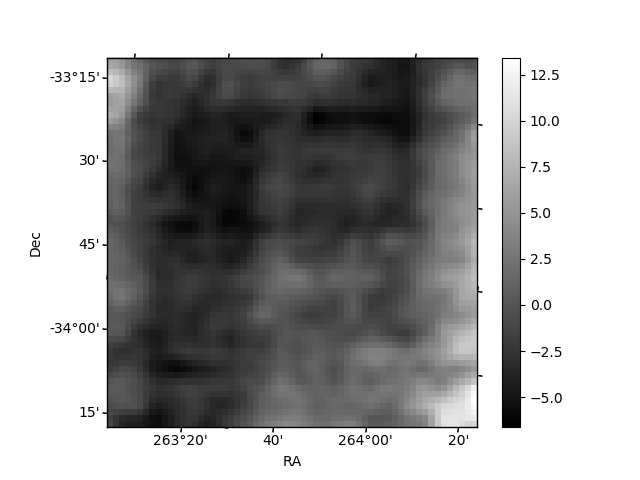
Histogram calculated using DETX and DETY for each event in the final _common_clean file
| Quadrant A | 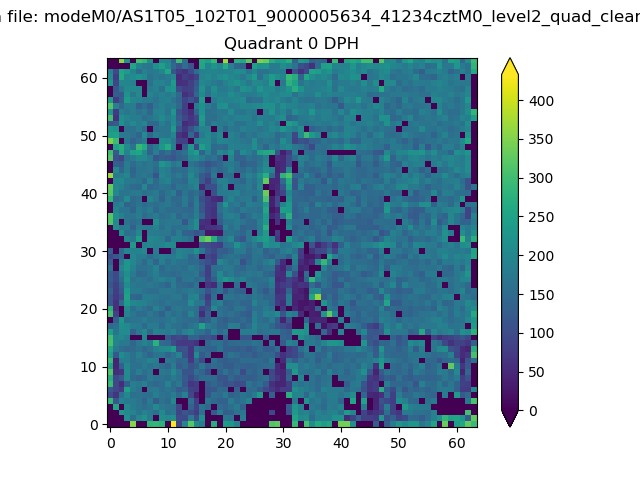 |
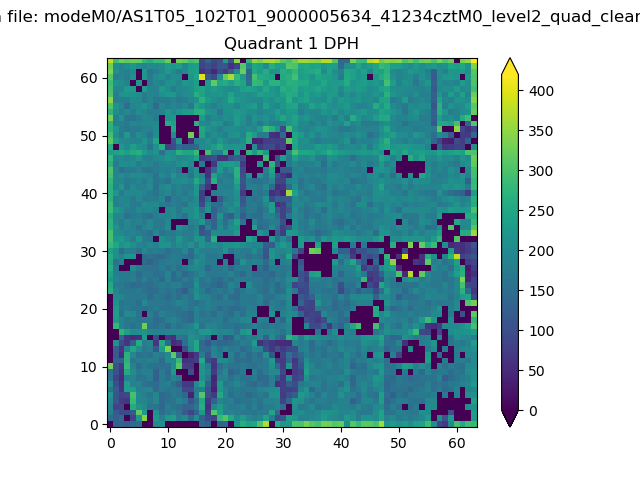 |
Quadrant B |
|---|---|---|---|
| Quadrant D | 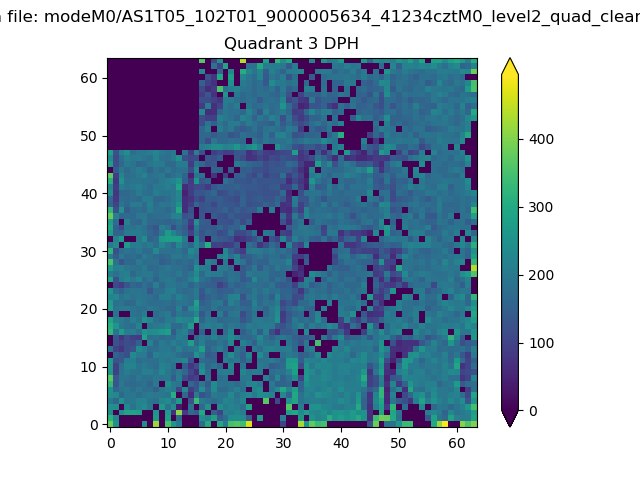 |
 |
Quadrant C |
| Plot type | Count rate plots | Images |
|---|---|---|
| Comparison with Poisson distribution Blue bars denote a histogram of data divided into 1 sec bins. Red curve is a Poisson curve with rate = median count rate of data. |
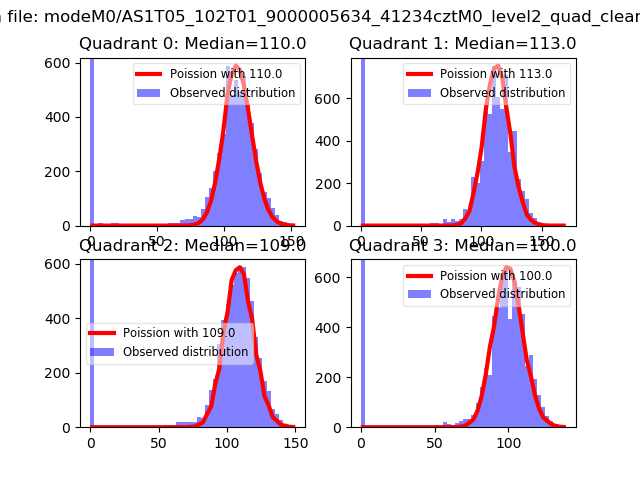 |
 |
| Quadrant-wise count rates Data is divided into 100 sec bins |
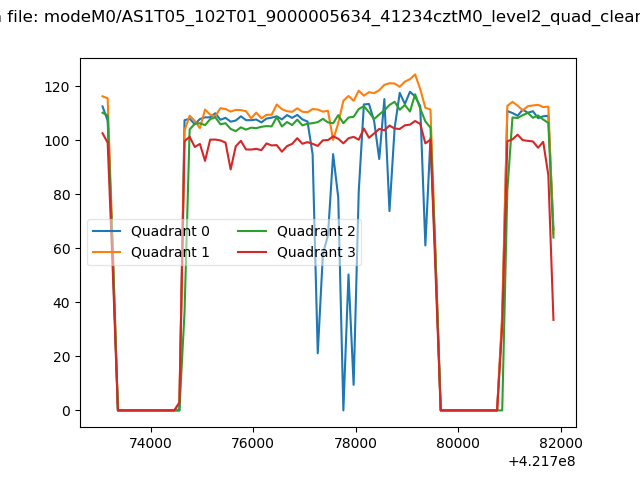 |
|
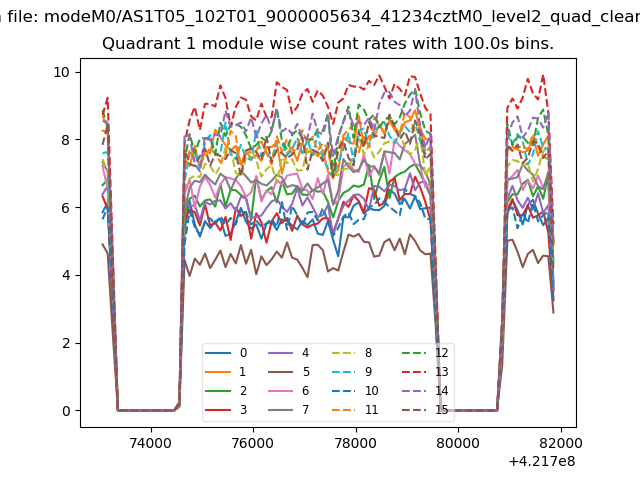
| Module-wise count rates for Quadrant A Data is divided into 100 sec bins |
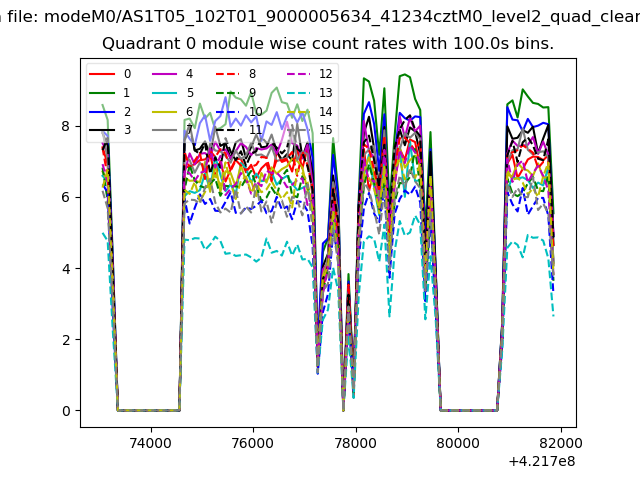 |
 |
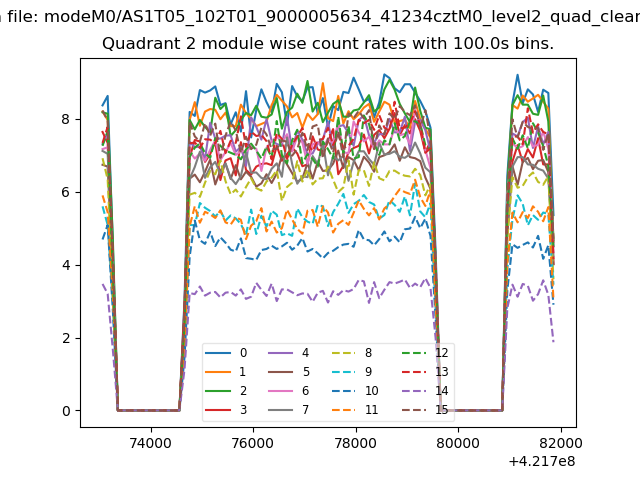
| Module-wise count rates for Quadrant B Data is divided into 100 sec bins |
 |
 |
| Module-wise count rates for Quadrant C Data is divided into 100 sec bins |
 |
 |
| Module-wise count rates for Quadrant D Data is divided into 100 sec bins |
 |
 |
| Parameter | Plot |
|---|---|
| CZT HV Monitor | 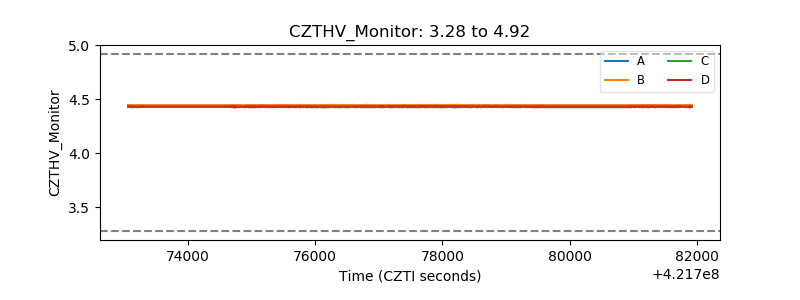 |
| D_VDD | 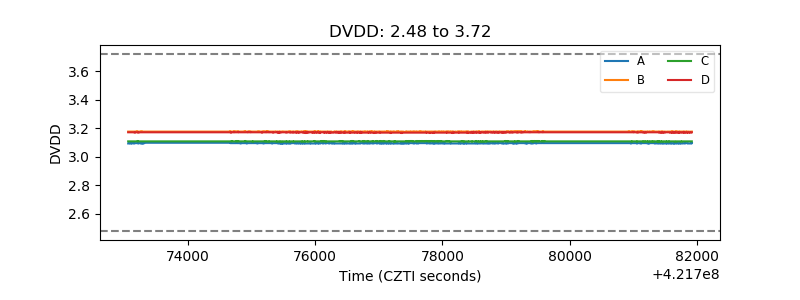 |
| Temperature 1 | 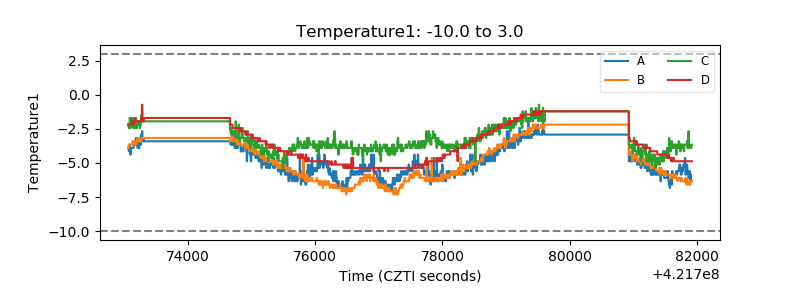 |
| Veto HV Monitor | 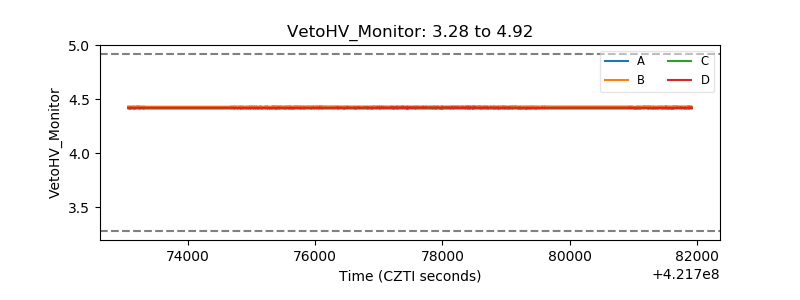 |
| Veto LLD | 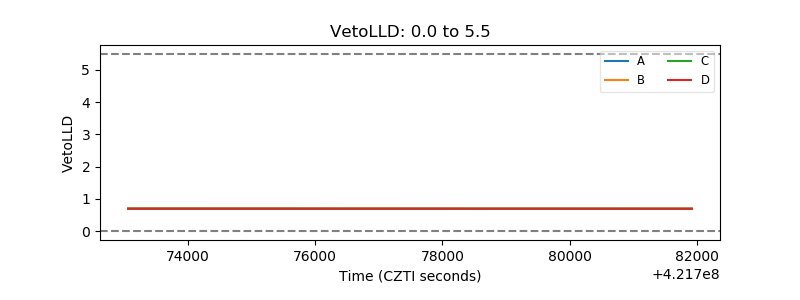 |
| Alpha Counter | 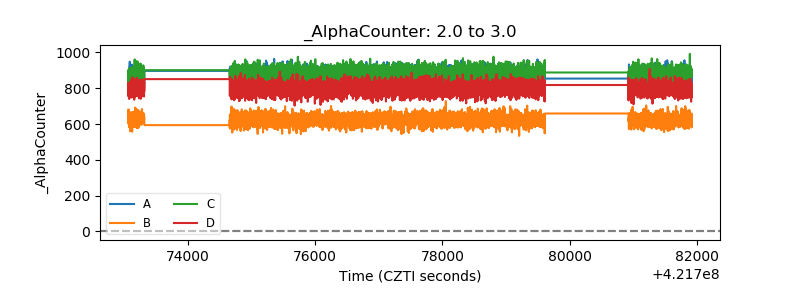 |
| _CPM_Rate | 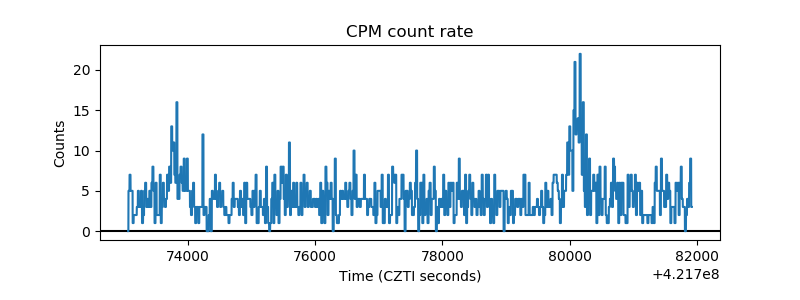 |
| CZT Counter | 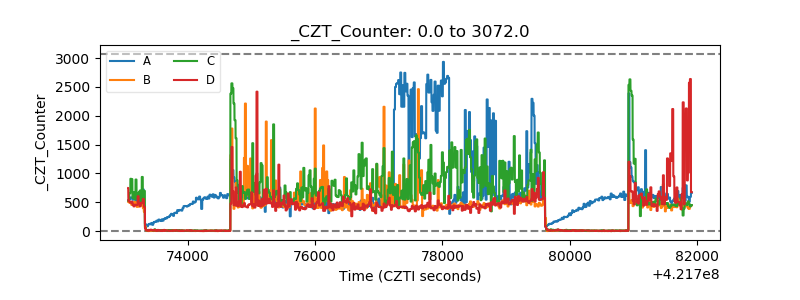 |
| +2.5 Volts monitor |  |
| +5 Volts monitor |  |
| _ROLL_ROT | 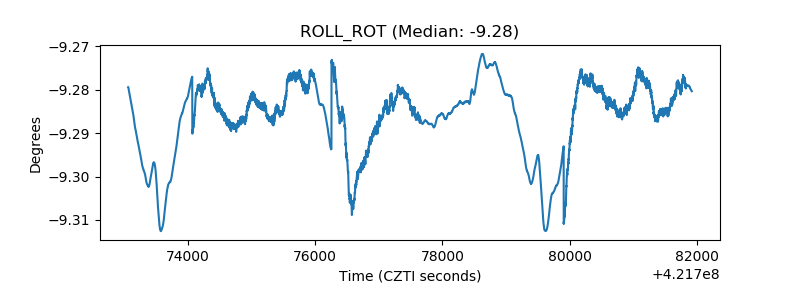 |
| _Roll_DEC | 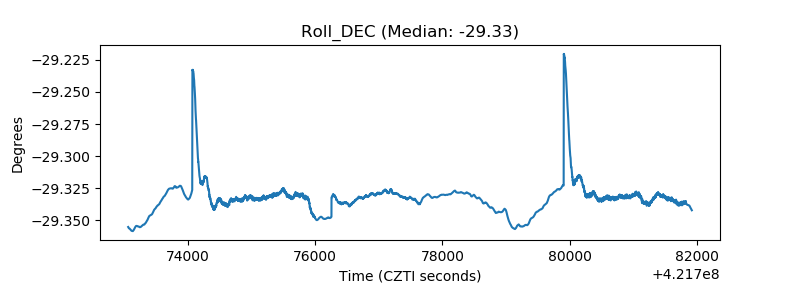 |
| _Roll_RA | 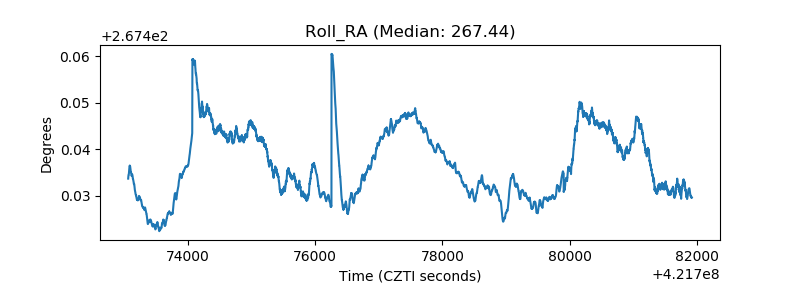 |
| Veto Counter | 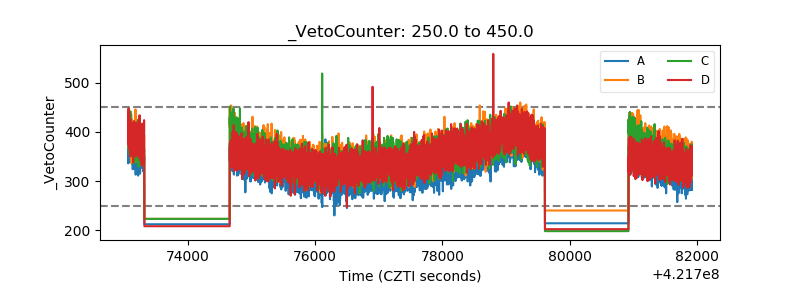 |