| Param | Original file | Final file |
|---|---|---|
| Filename | modeM0/AS1T05_102T01_9000005634_41240cztM0_level2.fits | modeM0/AS1T05_102T01_9000005634_41240cztM0_level2_quad_clean.evt |
| Size (bytes) | 364,464,000 | 96,609,600 |
| Size | 347.6 MB | 92.1 MB |
| Events in quadrant A | 3,368,846 | 652,278 |
| Events in quadrant B | 2,775,868 | 671,142 |
| Events in quadrant C | 3,502,900 | 629,394 |
| Events in quadrant D | 3,397,741 | 572,151 |
| Mode M9 | |||
|---|---|---|---|
| Quadrant | BADHDUFLAG | Total packets | Discarded packets |
| A | 0 | 35 | 0 |
| B | 0 | 35 | 0 |
| C | 0 | 35 | 0 |
| D | 0 | 35 | 0 |
| Mode M0 | |||
|---|---|---|---|
| Quadrant | BADHDUFLAG | Total packets | Discarded packets |
| A | 0 | 13468 | 3 |
| B | 0 | 12200 | 2 |
| C | 0 | 13974 | 2 |
| D | 0 | 14079 | 2 |
| Mode SS | |||
|---|---|---|---|
| Quadrant | BADHDUFLAG | Total packets | Discarded packets |
| A | 0 | 118 | 0 |
| B | 0 | 118 | 0 |
| C | 0 | 118 | 0 |
| D | 0 | 118 | 0 |
| Quadrant | Total seconds | Saturated seconds | Saturation percentage |
|---|---|---|---|
| A | 5729 | 20 | 0.349101% |
| B | 5729 | 26 | 0.453831% |
| C | 5729 | 160 | 2.792809% |
| D | 5729 | 244 | 4.259033% |
Noise dominated data is calculated using 1-second bins in cleaned event files. If a bin has >2000 counts, and if more than 50% of those come from <1% of pixels, then it is considered to be noise-dominated and hence unusable.
| Quadrant | # 1 sec bins | Bins with >0 counts | Bins with >2000 counts | High rate bins dominated by noise | Noise dominated (total time) | Noise dominated (detector-on time) | Marked lightcurve |
|---|---|---|---|---|---|---|---|
| A | 9195 | 5731 | 11 | 11 | 0.12% | 0.19% | 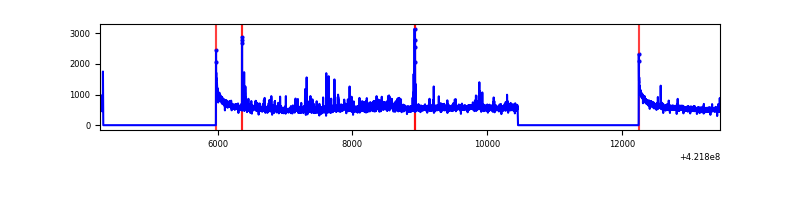 |
| B | 9195 | 5731 | 7 | 7 | 0.08% | 0.12% | 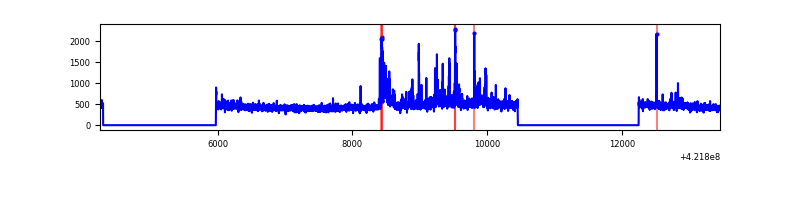 |
| C | 9195 | 5731 | 158 | 158 | 1.72% | 2.76% | 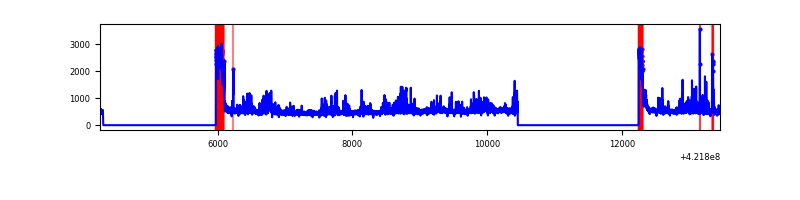 |
| D | 9195 | 5731 | 140 | 140 | 1.52% | 2.44% | 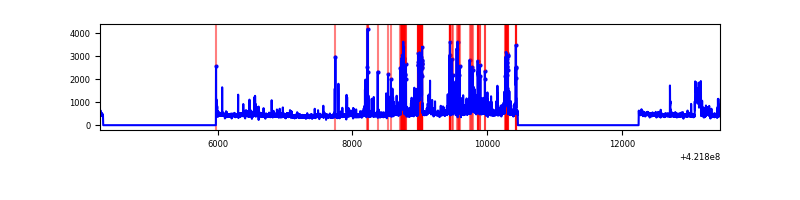 |
Top three noisy pixels from each quadrant. If the there are fewer than three noisy pixels in the level2.evt file, extra rows are filled as -1
| Pixel properties | Quadrant properties | ||||||
|---|---|---|---|---|---|---|---|
| Quadrant | DetID | PixID | Counts | Sigma | Mean | Median | Sigma |
| A | 10 | 83 | 551658 | 4203.48 | 642 | 628 | 131.1 |
| A | 0 | 8 | 180838 | 1374.72 | 642 | 628 | 131.1 |
| A | 12 | 189 | 59273 | 447.37 | 642 | 628 | 131.1 |
| B | 0 | 229 | 122631 | 988.17 | 637 | 619 | 123.5 |
| B | 0 | 186 | 82553 | 663.58 | 637 | 619 | 123.5 |
| B | 0 | 245 | 39116 | 311.79 | 637 | 619 | 123.5 |
| C | 0 | 10 | 414851 | 2842.76 | 623 | 629 | 145.7 |
| C | 9 | 54 | 366277 | 2509.41 | 623 | 629 | 145.7 |
| C | 15 | 214 | 244559 | 1674.07 | 623 | 629 | 145.7 |
| D | 5 | 222 | 347995 | 2295.1 | 620 | 604 | 151.4 |
| D | 13 | 249 | 302933 | 1997.39 | 620 | 604 | 151.4 |
| D | 5 | 171 | 103809 | 681.84 | 620 | 604 | 151.4 |
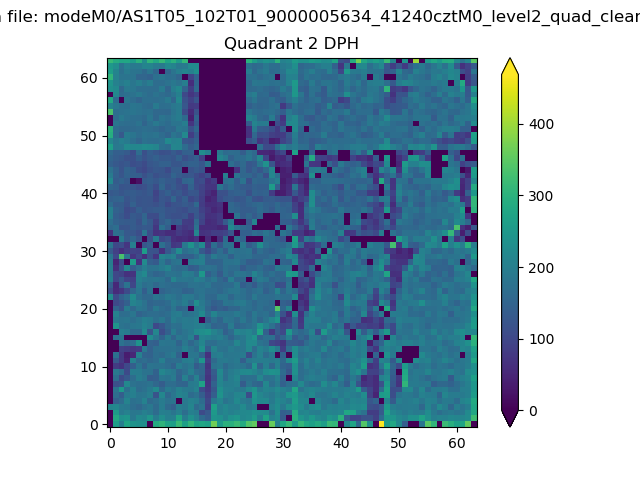
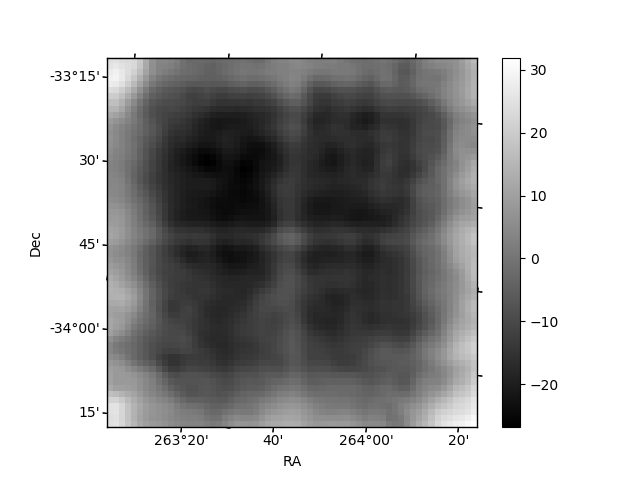
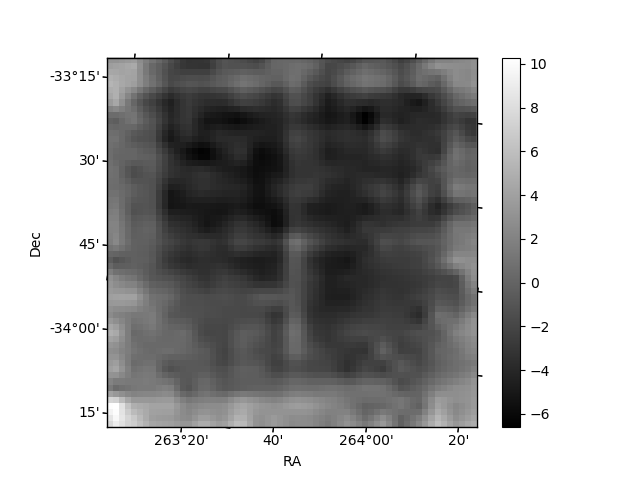
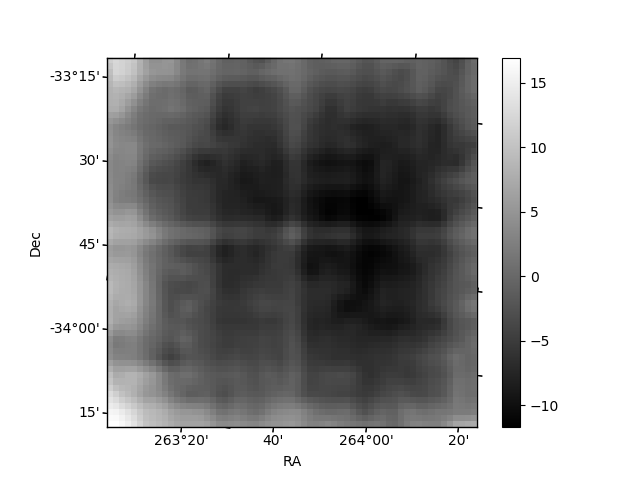
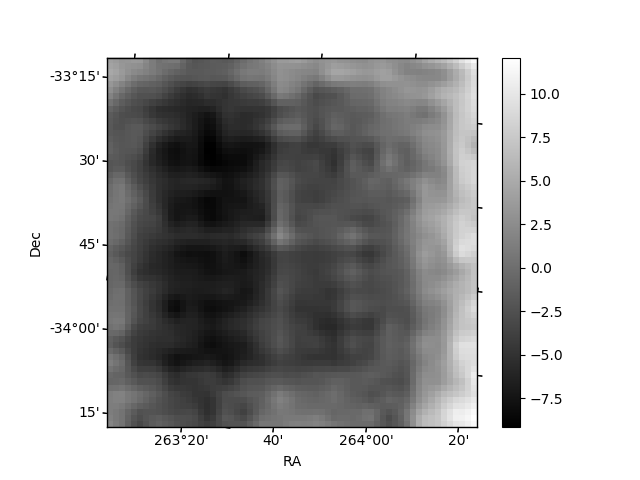
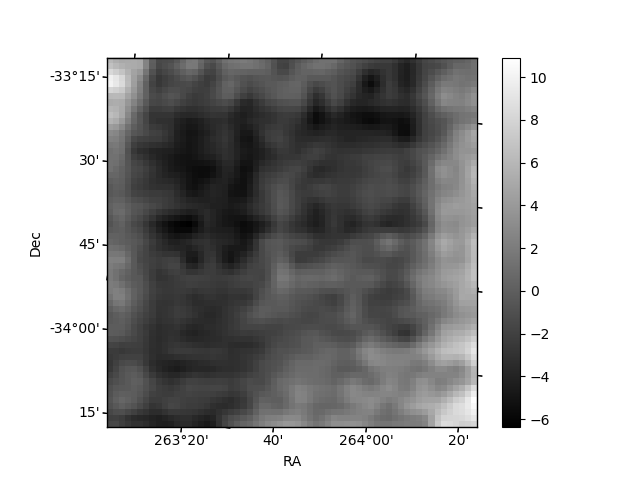
Histogram calculated using DETX and DETY for each event in the final _common_clean file
| Quadrant A | 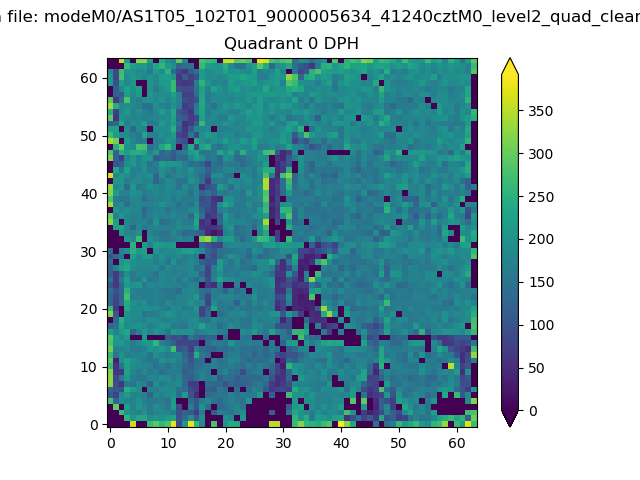 |
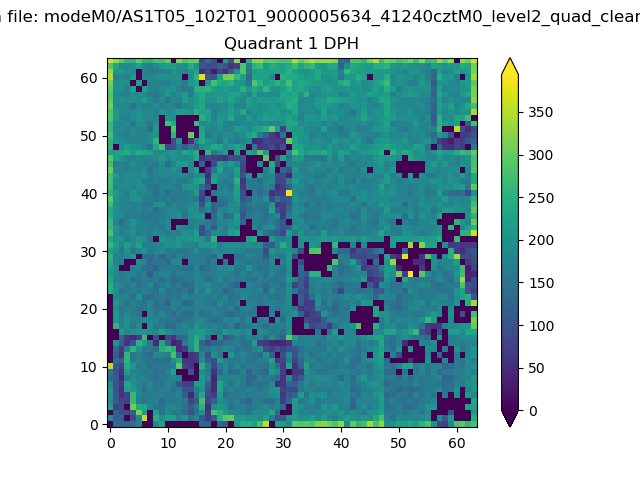 |
Quadrant B |
|---|---|---|---|
| Quadrant D | 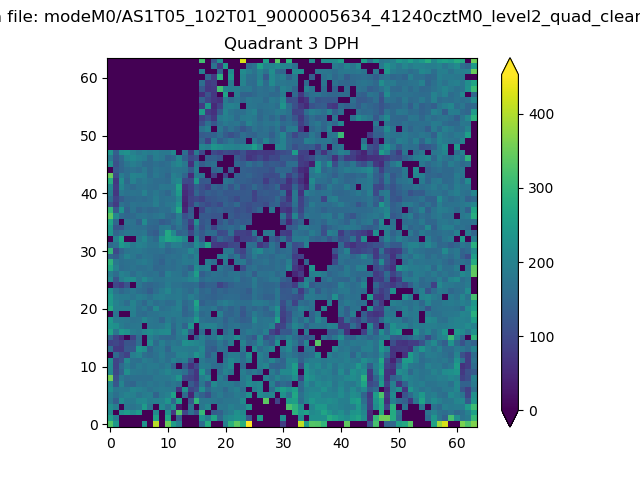 |
 |
Quadrant C |
| Plot type | Count rate plots | Images |
|---|---|---|
| Comparison with Poisson distribution Blue bars denote a histogram of data divided into 1 sec bins. Red curve is a Poisson curve with rate = median count rate of data. |
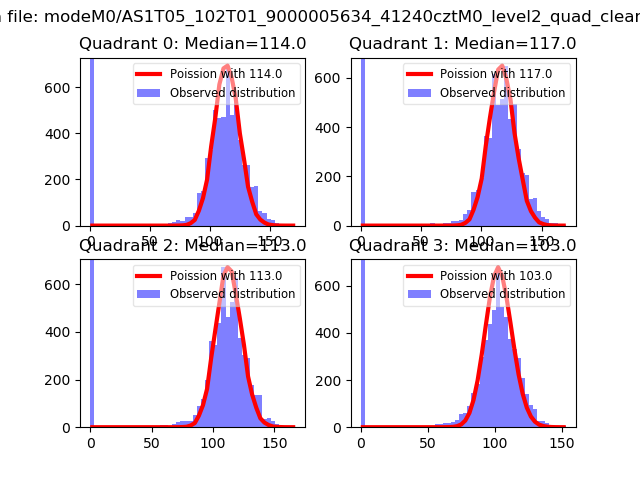 |
 |
| Quadrant-wise count rates Data is divided into 100 sec bins |
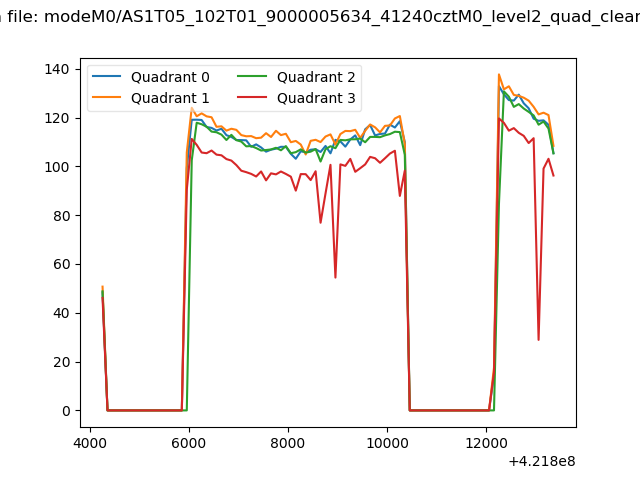 |
|
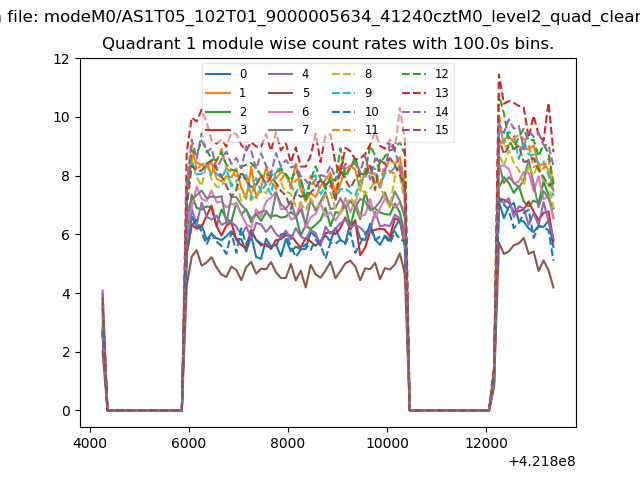
| Module-wise count rates for Quadrant A Data is divided into 100 sec bins |
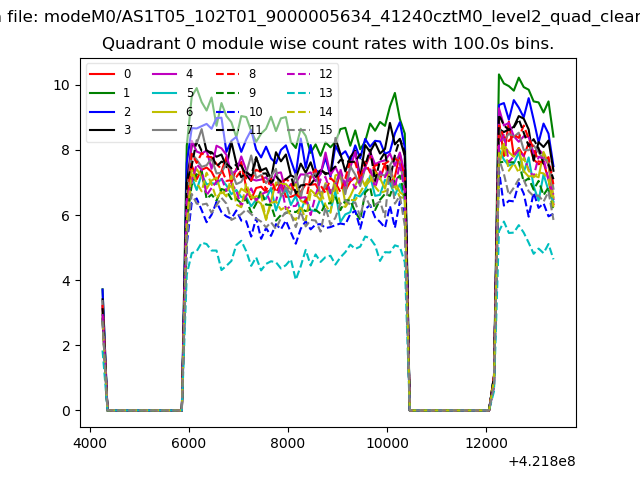 |
 |
| Module-wise count rates for Quadrant B Data is divided into 100 sec bins |
 |
 |
| Module-wise count rates for Quadrant C Data is divided into 100 sec bins |
 |
 |
| Module-wise count rates for Quadrant D Data is divided into 100 sec bins |
 |
 |
| Parameter | Plot |
|---|---|
| CZT HV Monitor | 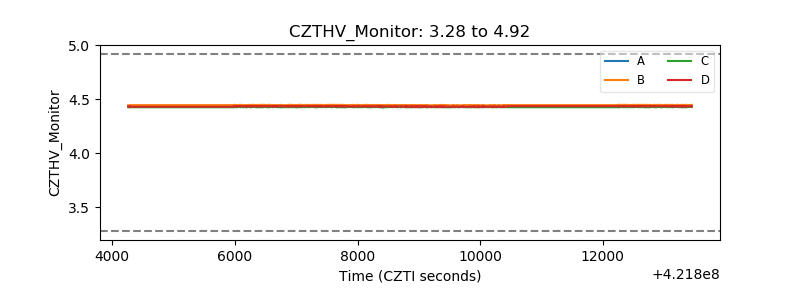 |
| D_VDD | 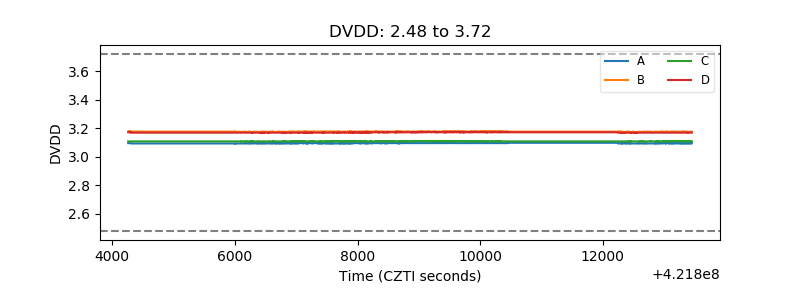 |
| Temperature 1 | 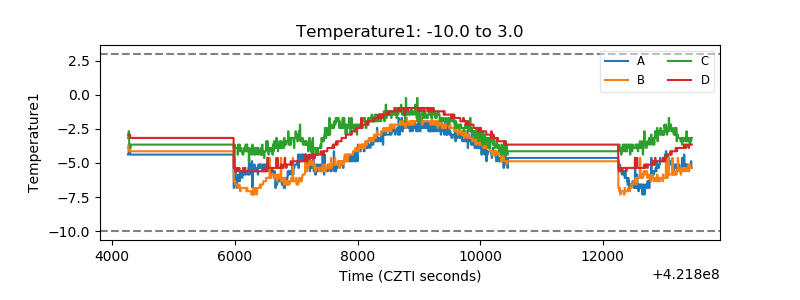 |
| Veto HV Monitor | 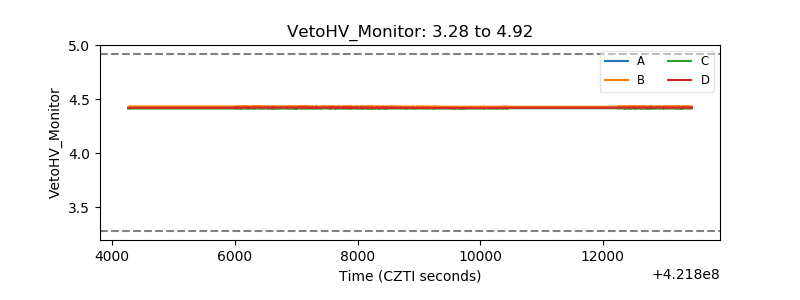 |
| Veto LLD | 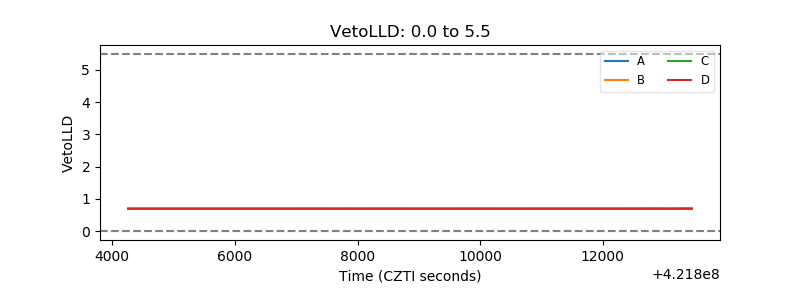 |
| Alpha Counter | 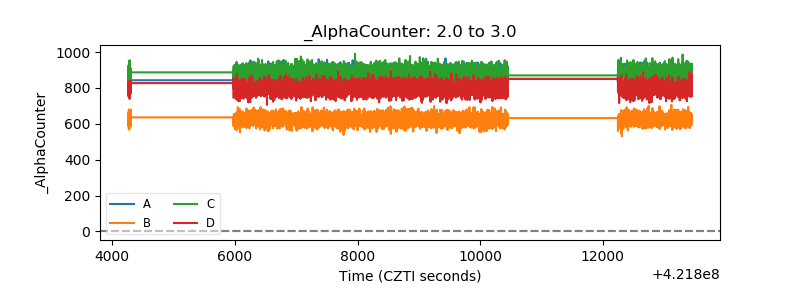 |
| _CPM_Rate | 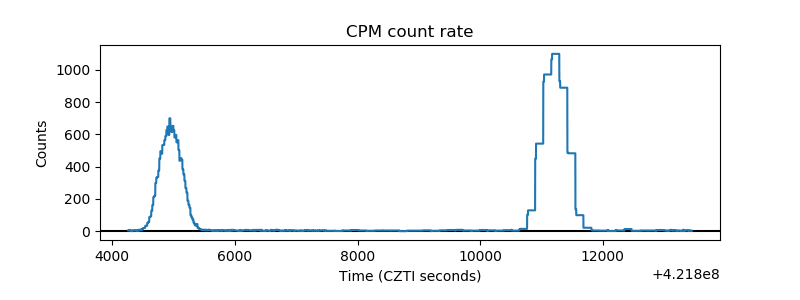 |
| CZT Counter | 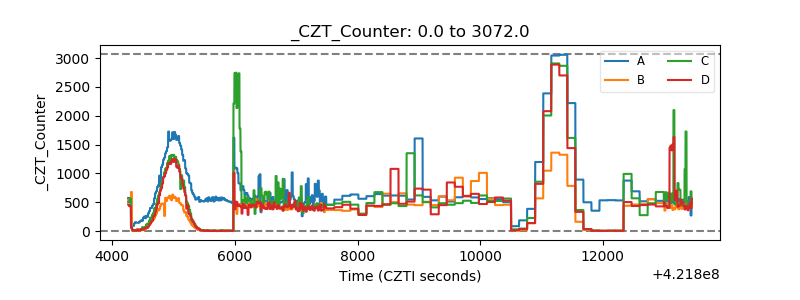 |
| +2.5 Volts monitor | 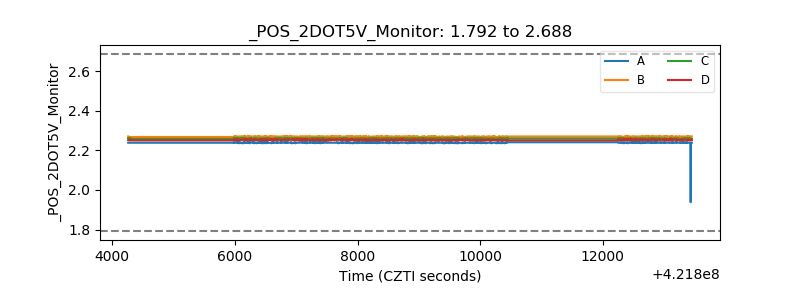 |
| +5 Volts monitor |  |
| _ROLL_ROT | 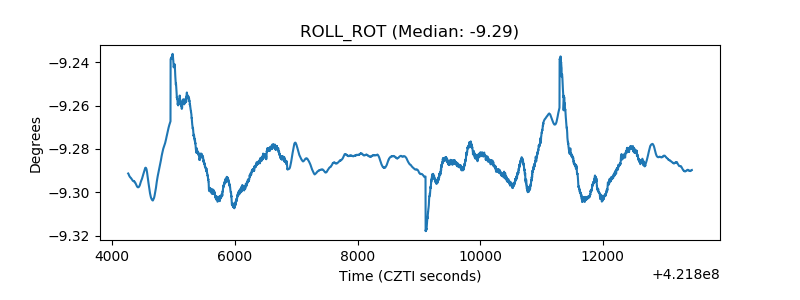 |
| _Roll_DEC | 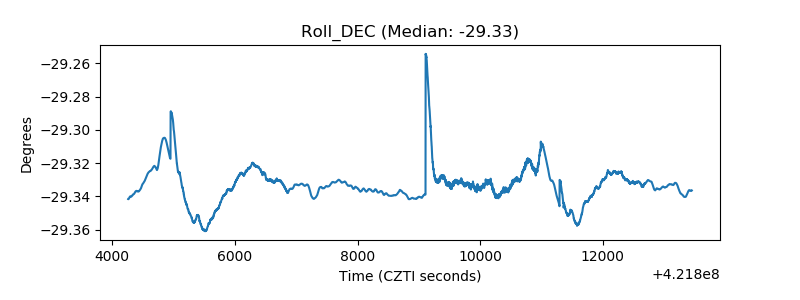 |
| _Roll_RA | 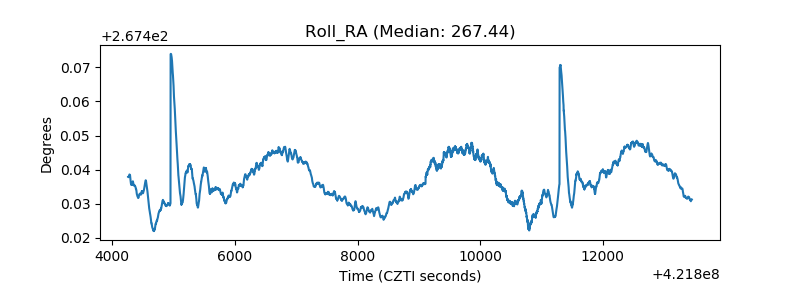 |
| Veto Counter | 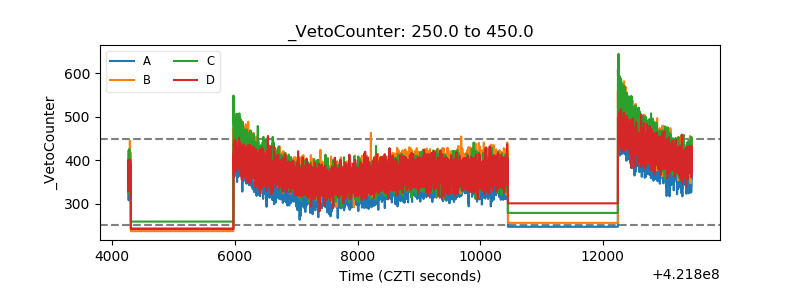 |