| Param | Original file | Final file |
|---|---|---|
| Filename | modeM0/AS1T05_102T01_9000005634_41241cztM0_level2.fits | modeM0/AS1T05_102T01_9000005634_41241cztM0_level2_quad_clean.evt |
| Size (bytes) | 328,017,600 | 89,942,400 |
| Size | 312.8 MB | 85.8 MB |
| Events in quadrant A | 2,863,115 | 611,062 |
| Events in quadrant B | 2,685,901 | 624,879 |
| Events in quadrant C | 2,959,815 | 595,931 |
| Events in quadrant D | 3,234,219 | 532,831 |
| Mode M9 | |||
|---|---|---|---|
| Quadrant | BADHDUFLAG | Total packets | Discarded packets |
| A | 0 | 20 | 0 |
| B | 0 | 20 | 0 |
| C | 0 | 20 | 0 |
| D | 0 | 20 | 0 |
| Mode M0 | |||
|---|---|---|---|
| Quadrant | BADHDUFLAG | Total packets | Discarded packets |
| A | 0 | 11461 | 2 |
| B | 0 | 11351 | 1 |
| C | 0 | 11828 | 1 |
| D | 0 | 12986 | 1 |
| Mode SS | |||
|---|---|---|---|
| Quadrant | BADHDUFLAG | Total packets | Discarded packets |
| A | 0 | 104 | 0 |
| B | 0 | 104 | 0 |
| C | 0 | 104 | 0 |
| D | 0 | 104 | 0 |
| Quadrant | Total seconds | Saturated seconds | Saturation percentage |
|---|---|---|---|
| A | 5122 | 9 | 0.175713% |
| B | 5122 | 60 | 1.171417% |
| C | 5122 | 77 | 1.503319% |
| D | 5122 | 259 | 5.056619% |
Noise dominated data is calculated using 1-second bins in cleaned event files. If a bin has >2000 counts, and if more than 50% of those come from <1% of pixels, then it is considered to be noise-dominated and hence unusable.
| Quadrant | # 1 sec bins | Bins with >0 counts | Bins with >2000 counts | High rate bins dominated by noise | Noise dominated (total time) | Noise dominated (detector-on time) | Marked lightcurve |
|---|---|---|---|---|---|---|---|
| A | 7065 | 5123 | 3 | 3 | 0.04% | 0.06% | 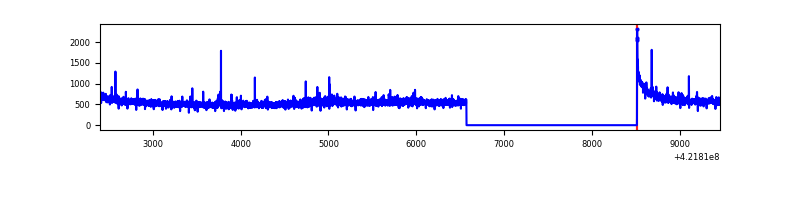 |
| B | 7065 | 5123 | 46 | 46 | 0.65% | 0.90% | 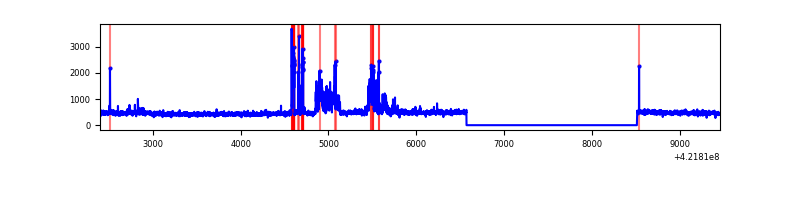 |
| C | 7065 | 5123 | 73 | 73 | 1.03% | 1.42% | 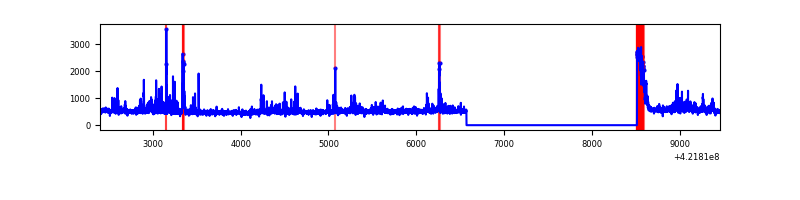 |
| D | 7065 | 5123 | 143 | 143 | 2.02% | 2.79% | 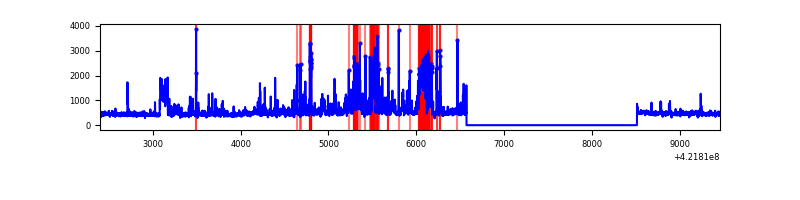 |
Top three noisy pixels from each quadrant. If the there are fewer than three noisy pixels in the level2.evt file, extra rows are filled as -1
| Pixel properties | Quadrant properties | ||||||
|---|---|---|---|---|---|---|---|
| Quadrant | DetID | PixID | Counts | Sigma | Mean | Median | Sigma |
| A | 10 | 83 | 450322 | 3695.83 | 595 | 583 | 121.7 |
| A | 0 | 8 | 73803 | 601.7 | 595 | 583 | 121.7 |
| A | 2 | 79 | 20034 | 159.84 | 595 | 583 | 121.7 |
| B | 0 | 186 | 233427 | 2047.84 | 585 | 568 | 113.7 |
| B | 0 | 245 | 120192 | 1052.01 | 585 | 568 | 113.7 |
| B | 12 | 111 | 13842 | 116.74 | 585 | 568 | 113.7 |
| C | 9 | 54 | 233695 | 1714.99 | 581 | 584 | 135.9 |
| C | 15 | 214 | 218925 | 1606.33 | 581 | 584 | 135.9 |
| C | 0 | 10 | 182296 | 1336.85 | 581 | 584 | 135.9 |
| D | 13 | 249 | 525809 | 3695.1 | 575 | 560 | 142.1 |
| D | 5 | 222 | 160979 | 1128.54 | 575 | 560 | 142.1 |
| D | 2 | 249 | 139484 | 977.32 | 575 | 560 | 142.1 |
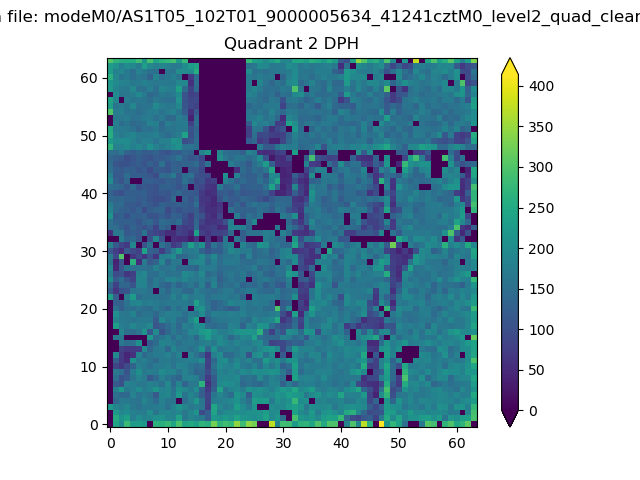
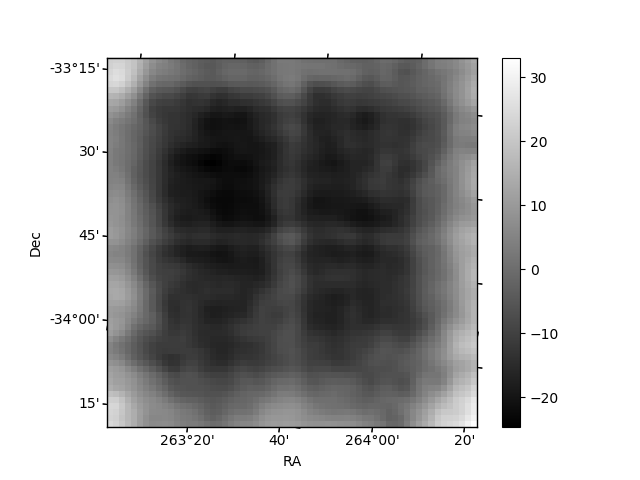
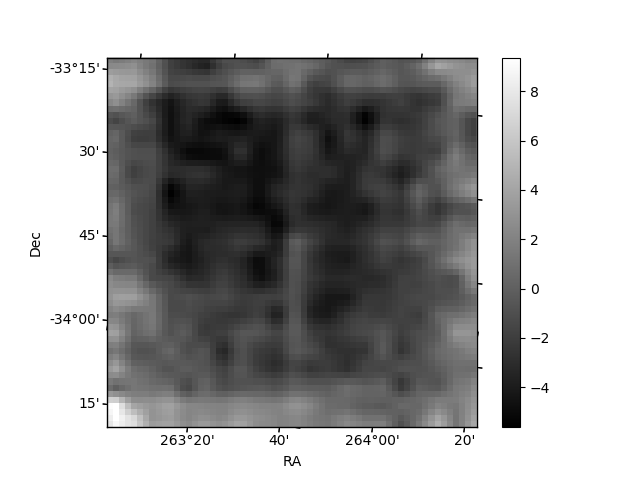
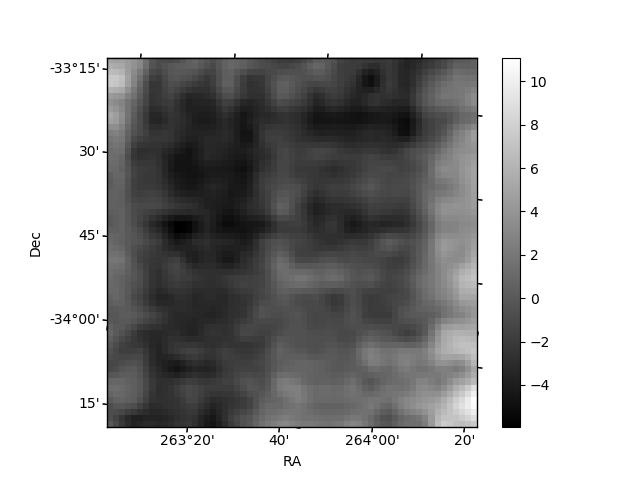
Histogram calculated using DETX and DETY for each event in the final _common_clean file
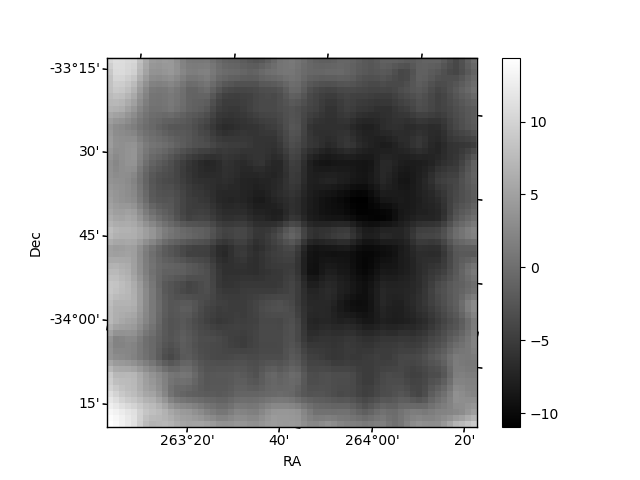
| Quadrant A | 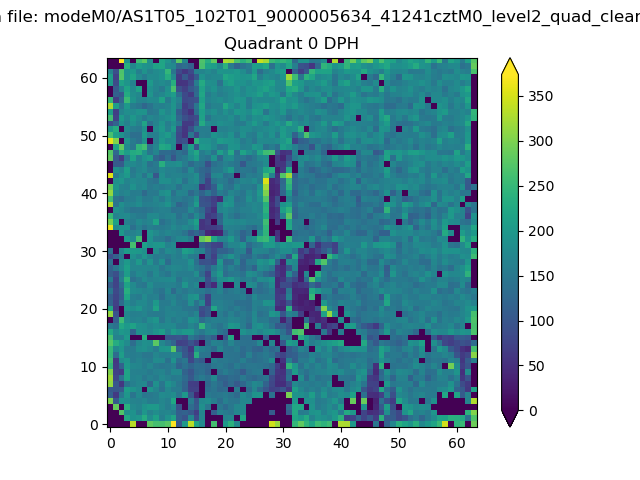 |
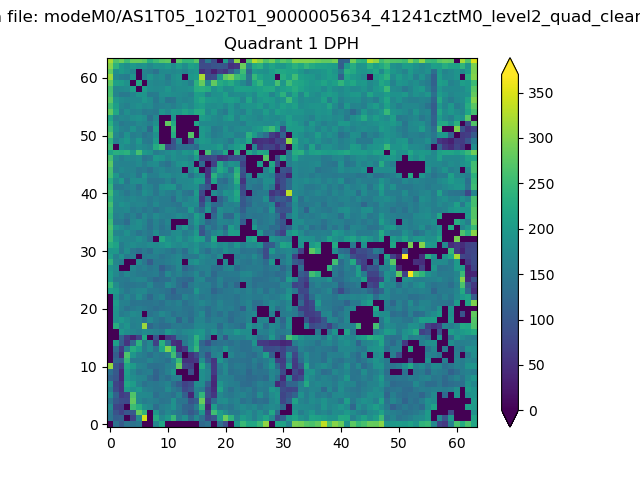 |
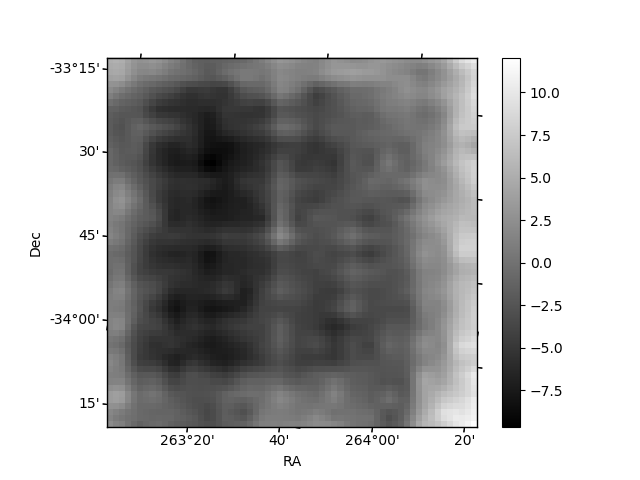
Quadrant B |
|---|---|---|---|
| Quadrant D | 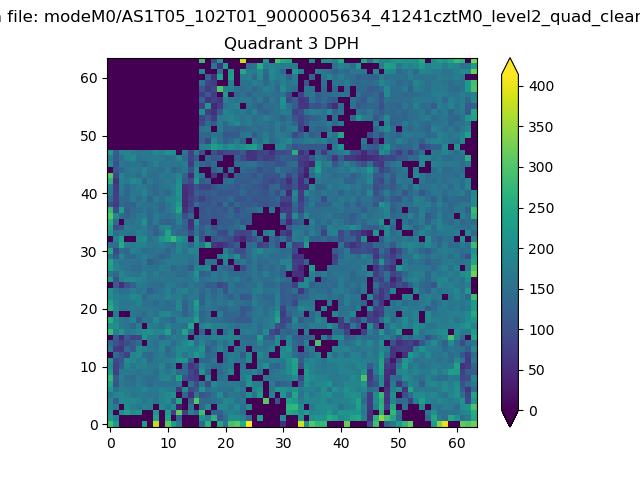 |
 |
Quadrant C |
| Plot type | Count rate plots | Images |
|---|---|---|
| Comparison with Poisson distribution Blue bars denote a histogram of data divided into 1 sec bins. Red curve is a Poisson curve with rate = median count rate of data. |
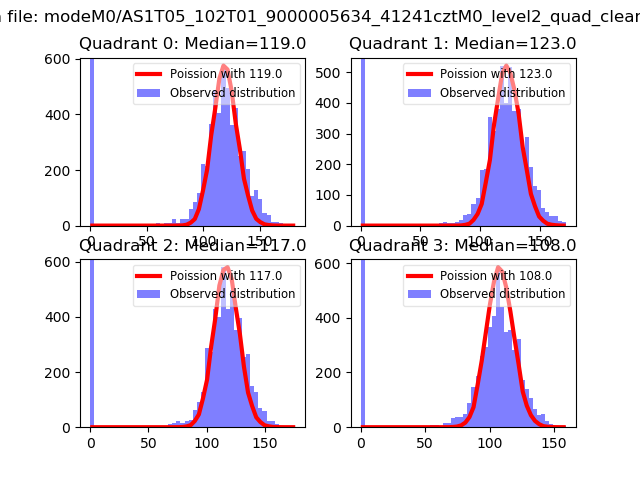 |
 |
| Quadrant-wise count rates Data is divided into 100 sec bins |
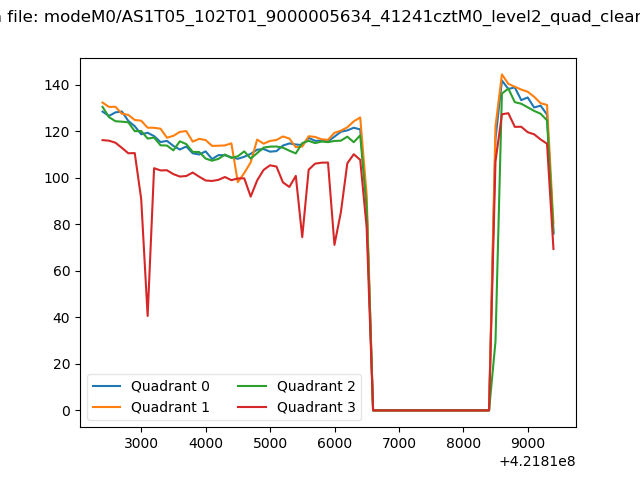 |
|
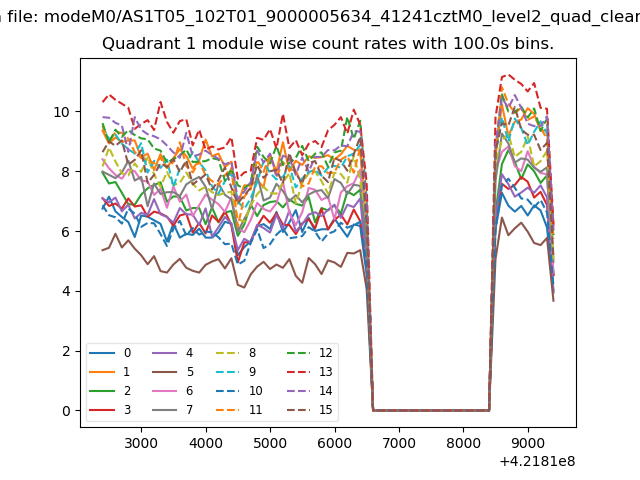
| Module-wise count rates for Quadrant A Data is divided into 100 sec bins |
 |
 |
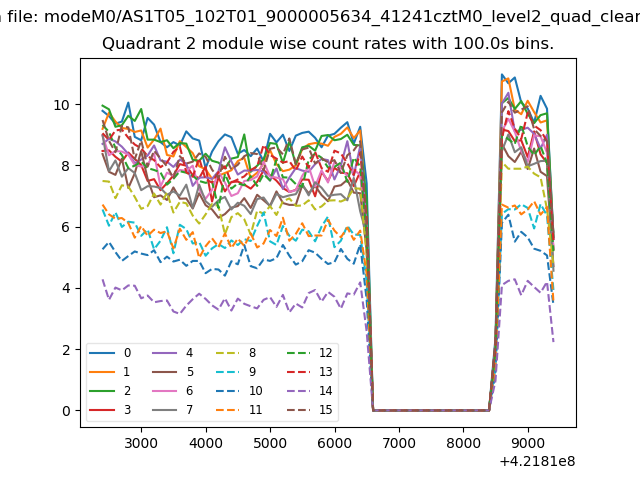
| Module-wise count rates for Quadrant B Data is divided into 100 sec bins |
 |
 |
| Module-wise count rates for Quadrant C Data is divided into 100 sec bins |
 |
 |
| Module-wise count rates for Quadrant D Data is divided into 100 sec bins |
 |
 |
| Parameter | Plot |
|---|---|
| CZT HV Monitor | 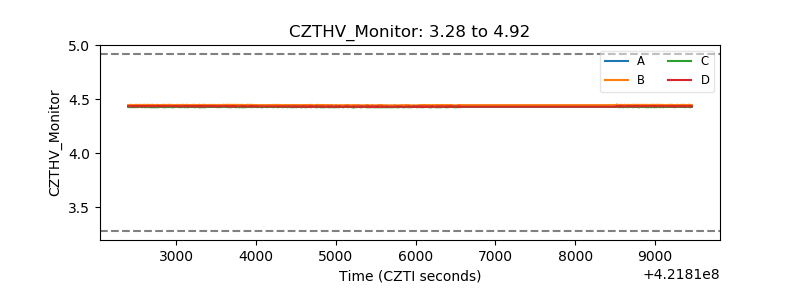 |
| D_VDD | 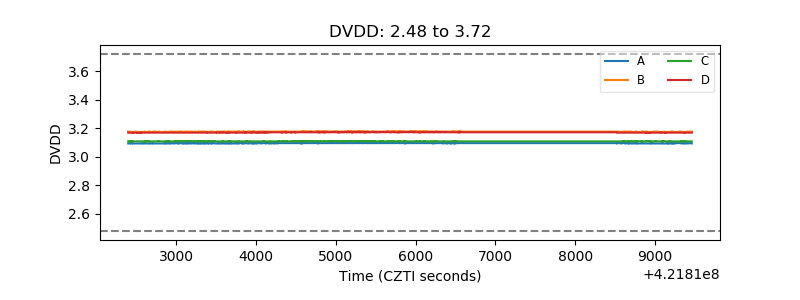 |
| Temperature 1 | 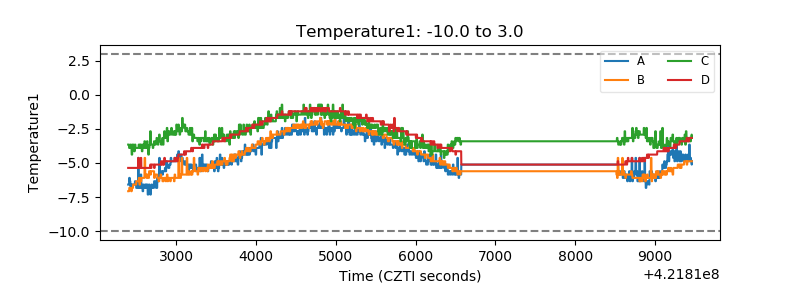 |
| Veto HV Monitor |  |
| Veto LLD | 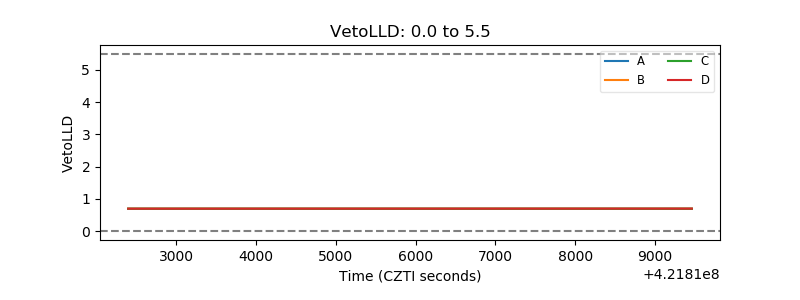 |
| Alpha Counter | 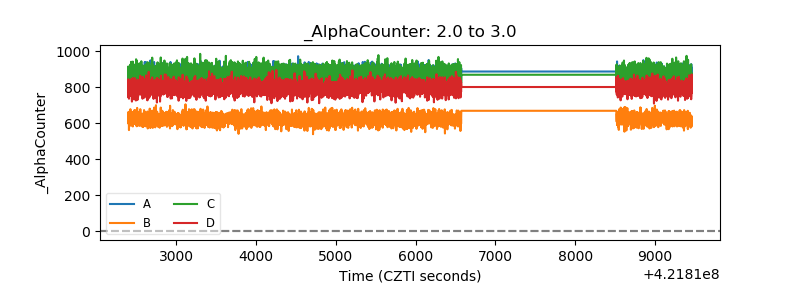 |
| _CPM_Rate | 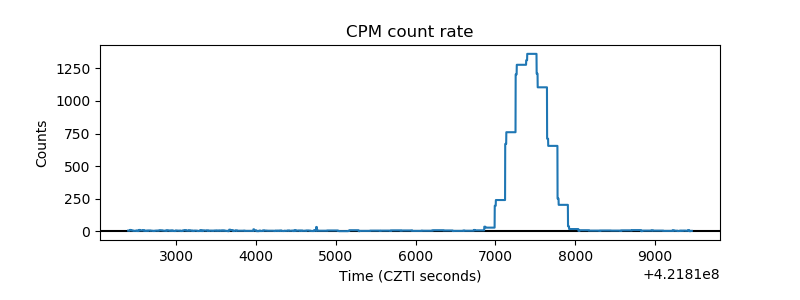 |
| CZT Counter | 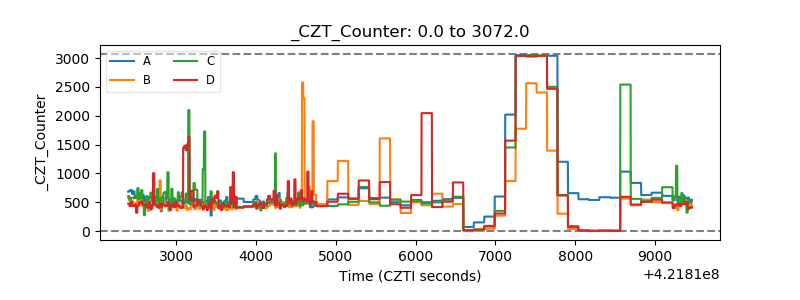 |
| +2.5 Volts monitor |  |
| +5 Volts monitor | 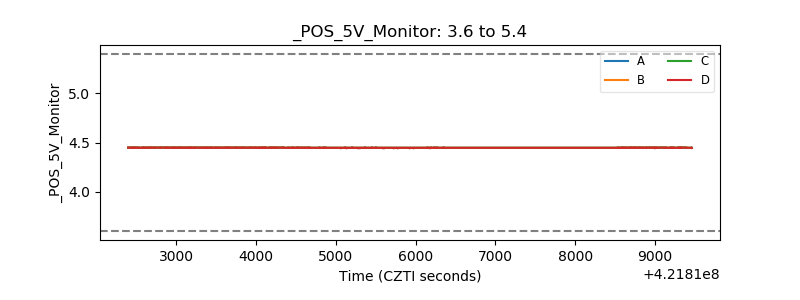 |
| _ROLL_ROT | 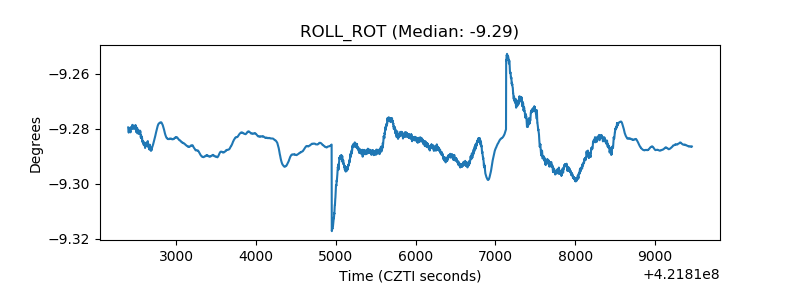 |
| _Roll_DEC | 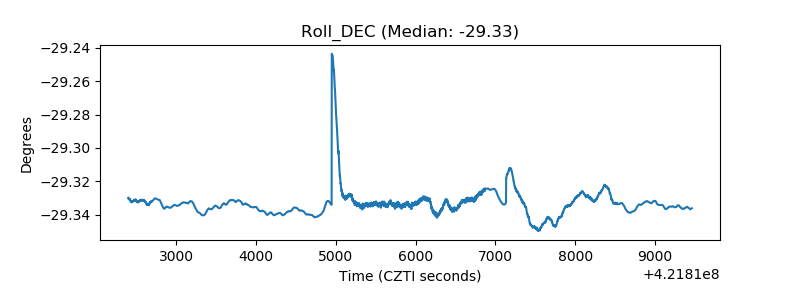 |
| _Roll_RA | 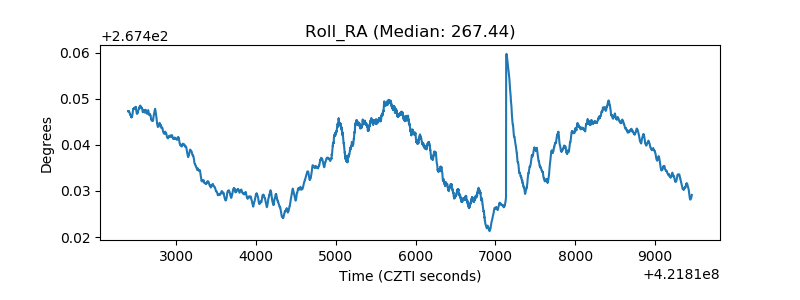 |
| Veto Counter | 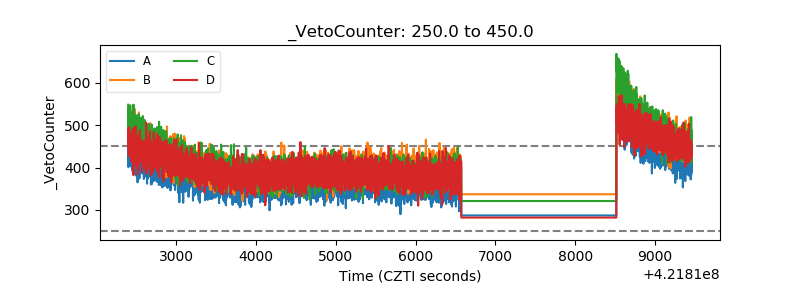 |