| Param | Original file | Final file |
|---|---|---|
| Filename | modeM0/AS1T05_102T01_9000005634_41242cztM0_level2.fits | modeM0/AS1T05_102T01_9000005634_41242cztM0_level2_quad_clean.evt |
| Size (bytes) | 360,711,360 | 89,870,400 |
| Size | 344.0 MB | 85.7 MB |
| Events in quadrant A | 3,250,469 | 619,811 |
| Events in quadrant B | 2,890,394 | 628,296 |
| Events in quadrant C | 3,136,467 | 595,164 |
| Events in quadrant D | 3,684,464 | 526,641 |
| Mode M9 | |||
|---|---|---|---|
| Quadrant | BADHDUFLAG | Total packets | Discarded packets |
| A | 0 | 31 | 0 |
| B | 0 | 31 | 0 |
| C | 0 | 31 | 0 |
| D | 0 | 32 | 0 |
| Mode M0 | |||
|---|---|---|---|
| Quadrant | BADHDUFLAG | Total packets | Discarded packets |
| A | 0 | 12603 | 3 |
| B | 0 | 11696 | 2 |
| C | 0 | 12238 | 2 |
| D | 0 | 14131 | 2 |
| Mode SS | |||
|---|---|---|---|
| Quadrant | BADHDUFLAG | Total packets | Discarded packets |
| A | 0 | 102 | 0 |
| B | 0 | 102 | 0 |
| C | 0 | 102 | 0 |
| D | 0 | 102 | 0 |
| Quadrant | Total seconds | Saturated seconds | Saturation percentage |
|---|---|---|---|
| A | 5015 | 64 | 1.276171% |
| B | 5015 | 178 | 3.549352% |
| C | 5015 | 171 | 3.409771% |
| D | 5015 | 404 | 8.055833% |
Noise dominated data is calculated using 1-second bins in cleaned event files. If a bin has >2000 counts, and if more than 50% of those come from <1% of pixels, then it is considered to be noise-dominated and hence unusable.
| Quadrant | # 1 sec bins | Bins with >0 counts | Bins with >2000 counts | High rate bins dominated by noise | Noise dominated (total time) | Noise dominated (detector-on time) | Marked lightcurve |
|---|---|---|---|---|---|---|---|
| A | 7078 | 5016 | 56 | 56 | 0.79% | 1.12% | 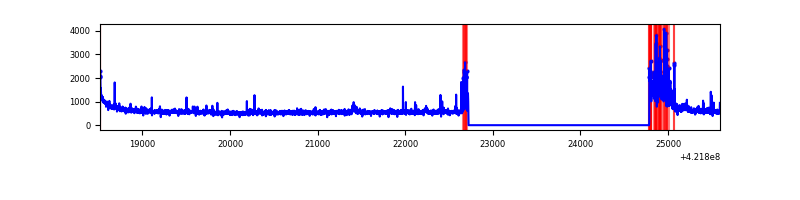 |
| B | 7078 | 5016 | 117 | 117 | 1.65% | 2.33% | 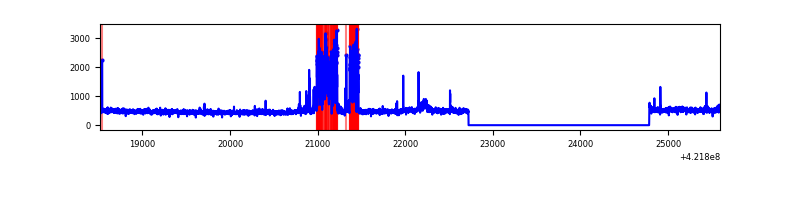 |
| C | 7078 | 5016 | 159 | 159 | 2.25% | 3.17% | 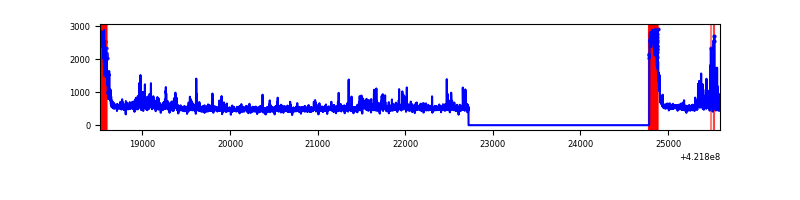 |
| D | 7078 | 5016 | 385 | 385 | 5.44% | 7.68% | 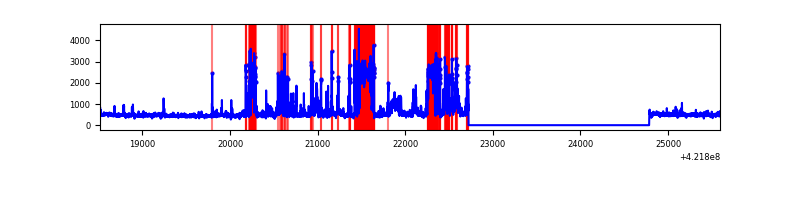 |
Top three noisy pixels from each quadrant. If the there are fewer than three noisy pixels in the level2.evt file, extra rows are filled as -1
| Pixel properties | Quadrant properties | ||||||
|---|---|---|---|---|---|---|---|
| Quadrant | DetID | PixID | Counts | Sigma | Mean | Median | Sigma |
| A | 10 | 83 | 495803 | 4031.53 | 601 | 589 | 122.8 |
| A | 0 | 8 | 276004 | 2242.15 | 601 | 589 | 122.8 |
| A | 7 | 3 | 102103 | 826.42 | 601 | 589 | 122.8 |
| B | 0 | 186 | 503351 | 4467.02 | 587 | 572 | 112.6 |
| B | 0 | 229 | 63013 | 554.77 | 587 | 572 | 112.6 |
| B | 12 | 111 | 13739 | 116.98 | 587 | 572 | 112.6 |
| C | 0 | 10 | 428326 | 3171.98 | 577 | 582 | 134.9 |
| C | 15 | 214 | 212838 | 1574.01 | 577 | 582 | 134.9 |
| C | 9 | 54 | 93359 | 688.0 | 577 | 582 | 134.9 |
| D | 13 | 249 | 804173 | 5844.73 | 563 | 547 | 137.5 |
| D | 2 | 249 | 534175 | 3881.05 | 563 | 547 | 137.5 |
| D | 5 | 222 | 79665 | 575.42 | 563 | 547 | 137.5 |
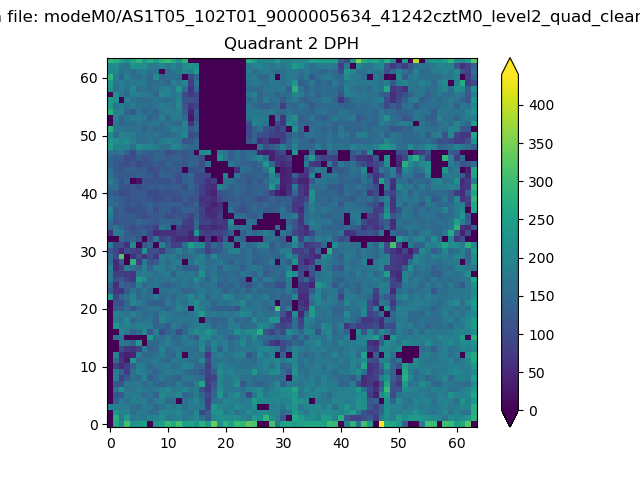
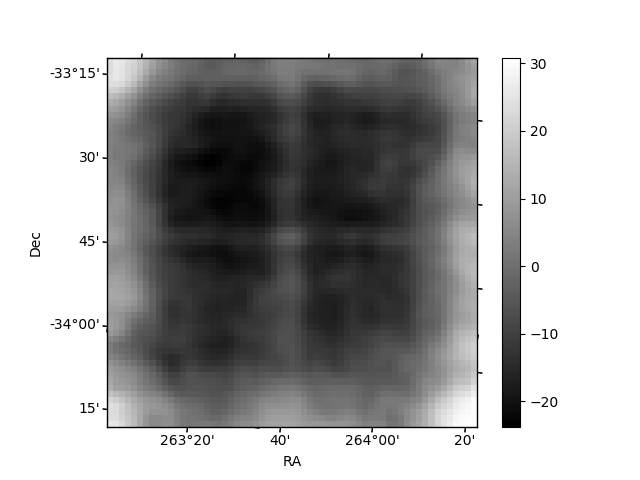
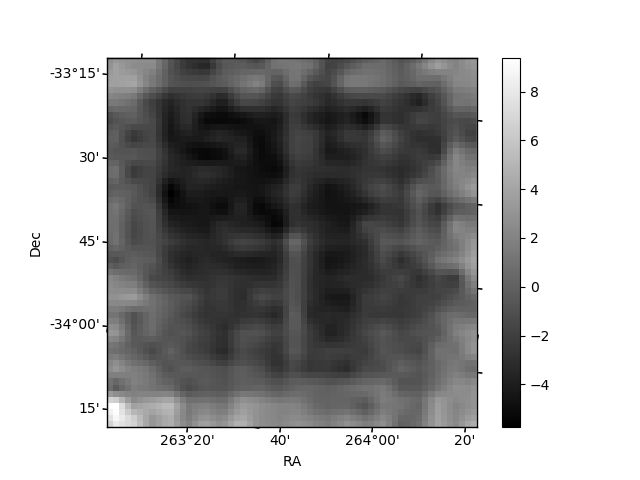
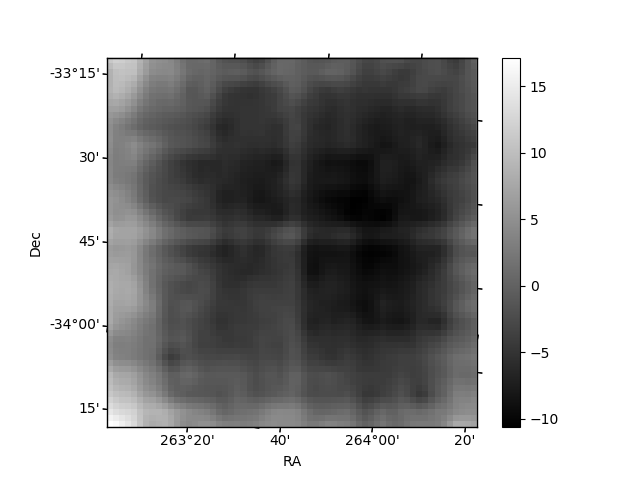
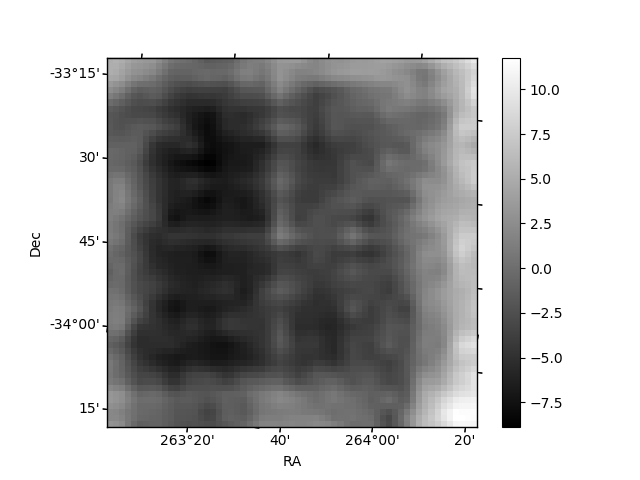
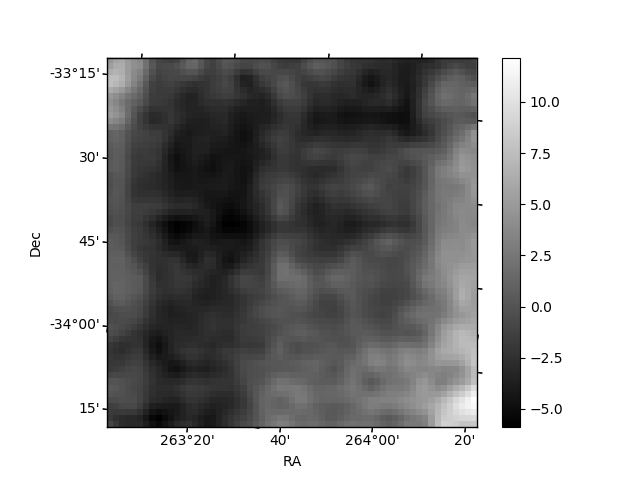
Histogram calculated using DETX and DETY for each event in the final _common_clean file
| Quadrant A | 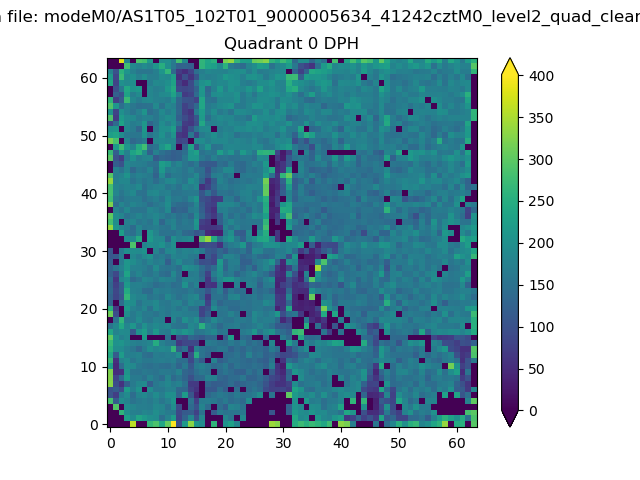 |
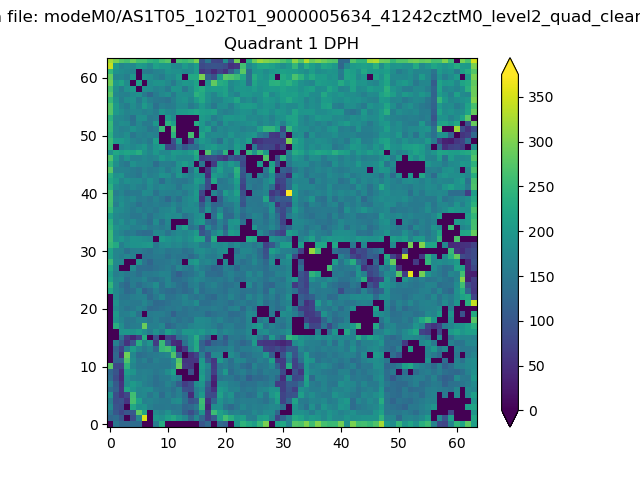 |
Quadrant B |
|---|---|---|---|
| Quadrant D | 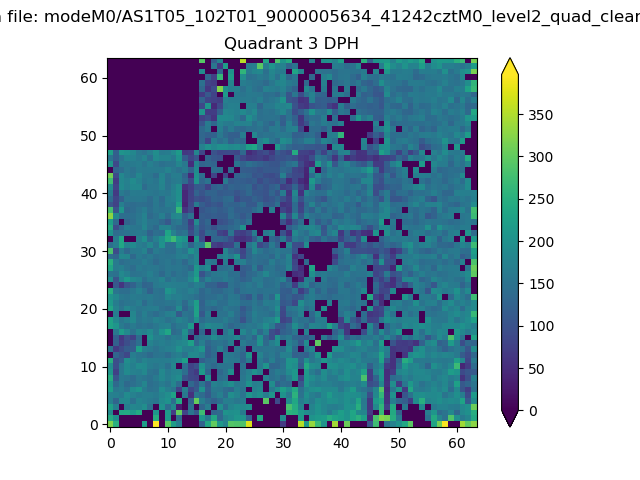 |
 |
Quadrant C |
| Plot type | Count rate plots | Images |
|---|---|---|
| Comparison with Poisson distribution Blue bars denote a histogram of data divided into 1 sec bins. Red curve is a Poisson curve with rate = median count rate of data. |
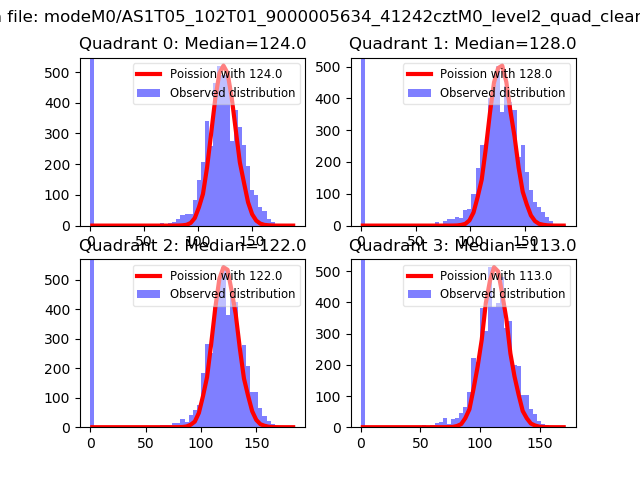 |
 |
| Quadrant-wise count rates Data is divided into 100 sec bins |
 |
|
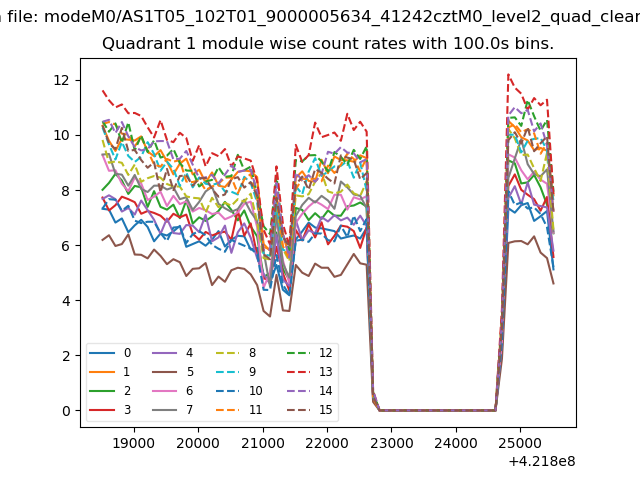
| Module-wise count rates for Quadrant A Data is divided into 100 sec bins |
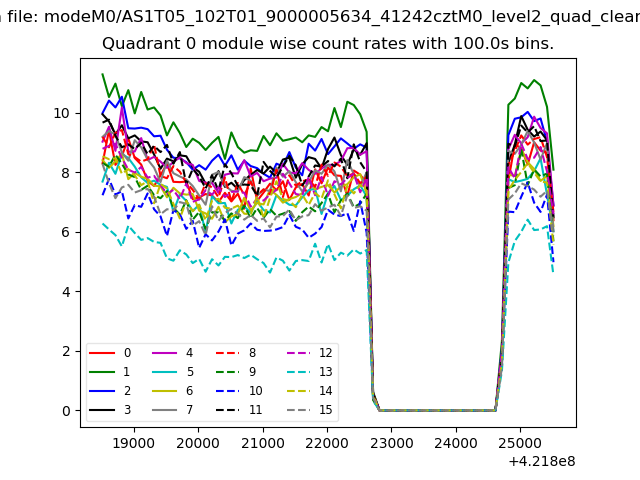 |
 |
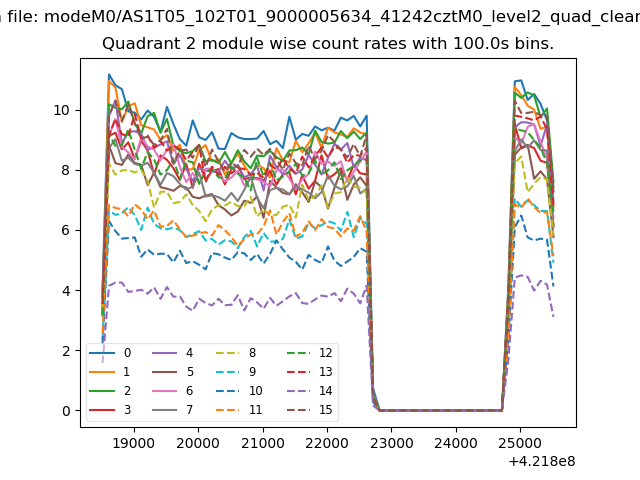
| Module-wise count rates for Quadrant B Data is divided into 100 sec bins |
 |
 |
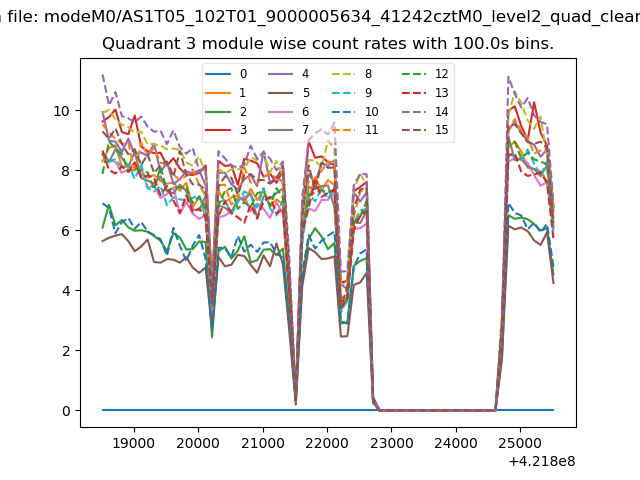
| Module-wise count rates for Quadrant C Data is divided into 100 sec bins |
 |
 |
| Module-wise count rates for Quadrant D Data is divided into 100 sec bins |
 |
 |
| Parameter | Plot |
|---|---|
| CZT HV Monitor | 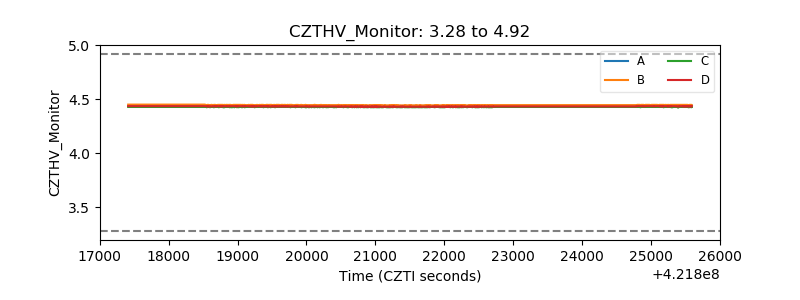 |
| D_VDD | 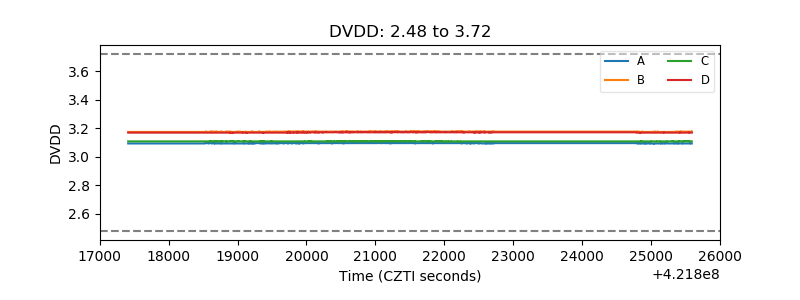 |
| Temperature 1 | 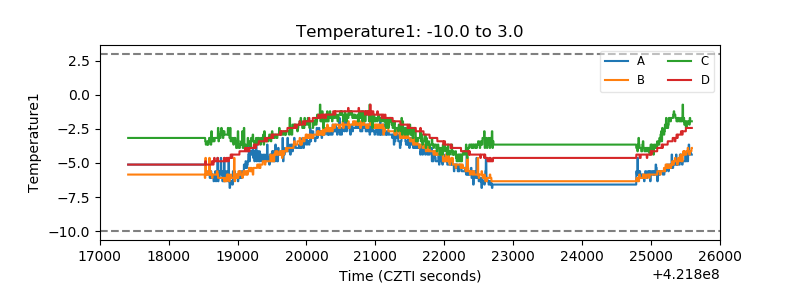 |
| Veto HV Monitor | 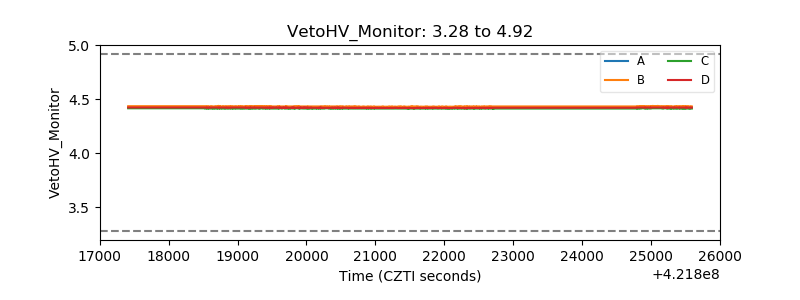 |
| Veto LLD | 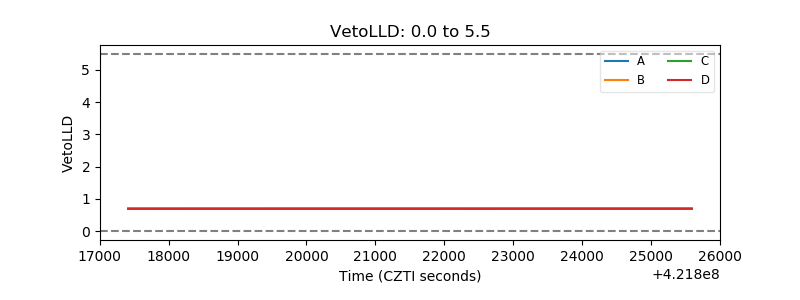 |
| Alpha Counter | 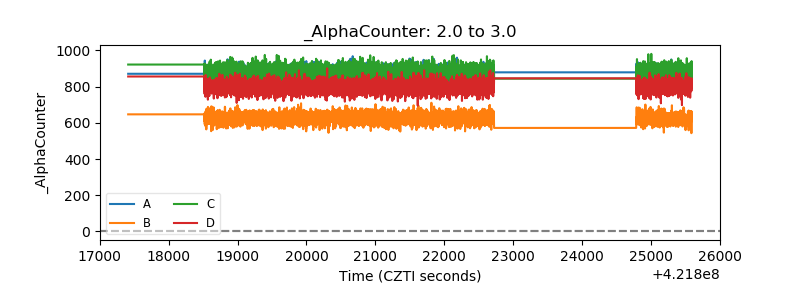 |
| _CPM_Rate | 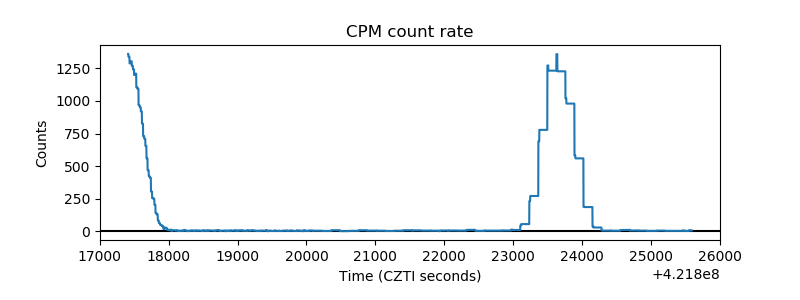 |
| CZT Counter | 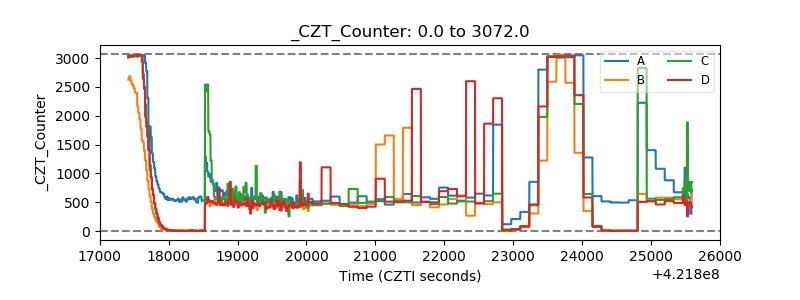 |
| +2.5 Volts monitor |  |
| +5 Volts monitor |  |
| _ROLL_ROT | 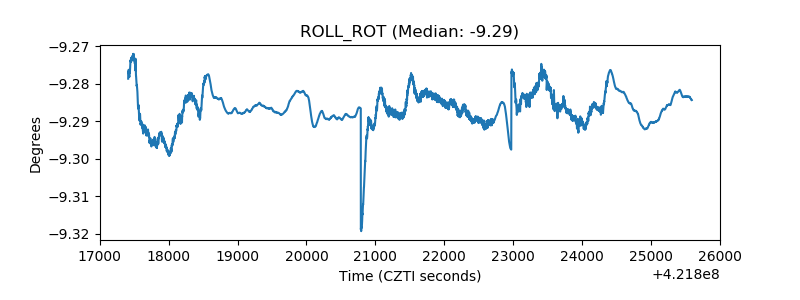 |
| _Roll_DEC | 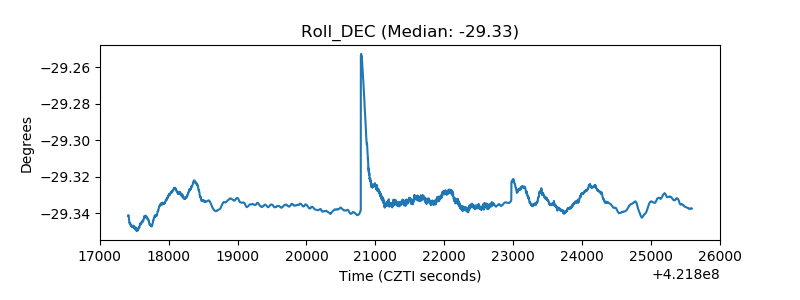 |
| _Roll_RA | 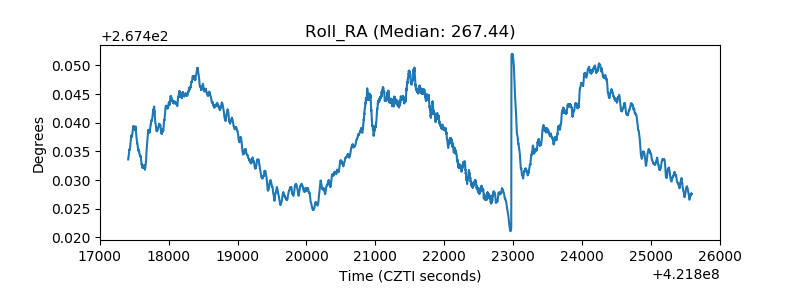 |
| Veto Counter | 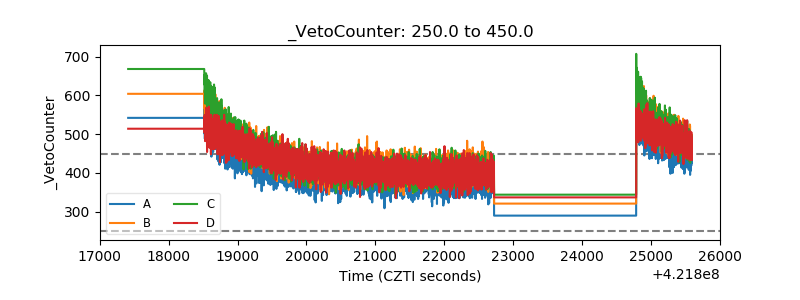 |