| Param | Original file | Final file |
|---|---|---|
| Filename | modeM0/AS1A12_044T17_9000005636_41243cztM0_level2.fits | modeM0/AS1A12_044T17_9000005636_41243cztM0_level2_quad_clean.evt |
| Size (bytes) | 55,739,520 | 15,168,960 |
| Size | 53.2 MB | 14.5 MB |
| Events in quadrant A | 552,630 | 102,023 |
| Events in quadrant B | 383,260 | 106,203 |
| Events in quadrant C | 664,866 | 94,680 |
| Events in quadrant D | 396,688 | 93,341 |
| Mode SS | |||
|---|---|---|---|
| Quadrant | BADHDUFLAG | Total packets | Discarded packets |
| A | 0 | 16 | 0 |
| B | 0 | 16 | 0 |
| C | 0 | 16 | 0 |
| D | 0 | 16 | 0 |
| Mode M0 | |||
|---|---|---|---|
| Quadrant | BADHDUFLAG | Total packets | Discarded packets |
| A | 0 | 2211 | 2 |
| B | 0 | 1627 | 1 |
| C | 0 | 2509 | 1 |
| D | 0 | 1701 | 1 |
| Mode M9 | |||
|---|---|---|---|
| Quadrant | BADHDUFLAG | Total packets | Discarded packets |
| A | 0 | 13 | 0 |
| B | 0 | 13 | 0 |
| C | 0 | 13 | 0 |
| D | 0 | 13 | 0 |
| Quadrant | Total seconds | Saturated seconds | Saturation percentage |
|---|---|---|---|
| A | 804 | 8 | 0.995025% |
| B | 804 | 1 | 0.124378% |
| C | 804 | 48 | 5.970149% |
| D | 804 | 2 | 0.248756% |
Noise dominated data is calculated using 1-second bins in cleaned event files. If a bin has >2000 counts, and if more than 50% of those come from <1% of pixels, then it is considered to be noise-dominated and hence unusable.
| Quadrant | # 1 sec bins | Bins with >0 counts | Bins with >2000 counts | High rate bins dominated by noise | Noise dominated (total time) | Noise dominated (detector-on time) | Marked lightcurve |
|---|---|---|---|---|---|---|---|
| A | 804 | 804 | 3 | 3 | 0.37% | 0.37% | 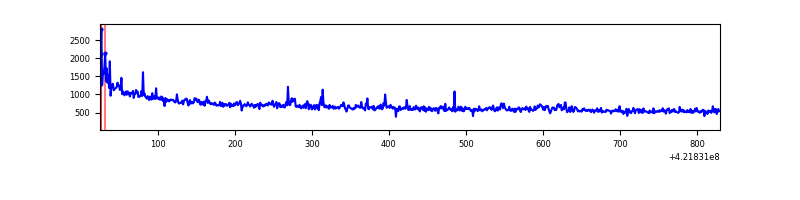 |
| B | 804 | 804 | 0 | 0 | 0.00% | 0.00% | 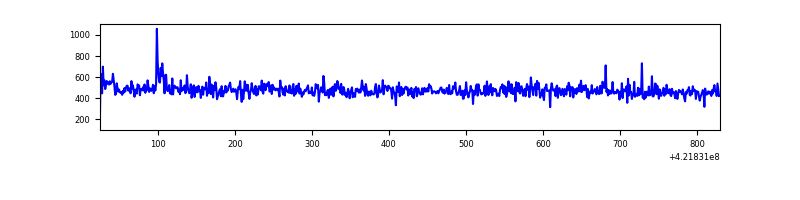 |
| C | 804 | 804 | 46 | 46 | 5.72% | 5.72% | 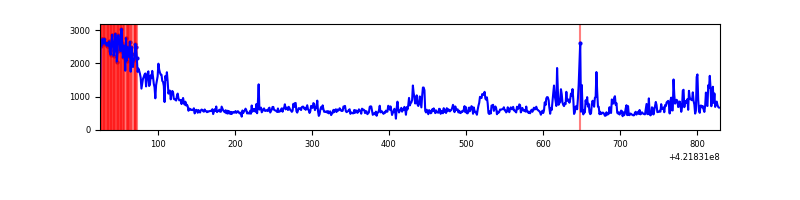 |
| D | 804 | 804 | 3 | 3 | 0.37% | 0.37% | 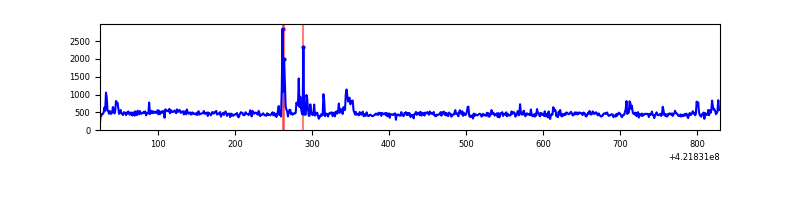 |
Top three noisy pixels from each quadrant. If the there are fewer than three noisy pixels in the level2.evt file, extra rows are filled as -1
| Pixel properties | Quadrant properties | ||||||
|---|---|---|---|---|---|---|---|
| Quadrant | DetID | PixID | Counts | Sigma | Mean | Median | Sigma |
| A | 10 | 83 | 141863 | 6506.66 | 97 | 95 | 21.8 |
| A | 0 | 8 | 18821 | 859.46 | 97 | 95 | 21.8 |
| A | 7 | 3 | 8024 | 363.91 | 97 | 95 | 21.8 |
| B | 5 | 255 | 3895 | 188.72 | 96 | 94 | 20.1 |
| B | 12 | 111 | 2290 | 109.03 | 96 | 94 | 20.1 |
| B | 11 | 111 | 2217 | 105.4 | 96 | 94 | 20.1 |
| C | 0 | 10 | 148845 | 6668.03 | 90 | 90 | 22.3 |
| C | 9 | 54 | 103160 | 4620.17 | 90 | 90 | 22.3 |
| C | 15 | 214 | 38657 | 1728.79 | 90 | 90 | 22.3 |
| D | 2 | 249 | 28960 | 1191.64 | 93 | 90 | 24.2 |
| D | 3 | 238 | 4263 | 172.24 | 93 | 90 | 24.2 |
| D | 12 | 16 | 2777 | 110.91 | 93 | 90 | 24.2 |
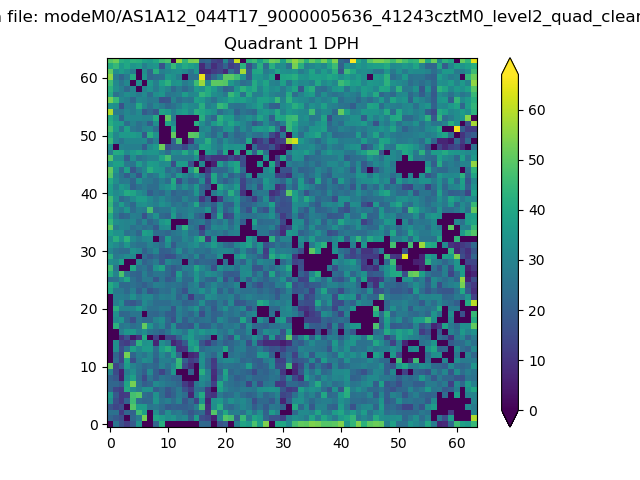
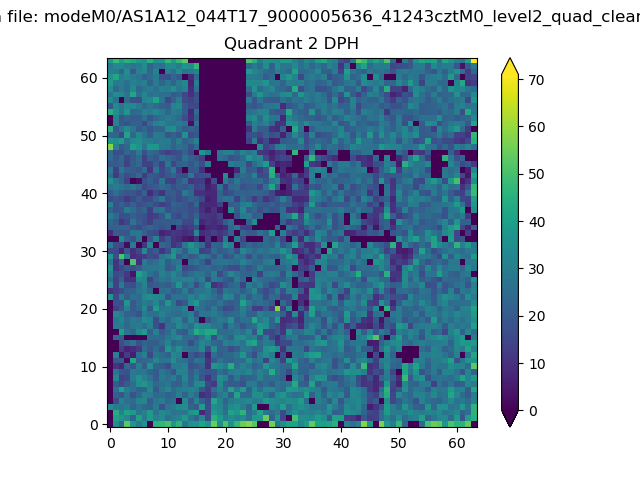
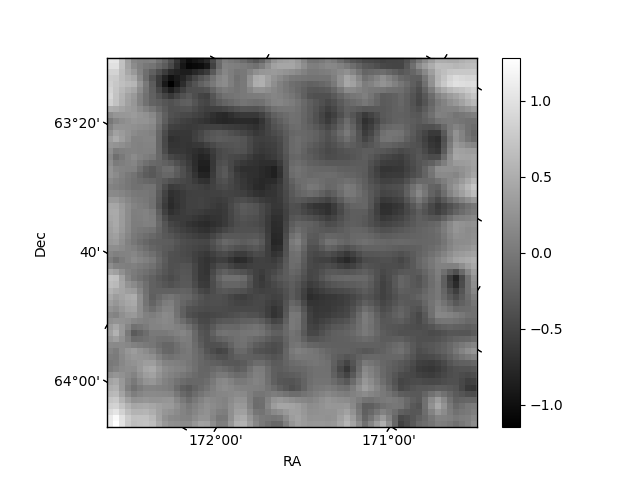
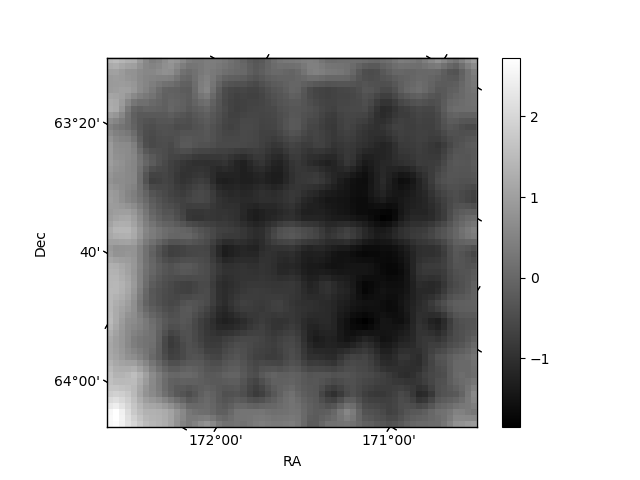
Histogram calculated using DETX and DETY for each event in the final _common_clean file
| Quadrant A |  |
 |
Quadrant B |
|---|---|---|---|
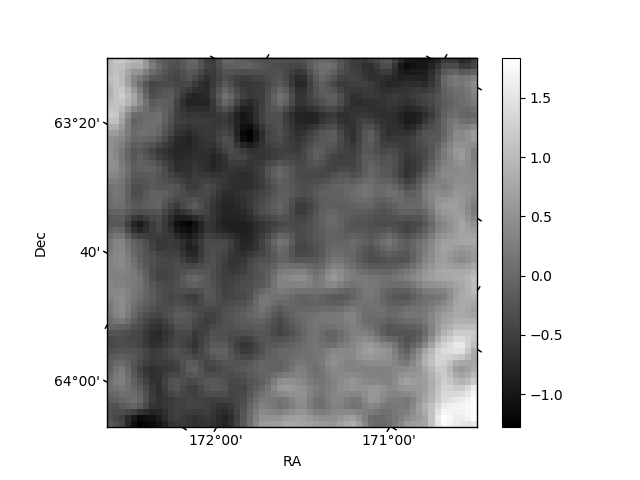
| Quadrant D |  |
 |
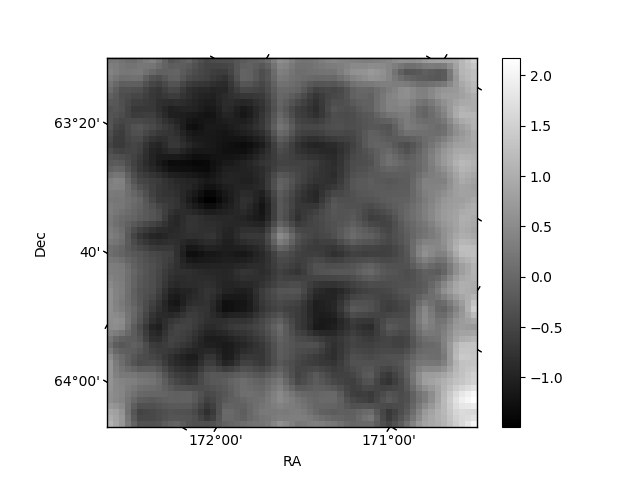
Quadrant C |
| Plot type | Count rate plots | Images |
|---|---|---|
| Comparison with Poisson distribution Blue bars denote a histogram of data divided into 1 sec bins. Red curve is a Poisson curve with rate = median count rate of data. |
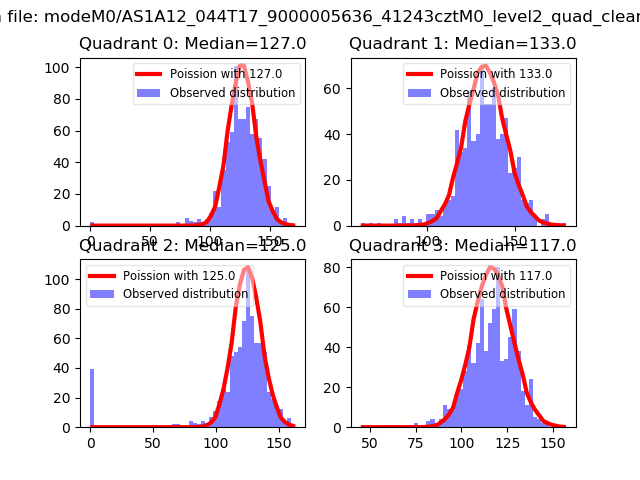 |
 |
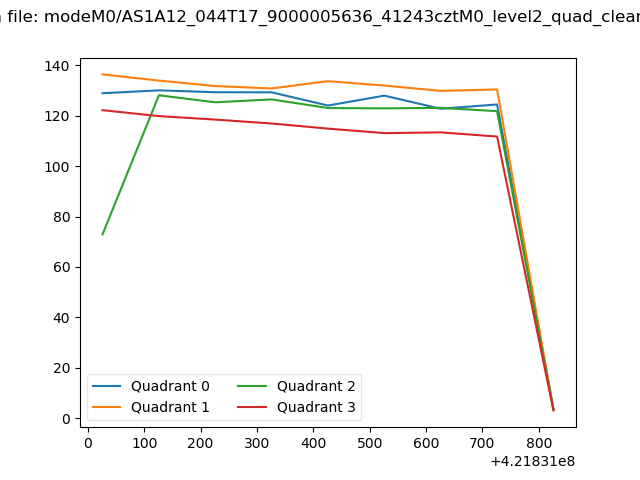
| Quadrant-wise count rates Data is divided into 100 sec bins |
 |
|
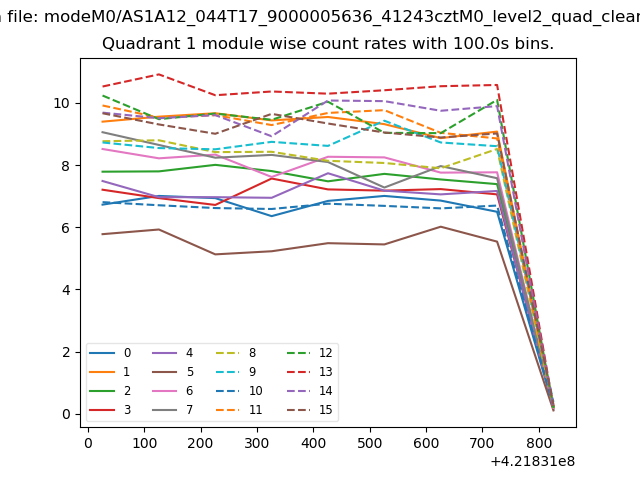
| Module-wise count rates for Quadrant A Data is divided into 100 sec bins |
 |
 |
| Module-wise count rates for Quadrant B Data is divided into 100 sec bins |
 |
 |
| Module-wise count rates for Quadrant C Data is divided into 100 sec bins |
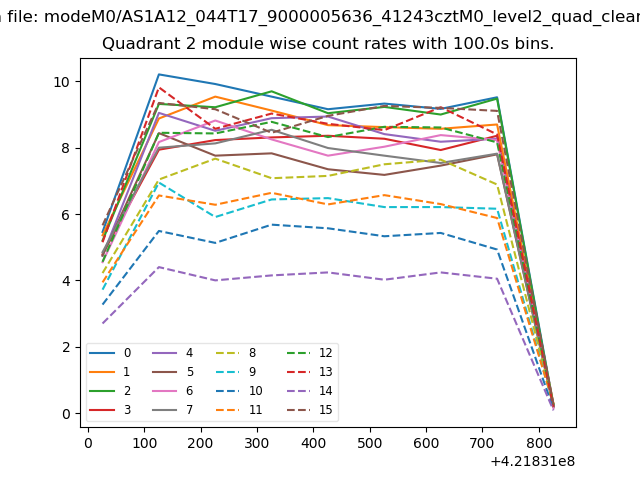 |
 |
| Module-wise count rates for Quadrant D Data is divided into 100 sec bins |
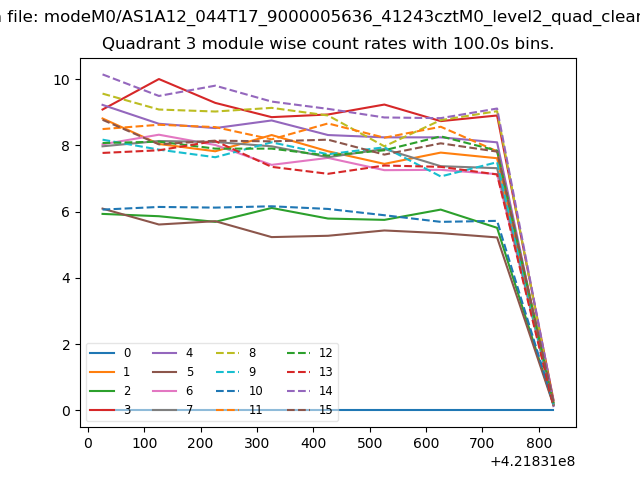 |
 |
| Parameter | Plot |
|---|---|
| CZT HV Monitor | 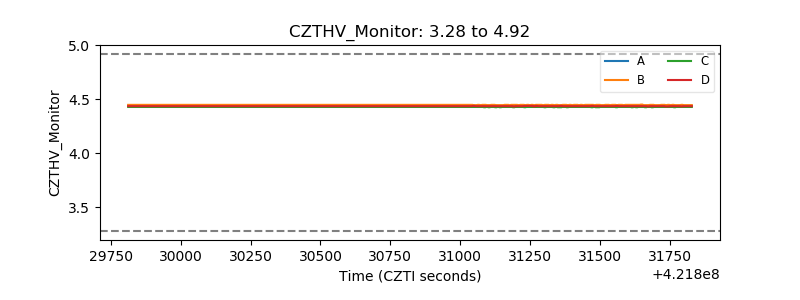 |
| D_VDD | 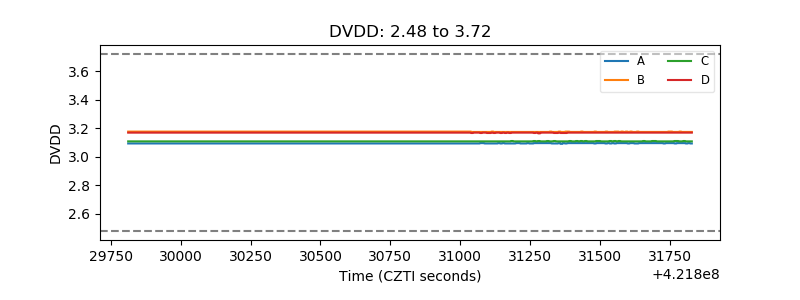 |
| Temperature 1 | 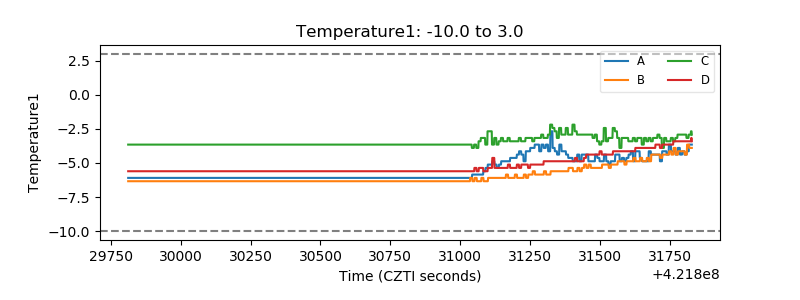 |
| Veto HV Monitor | 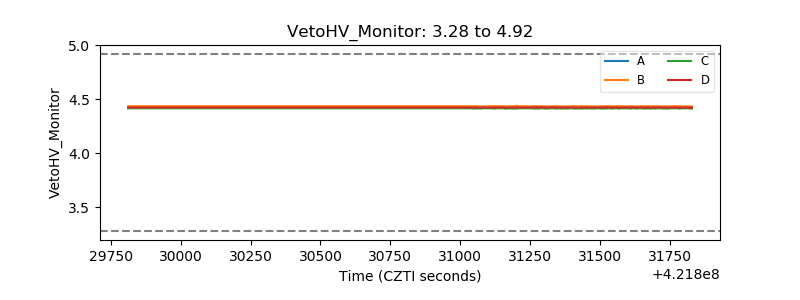 |
| Veto LLD | 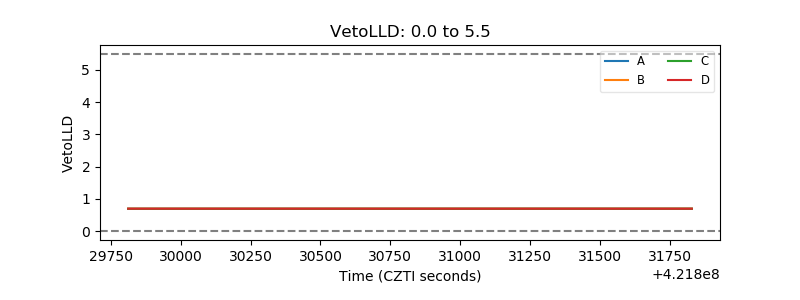 |
| Alpha Counter | 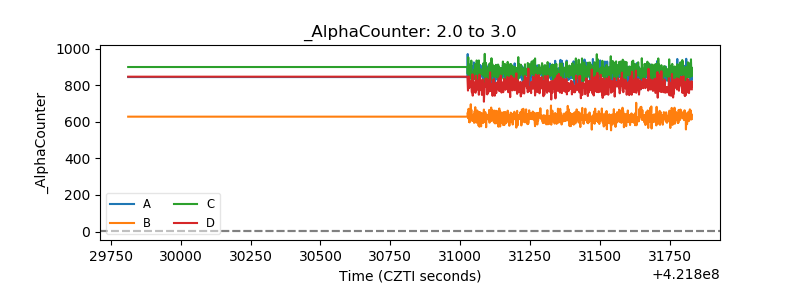 |
| _CPM_Rate | 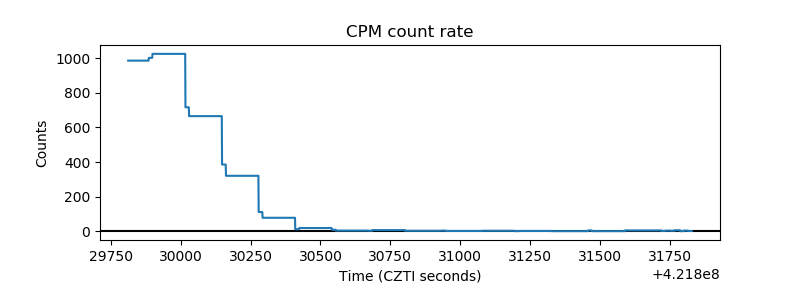 |
| CZT Counter | 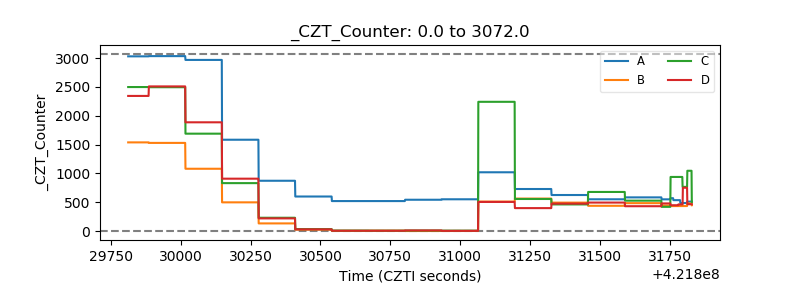 |
| +2.5 Volts monitor | 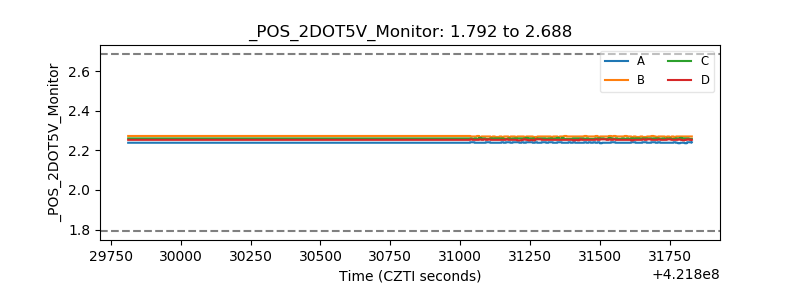 |
| +5 Volts monitor | 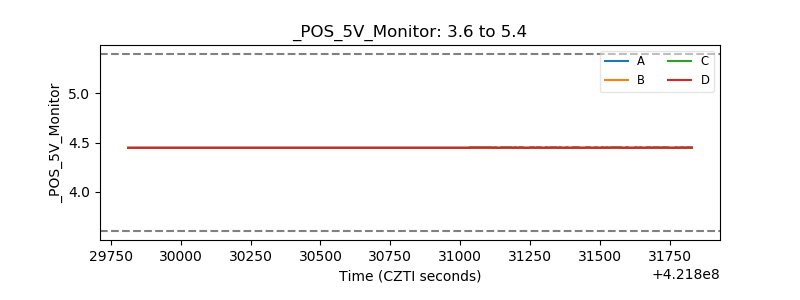 |
| _ROLL_ROT | 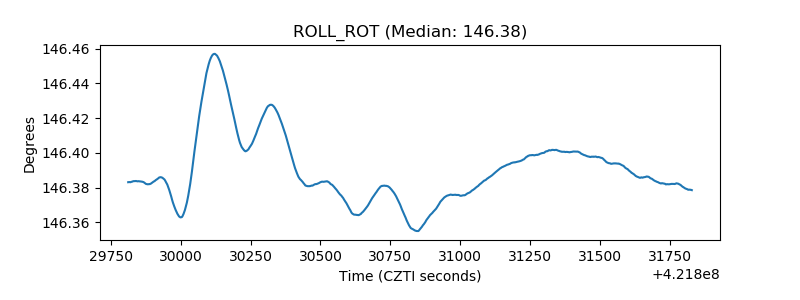 |
| _Roll_DEC | 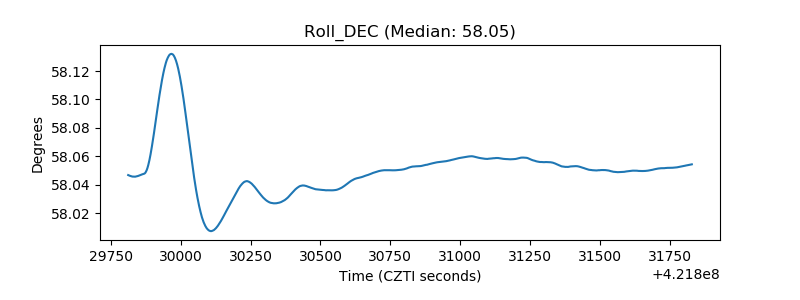 |
| _Roll_RA | 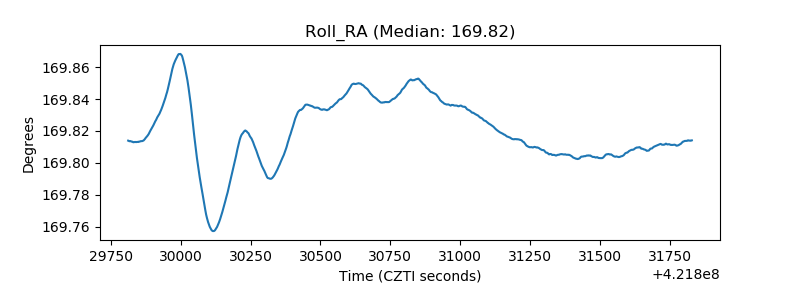 |
| Veto Counter | 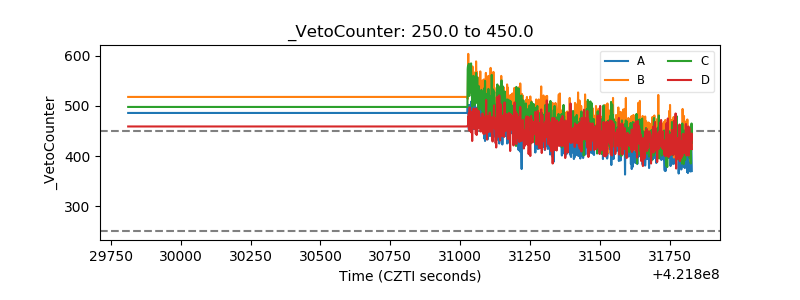 |