| Param | Original file | Final file |
|---|---|---|
| Filename | modeM0/AS1A12_044T17_9000005636_41244cztM0_level2.fits | modeM0/AS1A12_044T17_9000005636_41244cztM0_level2_quad_clean.evt |
| Size (bytes) | 381,317,760 | 82,316,160 |
| Size | 363.7 MB | 78.5 MB |
| Events in quadrant A | 2,814,177 | 591,020 |
| Events in quadrant B | 4,825,529 | 475,105 |
| Events in quadrant C | 2,929,138 | 562,863 |
| Events in quadrant D | 3,164,463 | 519,716 |
| Mode SS | |||
|---|---|---|---|
| Quadrant | BADHDUFLAG | Total packets | Discarded packets |
| A | 0 | 100 | 0 |
| B | 0 | 100 | 0 |
| C | 0 | 100 | 0 |
| D | 0 | 100 | 0 |
| Mode M0 | |||
|---|---|---|---|
| Quadrant | BADHDUFLAG | Total packets | Discarded packets |
| A | 0 | 11199 | 3 |
| B | 0 | 17616 | 2 |
| C | 0 | 11770 | 2 |
| D | 0 | 12740 | 2 |
| Mode M9 | |||
|---|---|---|---|
| Quadrant | BADHDUFLAG | Total packets | Discarded packets |
| A | 0 | 30 | 0 |
| B | 0 | 30 | 0 |
| C | 0 | 30 | 0 |
| D | 0 | 31 | 0 |
| Quadrant | Total seconds | Saturated seconds | Saturation percentage |
|---|---|---|---|
| A | 4902 | 18 | 0.367197% |
| B | 4902 | 1114 | 22.725418% |
| C | 4902 | 71 | 1.448388% |
| D | 4902 | 133 | 2.713178% |
Noise dominated data is calculated using 1-second bins in cleaned event files. If a bin has >2000 counts, and if more than 50% of those come from <1% of pixels, then it is considered to be noise-dominated and hence unusable.
| Quadrant | # 1 sec bins | Bins with >0 counts | Bins with >2000 counts | High rate bins dominated by noise | Noise dominated (total time) | Noise dominated (detector-on time) | Marked lightcurve |
|---|---|---|---|---|---|---|---|
| A | 7025 | 4903 | 5 | 5 | 0.07% | 0.10% | 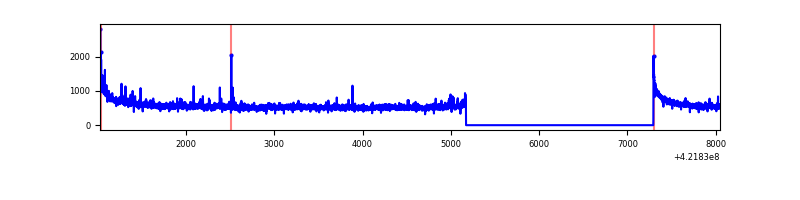 |
| B | 7025 | 4903 | 1084 | 1084 | 15.43% | 22.11% | 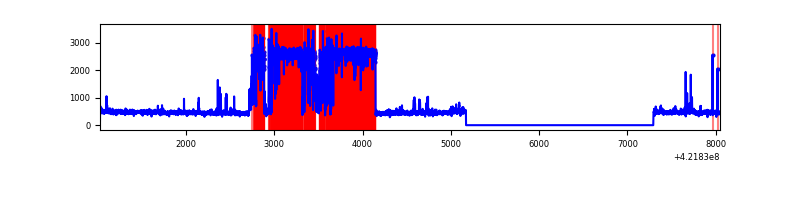 |
| C | 7025 | 4903 | 66 | 66 | 0.94% | 1.35% | 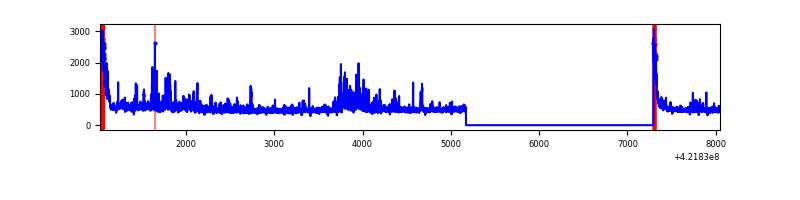 |
| D | 7025 | 4903 | 142 | 142 | 2.02% | 2.90% | 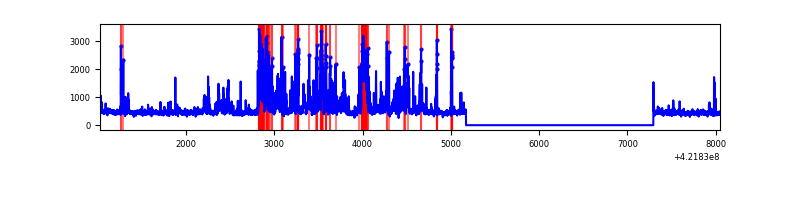 |
Top three noisy pixels from each quadrant. If the there are fewer than three noisy pixels in the level2.evt file, extra rows are filled as -1
| Pixel properties | Quadrant properties | ||||||
|---|---|---|---|---|---|---|---|
| Quadrant | DetID | PixID | Counts | Sigma | Mean | Median | Sigma |
| A | 10 | 83 | 509898 | 4475.2 | 561 | 551 | 113.8 |
| A | 0 | 8 | 77112 | 672.68 | 561 | 551 | 113.8 |
| A | 2 | 79 | 16024 | 135.95 | 561 | 551 | 113.8 |
| B | 0 | 186 | 2815860 | 30860.02 | 475 | 462 | 91.2 |
| B | 0 | 245 | 58921 | 640.78 | 475 | 462 | 91.2 |
| B | 5 | 255 | 33716 | 364.5 | 475 | 462 | 91.2 |
| C | 9 | 54 | 359524 | 2915.38 | 536 | 540 | 123.1 |
| C | 0 | 10 | 226815 | 1837.62 | 536 | 540 | 123.1 |
| C | 15 | 214 | 213082 | 1726.09 | 536 | 540 | 123.1 |
| D | 2 | 249 | 274195 | 2074.62 | 541 | 526 | 131.9 |
| D | 13 | 249 | 241620 | 1827.68 | 541 | 526 | 131.9 |
| D | 1 | 47 | 230263 | 1741.58 | 541 | 526 | 131.9 |
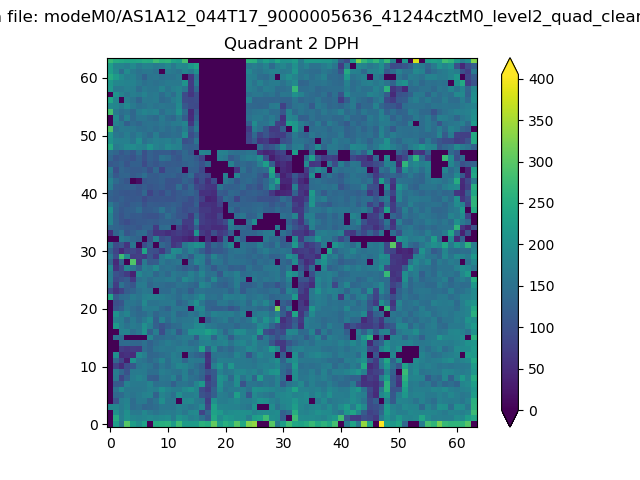
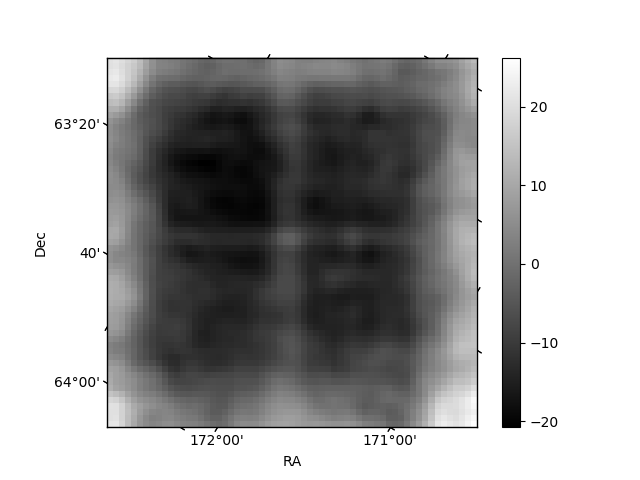
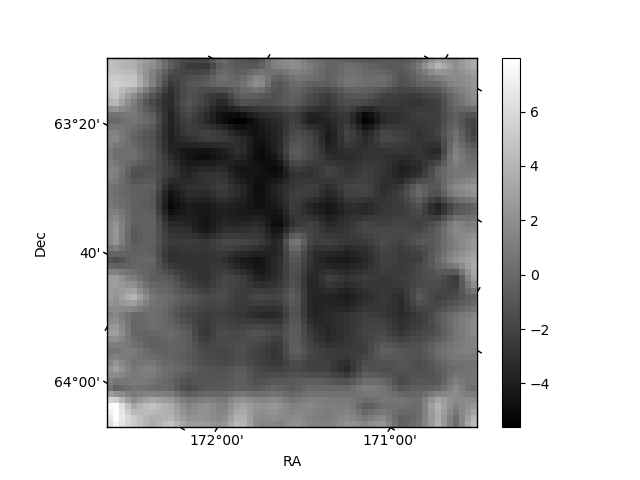
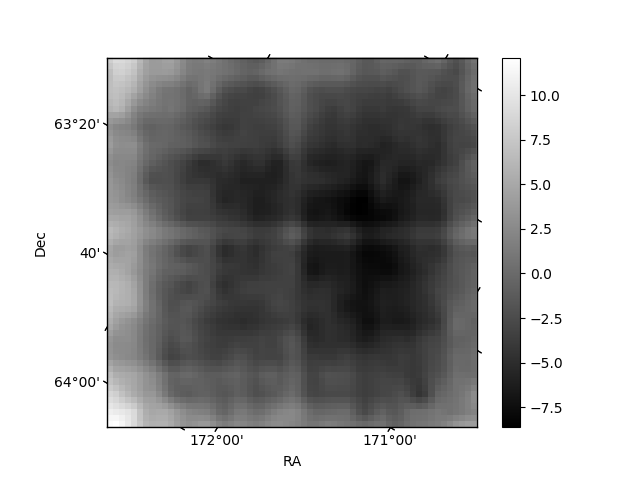
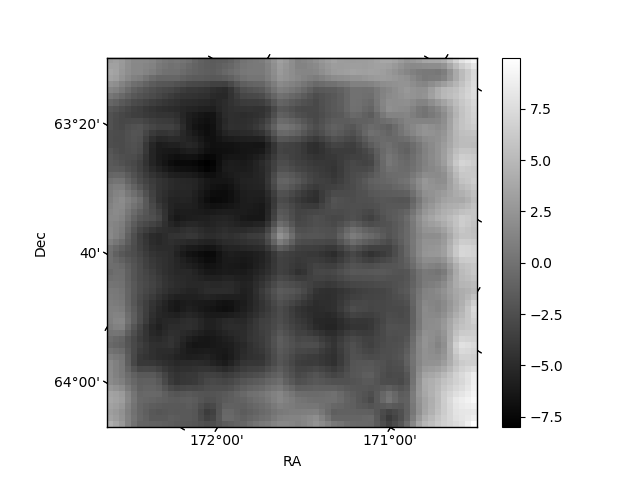
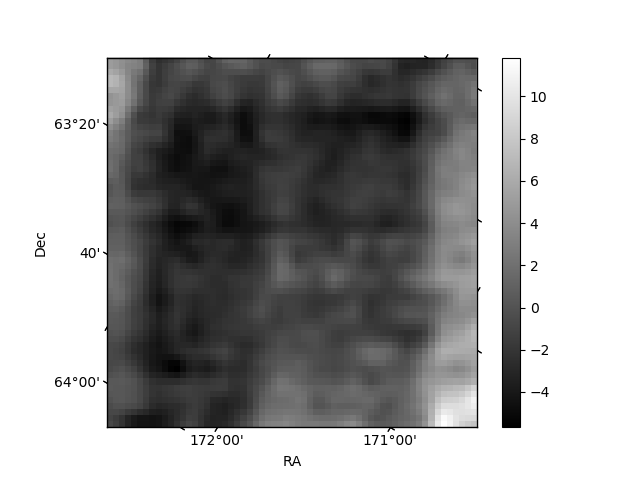
Histogram calculated using DETX and DETY for each event in the final _common_clean file
| Quadrant A | 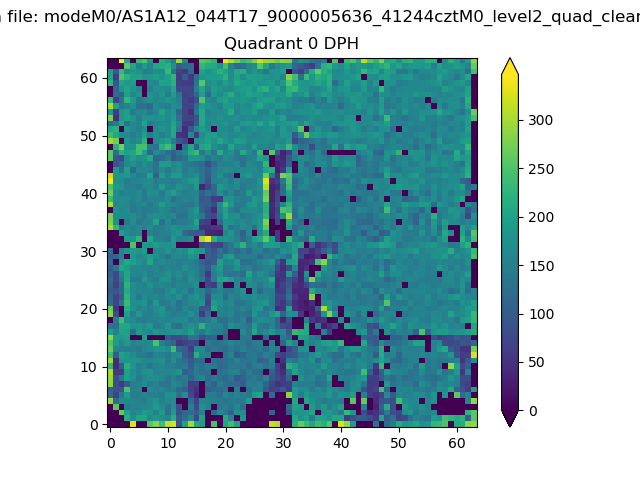 |
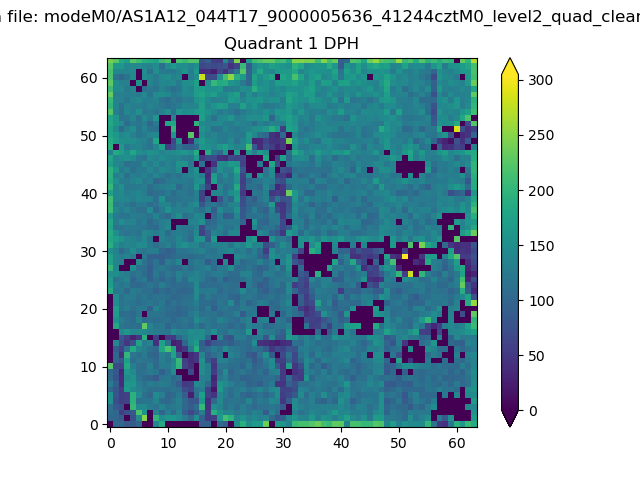 |
Quadrant B |
|---|---|---|---|
| Quadrant D | 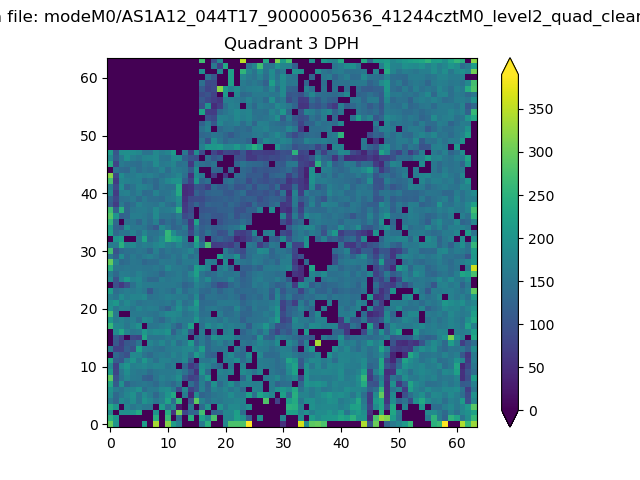 |
 |
Quadrant C |
| Plot type | Count rate plots | Images |
|---|---|---|
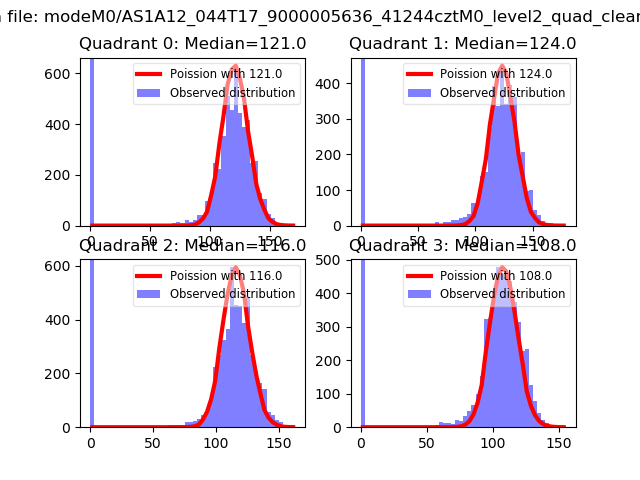
| Comparison with Poisson distribution Blue bars denote a histogram of data divided into 1 sec bins. Red curve is a Poisson curve with rate = median count rate of data. |
 |
 |
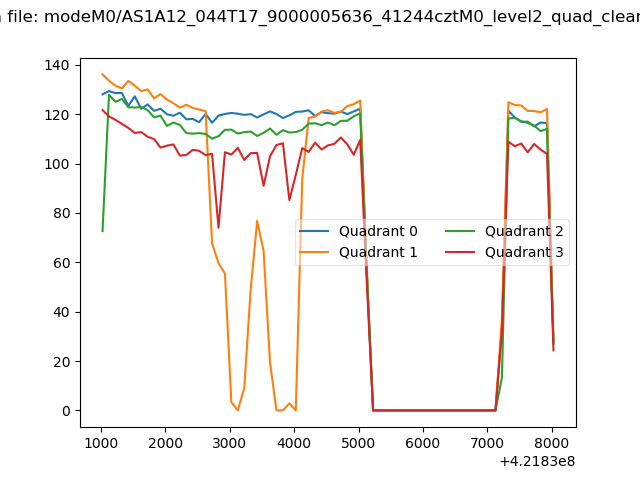
| Quadrant-wise count rates Data is divided into 100 sec bins |
 |
|
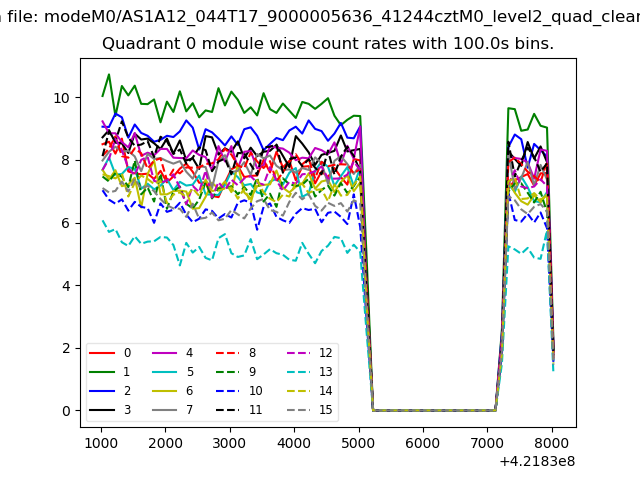
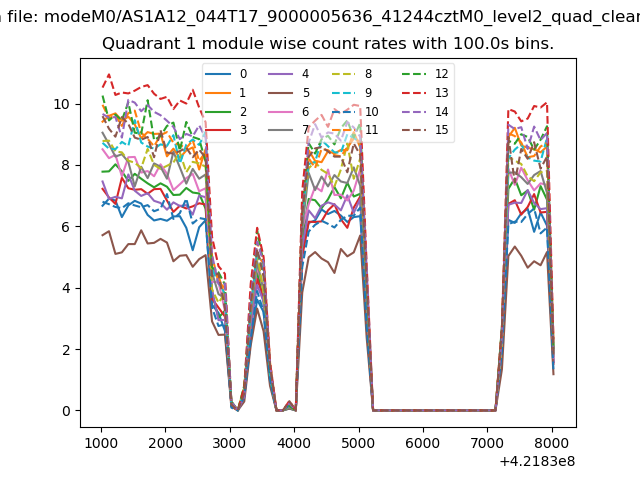
| Module-wise count rates for Quadrant A Data is divided into 100 sec bins |
 |
 |
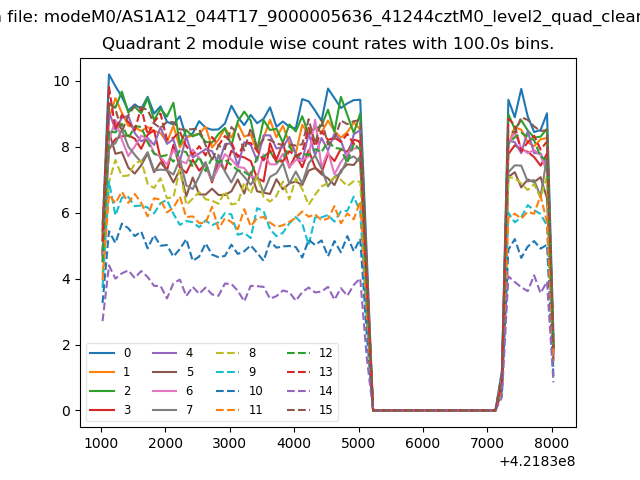
| Module-wise count rates for Quadrant B Data is divided into 100 sec bins |
 |
 |
| Module-wise count rates for Quadrant C Data is divided into 100 sec bins |
 |
 |
| Module-wise count rates for Quadrant D Data is divided into 100 sec bins |
 |
 |
| Parameter | Plot |
|---|---|
| CZT HV Monitor | 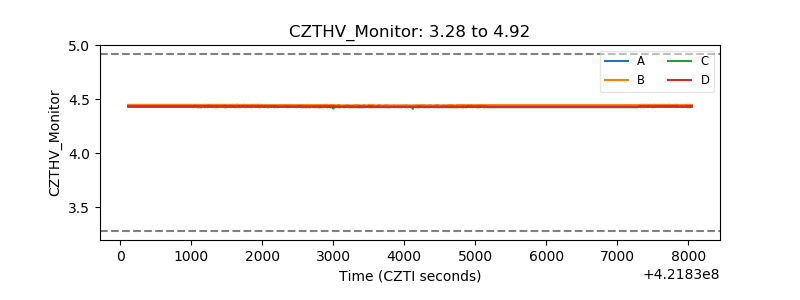 |
| D_VDD | 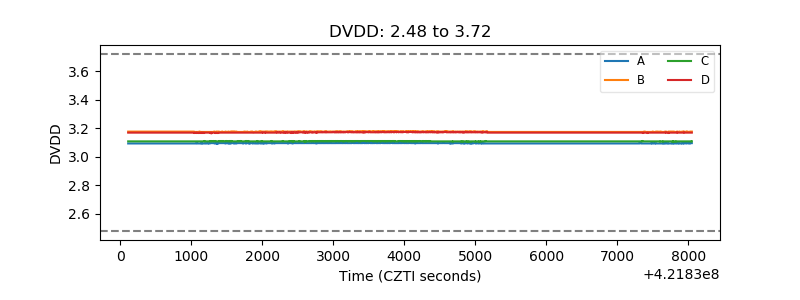 |
| Temperature 1 | 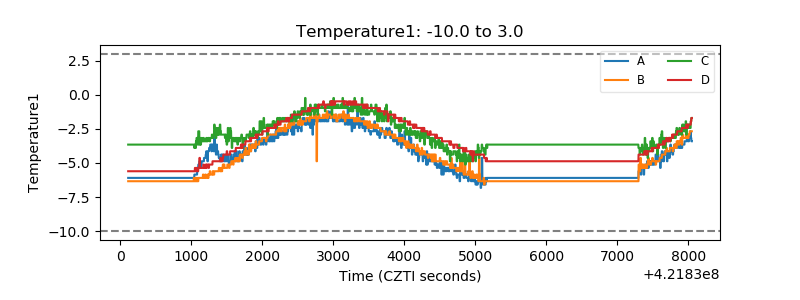 |
| Veto HV Monitor | 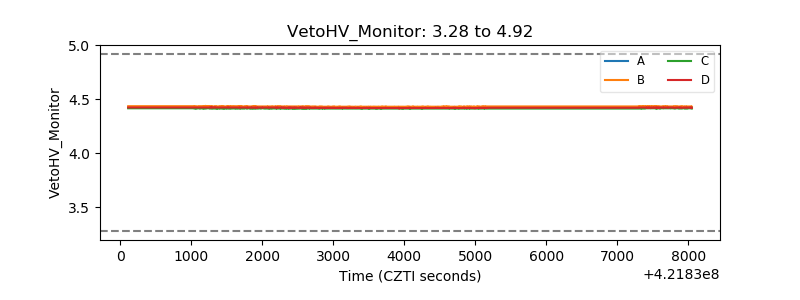 |
| Veto LLD | 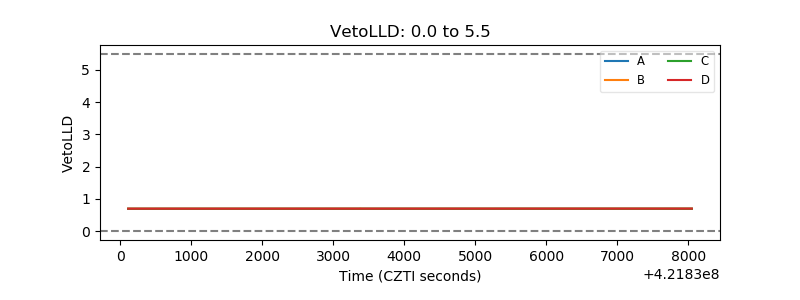 |
| Alpha Counter | 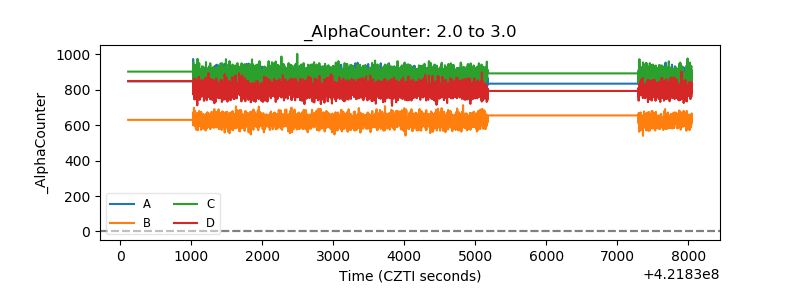 |
| _CPM_Rate | 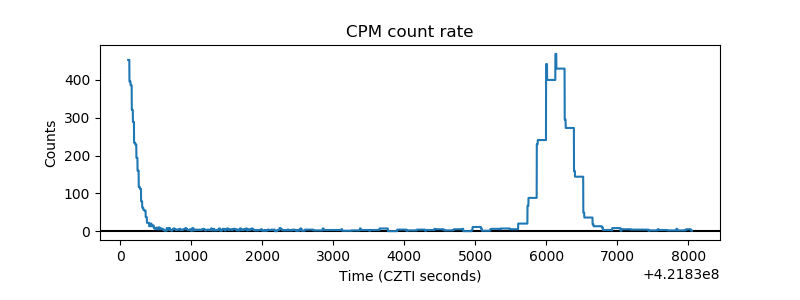 |
| CZT Counter | 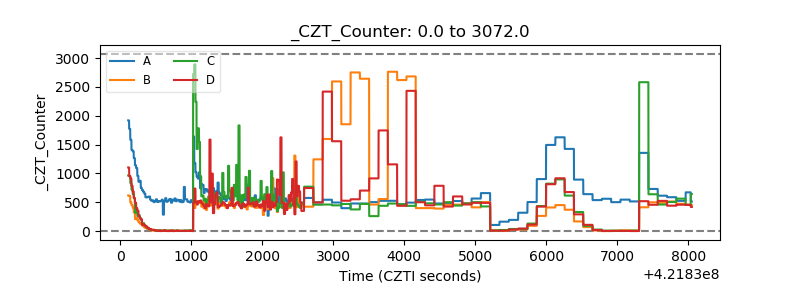 |
| +2.5 Volts monitor | 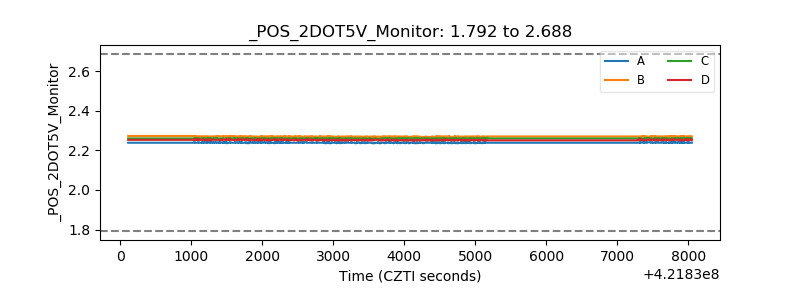 |
| +5 Volts monitor | 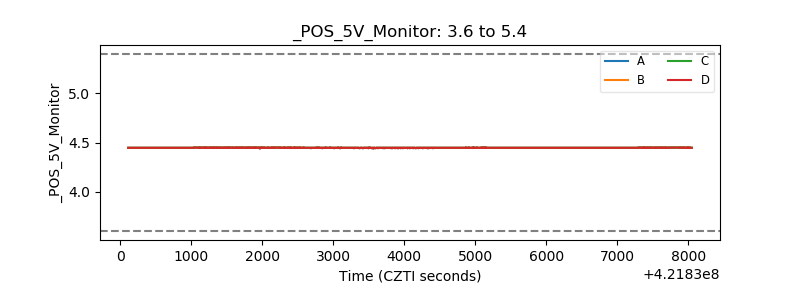 |
| _ROLL_ROT | 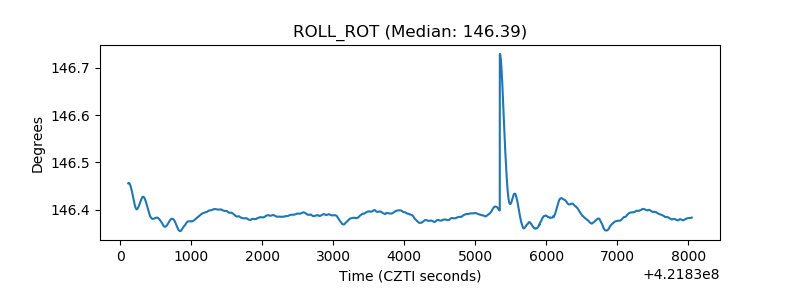 |
| _Roll_DEC | 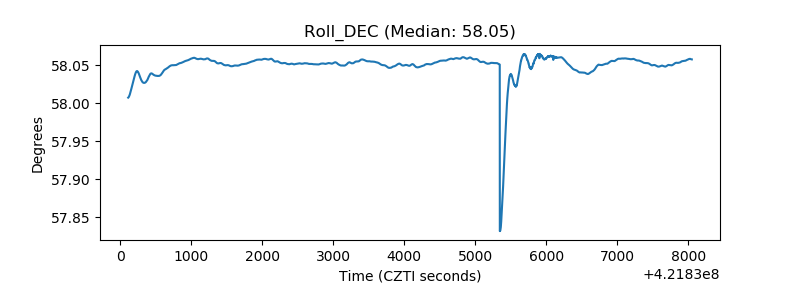 |
| _Roll_RA | 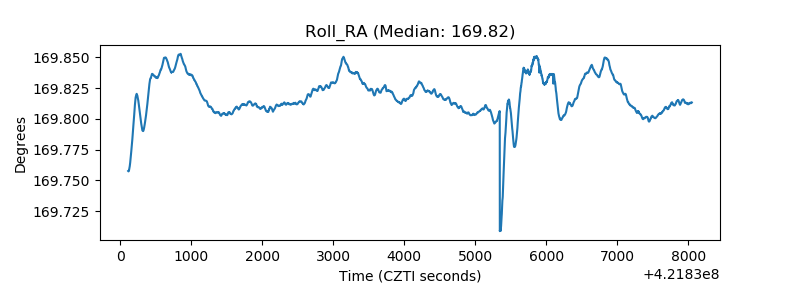 |
| Veto Counter | 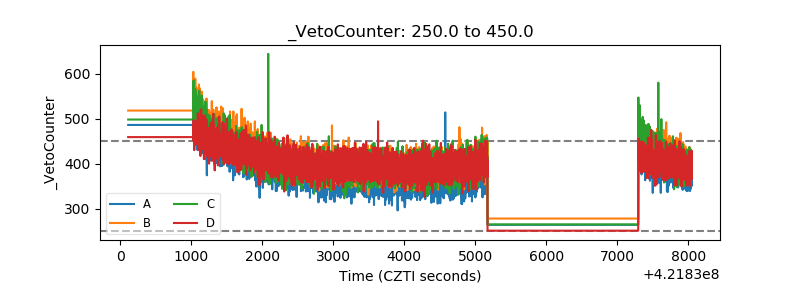 |