| Param | Original file | Final file |
|---|---|---|
| Filename | modeM0/AS1A12_044T17_9000005636_41245cztM0_level2.fits | modeM0/AS1A12_044T17_9000005636_41245cztM0_level2_quad_clean.evt |
| Size (bytes) | 352,932,480 | 84,516,480 |
| Size | 336.6 MB | 80.6 MB |
| Events in quadrant A | 2,747,641 | 579,431 |
| Events in quadrant B | 3,509,761 | 571,341 |
| Events in quadrant C | 3,545,480 | 541,797 |
| Events in quadrant D | 2,869,348 | 513,182 |
| Mode SS | |||
|---|---|---|---|
| Quadrant | BADHDUFLAG | Total packets | Discarded packets |
| A | 0 | 104 | 0 |
| B | 0 | 104 | 0 |
| C | 0 | 104 | 0 |
| D | 0 | 104 | 0 |
| Mode M0 | |||
|---|---|---|---|
| Quadrant | BADHDUFLAG | Total packets | Discarded packets |
| A | 0 | 11099 | 3 |
| B | 0 | 13780 | 2 |
| C | 0 | 13800 | 2 |
| D | 0 | 12020 | 2 |
| Mode M9 | |||
|---|---|---|---|
| Quadrant | BADHDUFLAG | Total packets | Discarded packets |
| A | 0 | 20 | 0 |
| B | 0 | 20 | 0 |
| C | 0 | 20 | 0 |
| D | 0 | 20 | 0 |
| Quadrant | Total seconds | Saturated seconds | Saturation percentage |
|---|---|---|---|
| A | 5036 | 13 | 0.258141% |
| B | 5036 | 257 | 5.103257% |
| C | 5036 | 184 | 3.653693% |
| D | 5037 | 83 | 1.647806% |
Noise dominated data is calculated using 1-second bins in cleaned event files. If a bin has >2000 counts, and if more than 50% of those come from <1% of pixels, then it is considered to be noise-dominated and hence unusable.
| Quadrant | # 1 sec bins | Bins with >0 counts | Bins with >2000 counts | High rate bins dominated by noise | Noise dominated (total time) | Noise dominated (detector-on time) | Marked lightcurve |
|---|---|---|---|---|---|---|---|
| A | 7069 | 5037 | 3 | 3 | 0.04% | 0.06% | 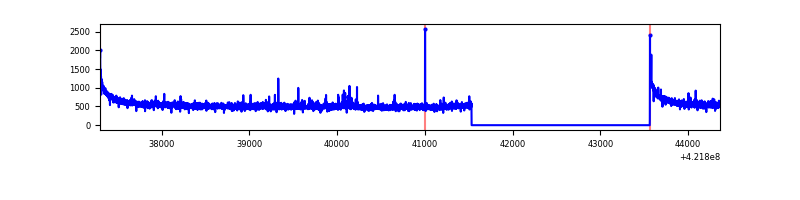 |
| B | 7069 | 5037 | 241 | 241 | 3.41% | 4.78% | 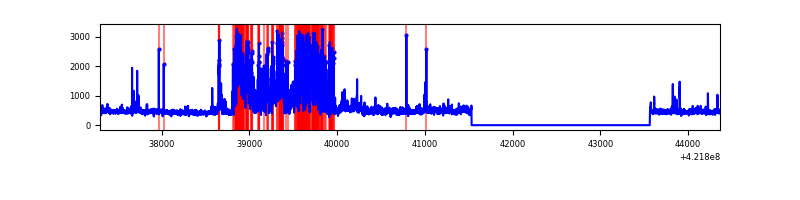 |
| C | 7069 | 5037 | 178 | 178 | 2.52% | 3.53% | 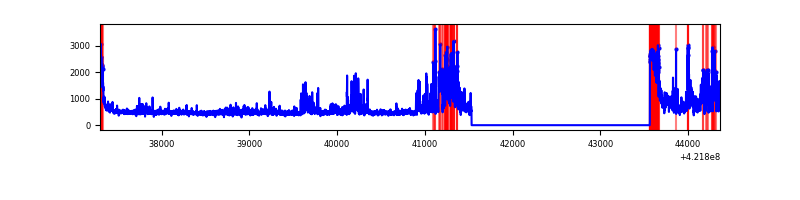 |
| D | 7070 | 5038 | 60 | 60 | 0.85% | 1.19% | 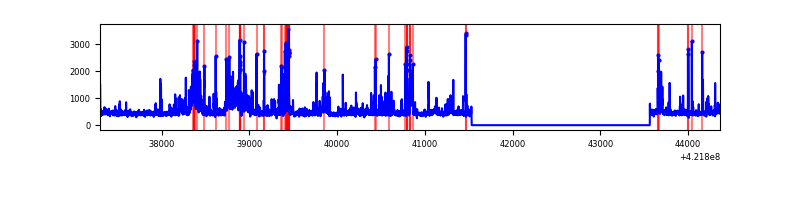 |
Top three noisy pixels from each quadrant. If the there are fewer than three noisy pixels in the level2.evt file, extra rows are filled as -1
| Pixel properties | Quadrant properties | ||||||
|---|---|---|---|---|---|---|---|
| Quadrant | DetID | PixID | Counts | Sigma | Mean | Median | Sigma |
| A | 10 | 83 | 517321 | 4583.42 | 556 | 545 | 112.7 |
| A | 12 | 189 | 27457 | 238.69 | 556 | 545 | 112.7 |
| A | 0 | 8 | 21052 | 181.88 | 556 | 545 | 112.7 |
| B | 0 | 186 | 1116910 | 10616.72 | 542 | 526 | 105.2 |
| B | 0 | 190 | 107875 | 1020.88 | 542 | 526 | 105.2 |
| B | 5 | 172 | 49181 | 462.71 | 542 | 526 | 105.2 |
| C | 9 | 54 | 679682 | 5521.4 | 531 | 534 | 123.0 |
| C | 14 | 254 | 290542 | 2357.73 | 531 | 534 | 123.0 |
| C | 0 | 10 | 282453 | 2291.97 | 531 | 534 | 123.0 |
| D | 5 | 222 | 298835 | 2259.4 | 539 | 522 | 132.0 |
| D | 13 | 249 | 192765 | 1456.03 | 539 | 522 | 132.0 |
| D | 2 | 249 | 127058 | 958.37 | 539 | 522 | 132.0 |
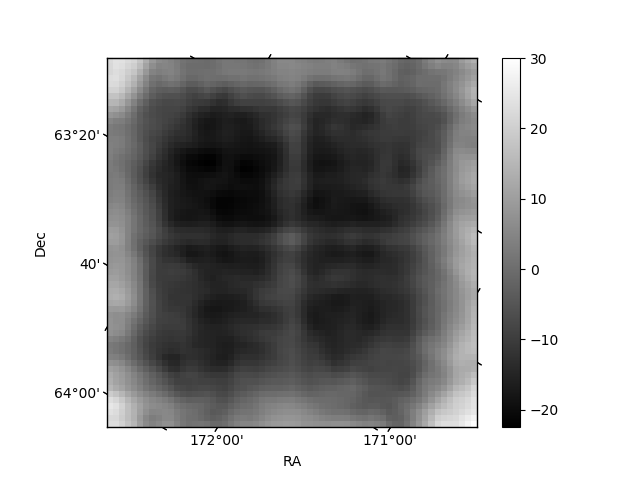
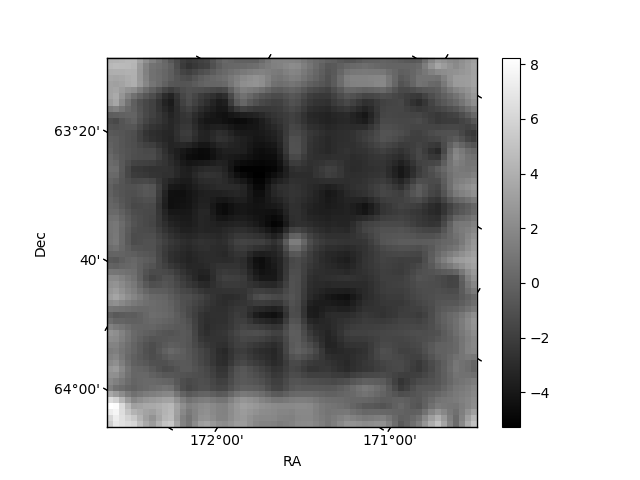
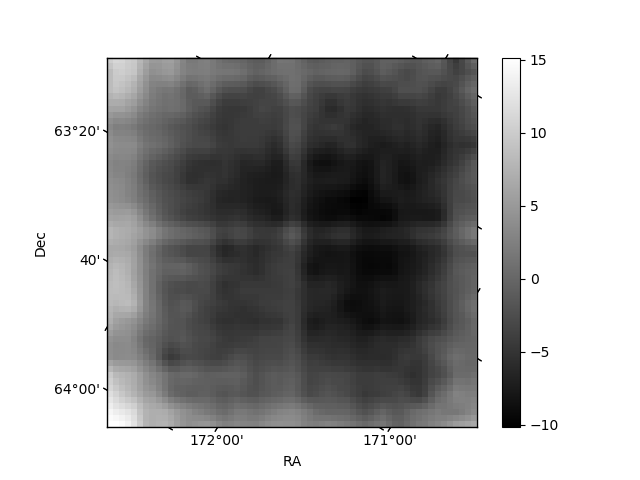
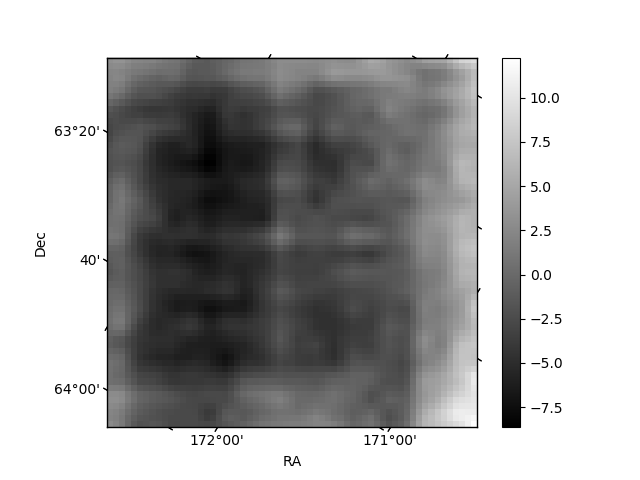
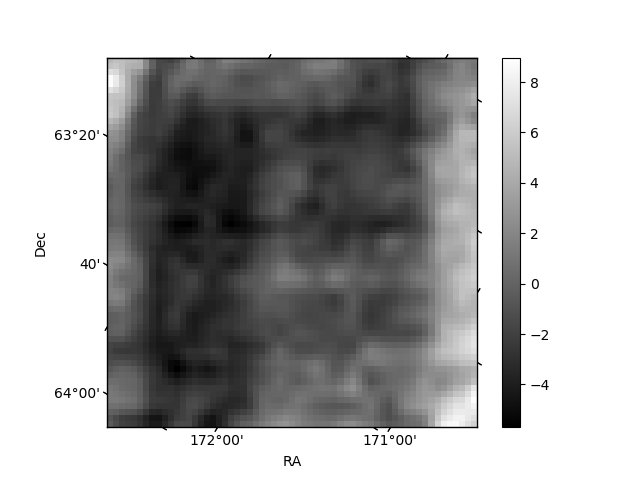
Histogram calculated using DETX and DETY for each event in the final _common_clean file
| Quadrant A | 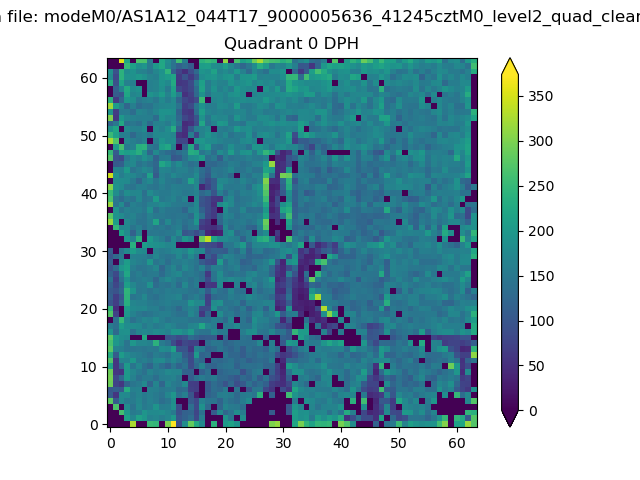 |
 |
Quadrant B |
|---|---|---|---|
| Quadrant D | 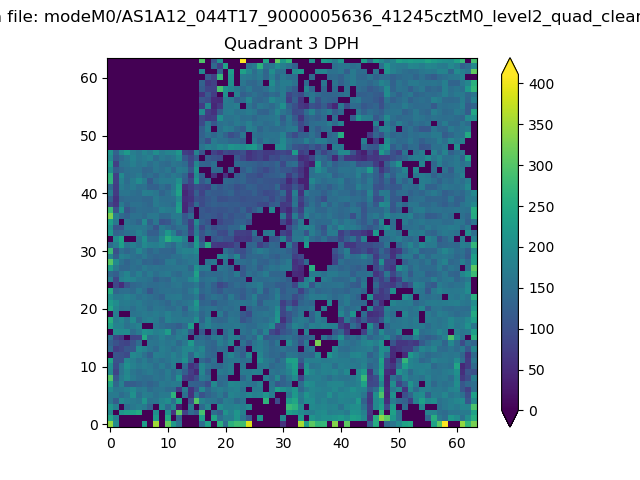 |
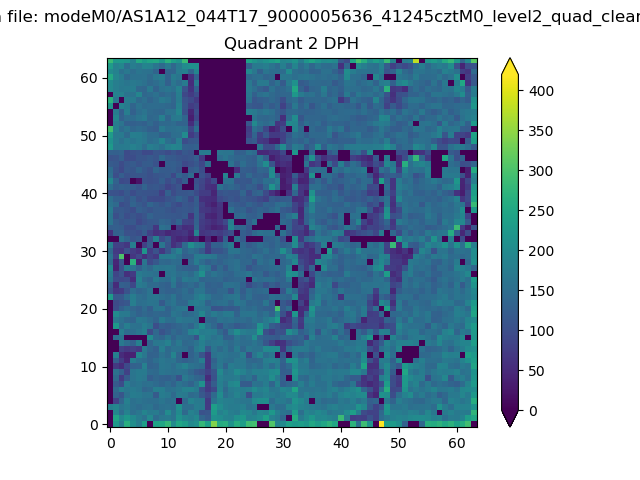 |
Quadrant C |
| Plot type | Count rate plots | Images |
|---|---|---|
| Comparison with Poisson distribution Blue bars denote a histogram of data divided into 1 sec bins. Red curve is a Poisson curve with rate = median count rate of data. |
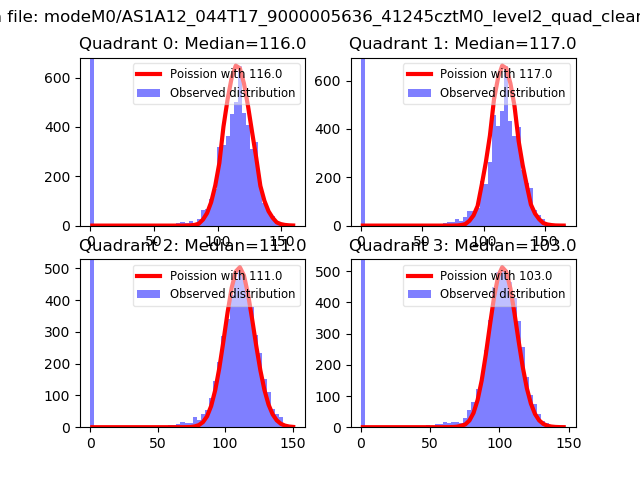 |
 |
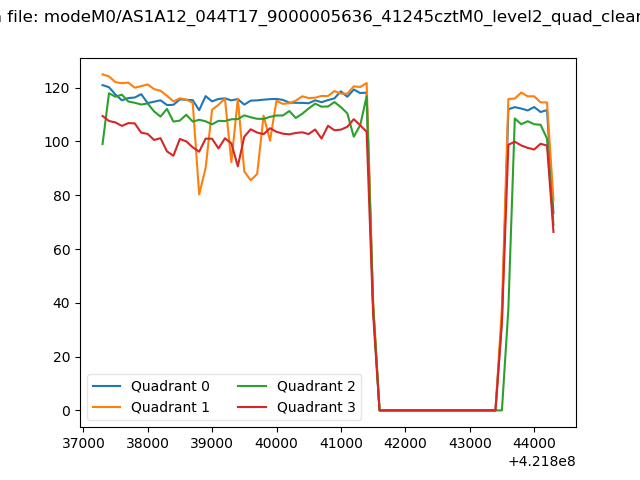
| Quadrant-wise count rates Data is divided into 100 sec bins |
 |
|
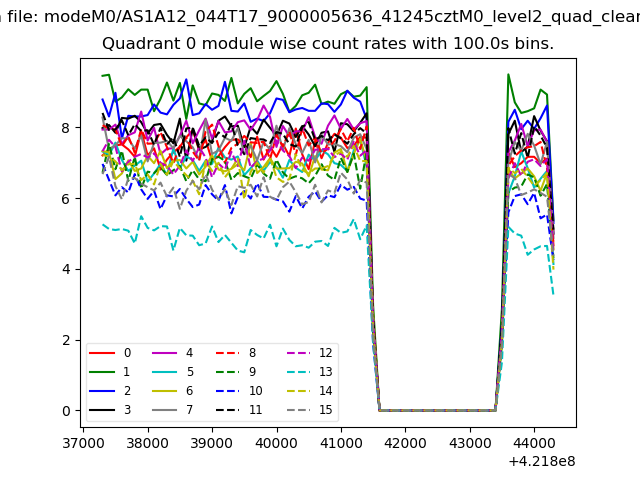
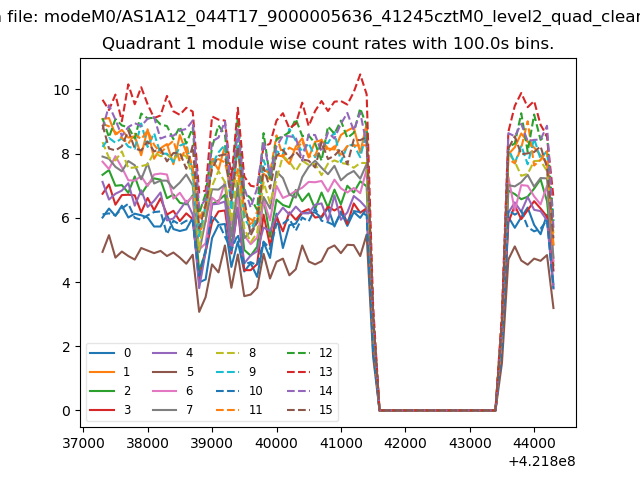
| Module-wise count rates for Quadrant A Data is divided into 100 sec bins |
 |
 |
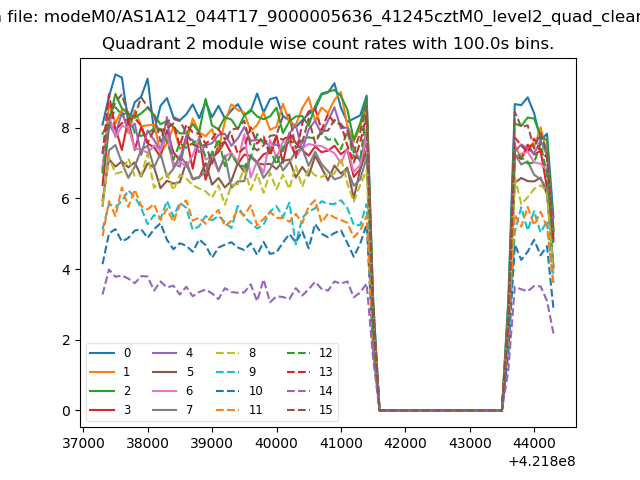
| Module-wise count rates for Quadrant B Data is divided into 100 sec bins |
 |
 |
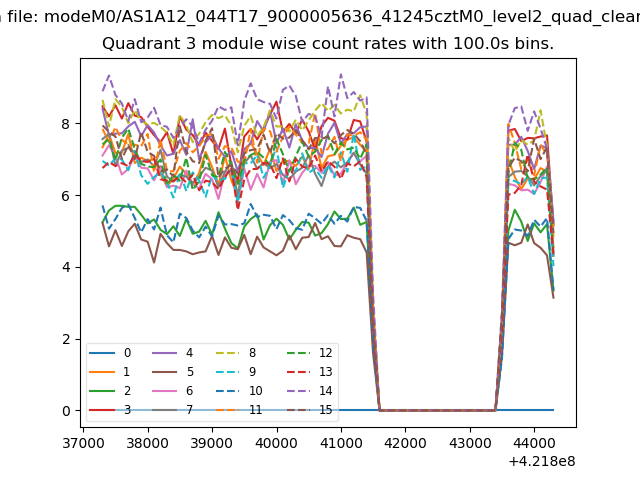
| Module-wise count rates for Quadrant C Data is divided into 100 sec bins |
 |
 |
| Module-wise count rates for Quadrant D Data is divided into 100 sec bins |
 |
 |
| Parameter | Plot |
|---|---|
| CZT HV Monitor | 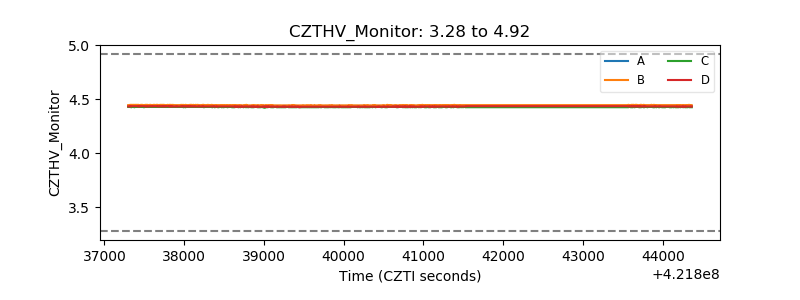 |
| D_VDD | 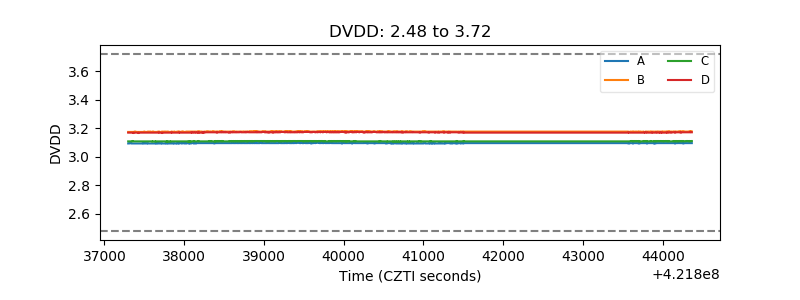 |
| Temperature 1 | 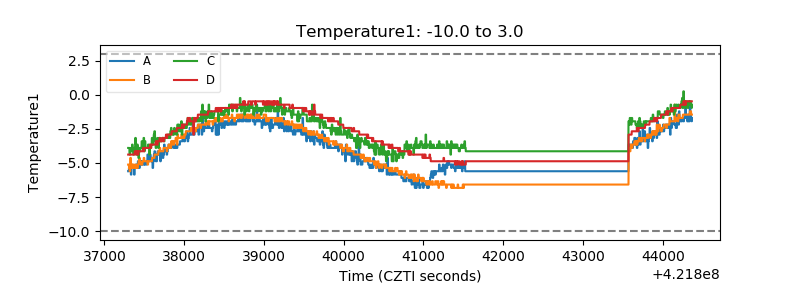 |
| Veto HV Monitor | 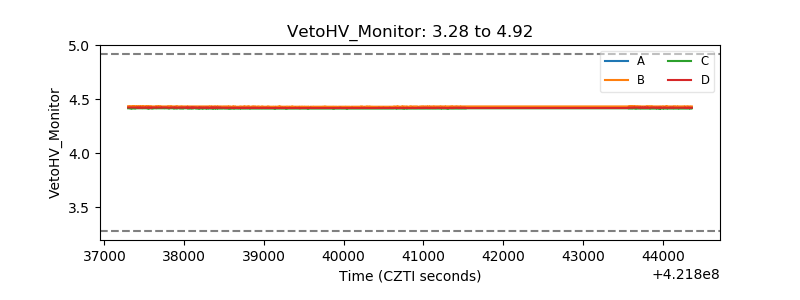 |
| Veto LLD | 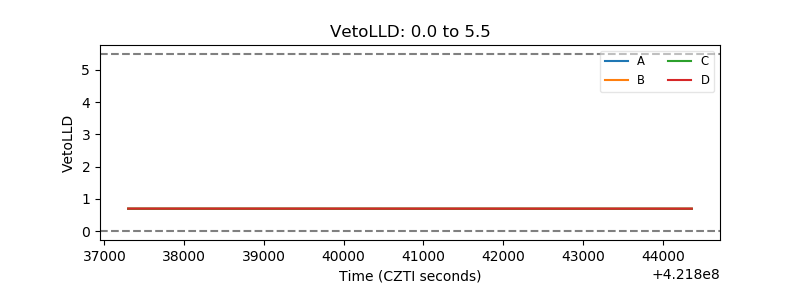 |
| Alpha Counter | 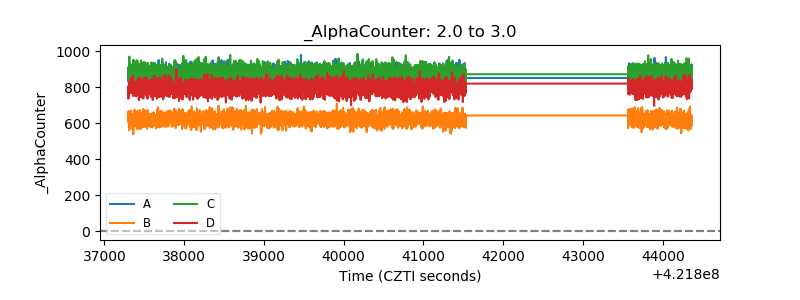 |
| _CPM_Rate | 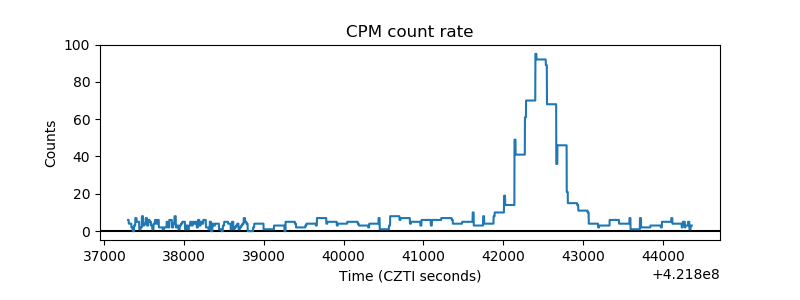 |
| CZT Counter | 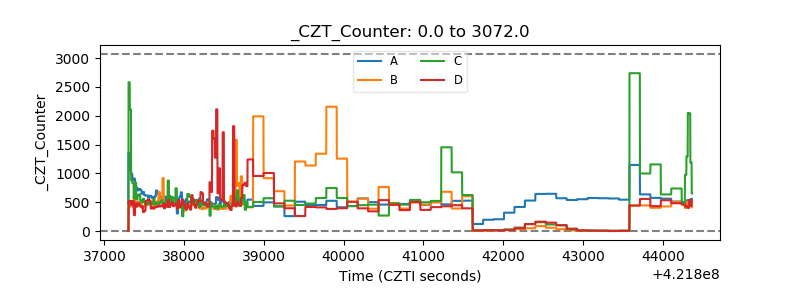 |
| +2.5 Volts monitor | 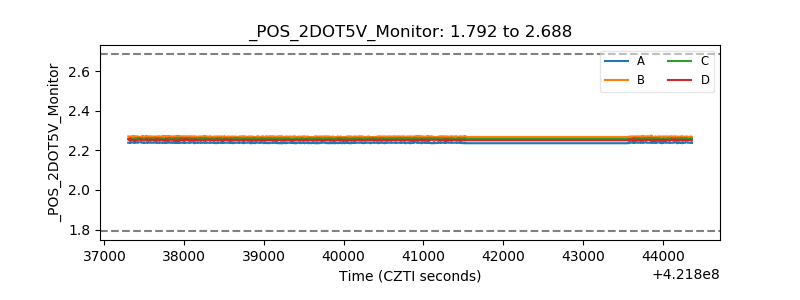 |
| +5 Volts monitor | 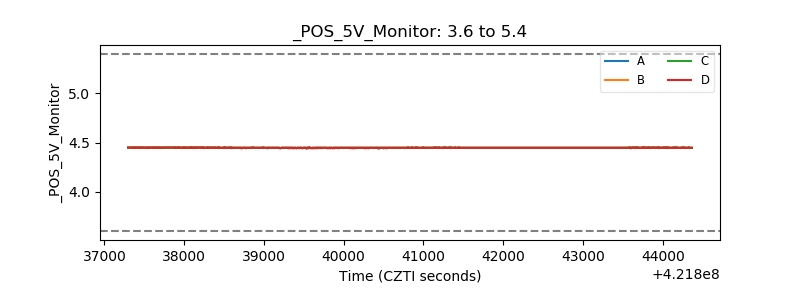 |
| _ROLL_ROT | 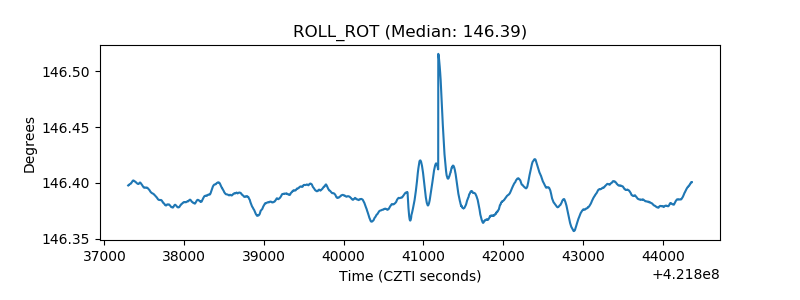 |
| _Roll_DEC | 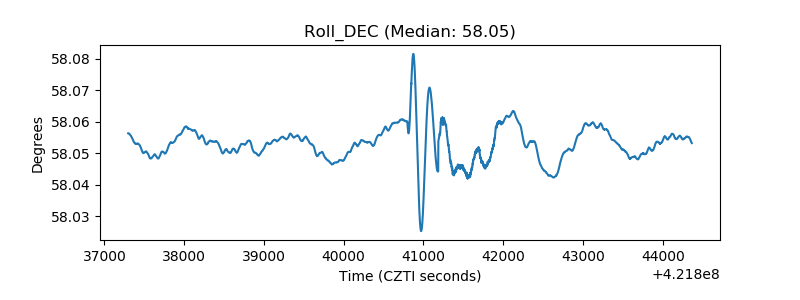 |
| _Roll_RA | 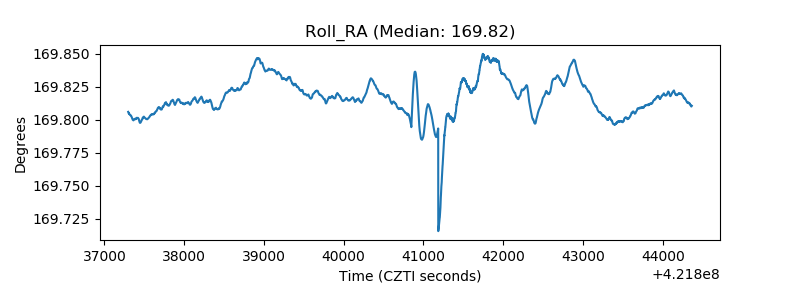 |
| Veto Counter | 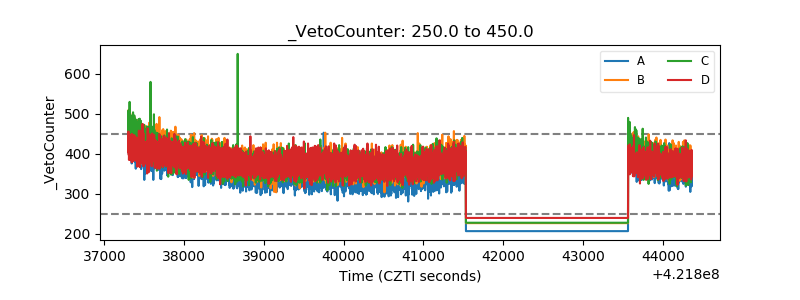 |