| Param | Original file | Final file |
|---|---|---|
| Filename | modeM0/AS1A12_044T17_9000005636_41247cztM0_level2.fits | modeM0/AS1A12_044T17_9000005636_41247cztM0_level2_quad_clean.evt |
| Size (bytes) | 432,780,480 | 91,157,760 |
| Size | 412.7 MB | 86.9 MB |
| Events in quadrant A | 3,255,933 | 626,580 |
| Events in quadrant B | 3,113,845 | 628,671 |
| Events in quadrant C | 5,671,060 | 549,768 |
| Events in quadrant D | 3,532,069 | 552,545 |
| Mode SS | |||
|---|---|---|---|
| Quadrant | BADHDUFLAG | Total packets | Discarded packets |
| A | 0 | 118 | 0 |
| B | 0 | 118 | 0 |
| C | 0 | 118 | 0 |
| D | 0 | 118 | 0 |
| Mode M0 | |||
|---|---|---|---|
| Quadrant | BADHDUFLAG | Total packets | Discarded packets |
| A | 0 | 13185 | 3 |
| B | 0 | 13351 | 2 |
| C | 0 | 20658 | 2 |
| D | 0 | 14498 | 2 |
| Mode M9 | |||
|---|---|---|---|
| Quadrant | BADHDUFLAG | Total packets | Discarded packets |
| A | 0 | 17 | 0 |
| B | 0 | 17 | 0 |
| C | 0 | 17 | 0 |
| D | 0 | 18 | 0 |
| Quadrant | Total seconds | Saturated seconds | Saturation percentage |
|---|---|---|---|
| A | 5752 | 27 | 0.469402% |
| B | 5752 | 110 | 1.912378% |
| C | 5752 | 679 | 11.804590% |
| D | 5752 | 181 | 3.146732% |
Noise dominated data is calculated using 1-second bins in cleaned event files. If a bin has >2000 counts, and if more than 50% of those come from <1% of pixels, then it is considered to be noise-dominated and hence unusable.
| Quadrant | # 1 sec bins | Bins with >0 counts | Bins with >2000 counts | High rate bins dominated by noise | Noise dominated (total time) | Noise dominated (detector-on time) | Marked lightcurve |
|---|---|---|---|---|---|---|---|
| A | 7185 | 5753 | 17 | 17 | 0.24% | 0.30% | 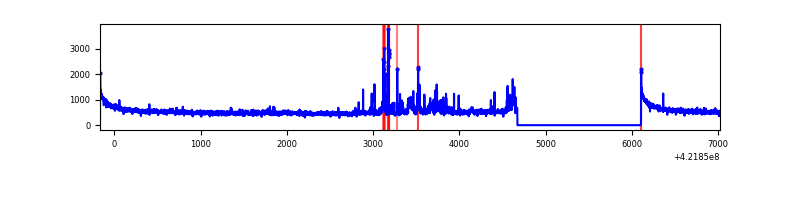 |
| B | 7185 | 5753 | 93 | 93 | 1.29% | 1.62% | 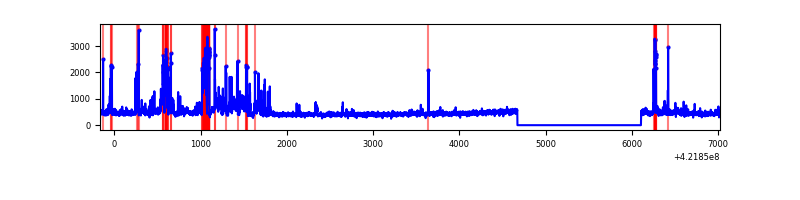 |
| C | 7185 | 5753 | 642 | 642 | 8.94% | 11.16% | 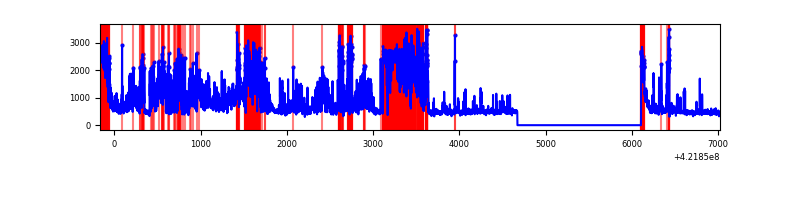 |
| D | 7184 | 5752 | 161 | 161 | 2.24% | 2.80% | 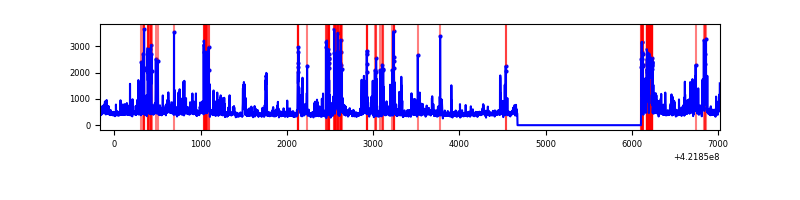 |
Top three noisy pixels from each quadrant. If the there are fewer than three noisy pixels in the level2.evt file, extra rows are filled as -1
| Pixel properties | Quadrant properties | ||||||
|---|---|---|---|---|---|---|---|
| Quadrant | DetID | PixID | Counts | Sigma | Mean | Median | Sigma |
| A | 10 | 83 | 585385 | 4621.32 | 615 | 602 | 126.5 |
| A | 0 | 8 | 241315 | 1902.27 | 615 | 602 | 126.5 |
| A | 12 | 189 | 34254 | 265.94 | 615 | 602 | 126.5 |
| B | 0 | 186 | 479160 | 4104.5 | 606 | 591 | 116.6 |
| B | 0 | 229 | 124124 | 1059.49 | 606 | 591 | 116.6 |
| B | 0 | 245 | 40881 | 345.55 | 606 | 591 | 116.6 |
| C | 9 | 54 | 2741034 | 20461.2 | 576 | 578 | 133.9 |
| C | 0 | 10 | 243246 | 1811.84 | 576 | 578 | 133.9 |
| C | 15 | 214 | 238866 | 1779.14 | 576 | 578 | 133.9 |
| D | 2 | 249 | 490221 | 3331.56 | 596 | 579 | 147.0 |
| D | 13 | 249 | 394075 | 2677.38 | 596 | 579 | 147.0 |
| D | 5 | 222 | 161377 | 1094.08 | 596 | 579 | 147.0 |
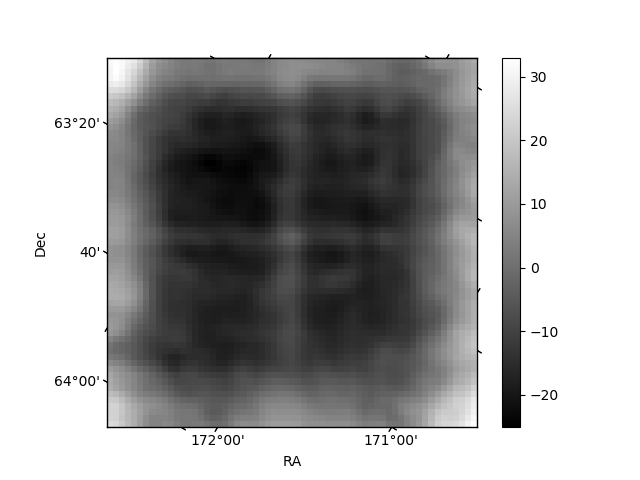
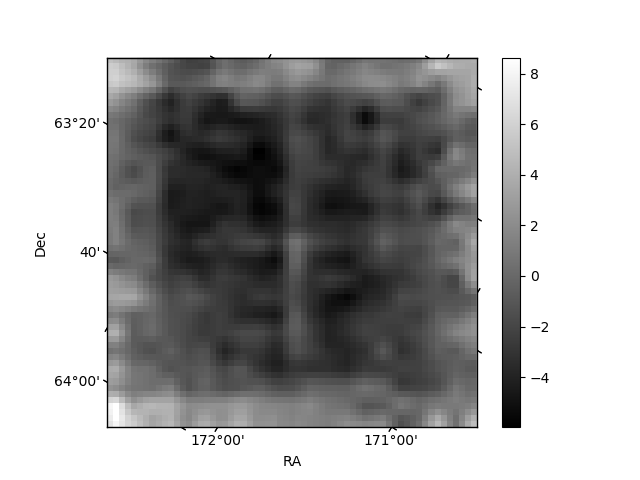
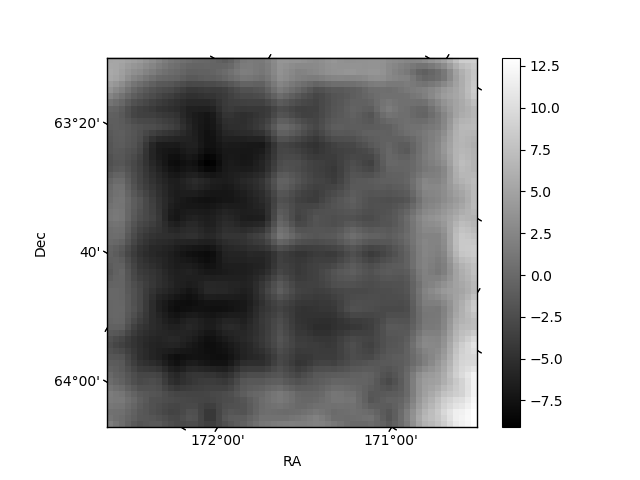
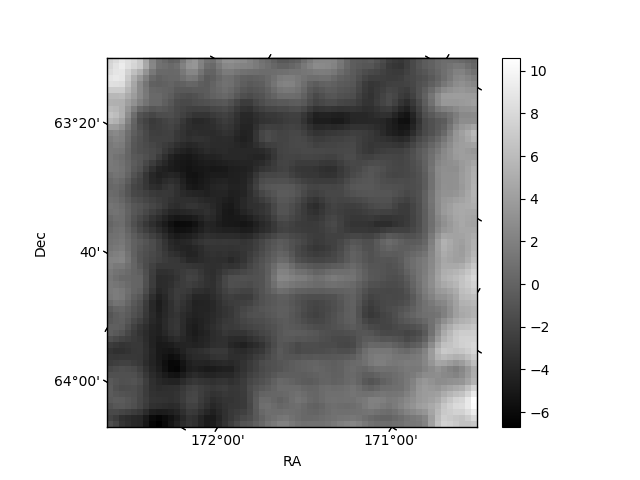
Histogram calculated using DETX and DETY for each event in the final _common_clean file
| Quadrant A | 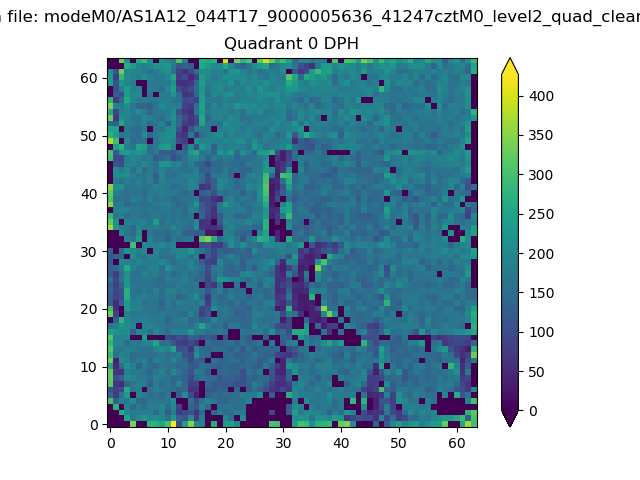 |
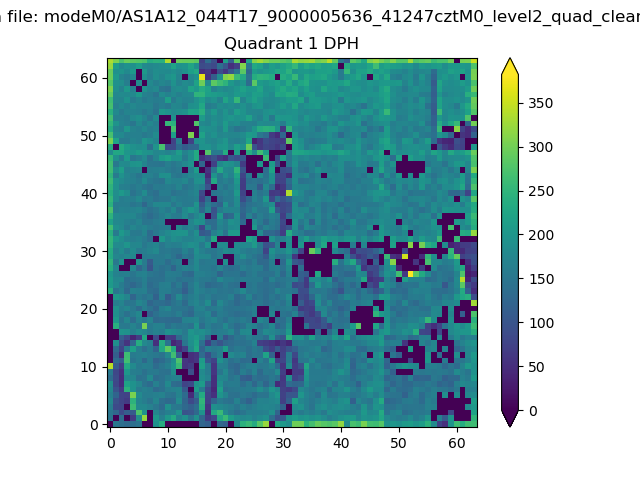 |
Quadrant B |
|---|---|---|---|
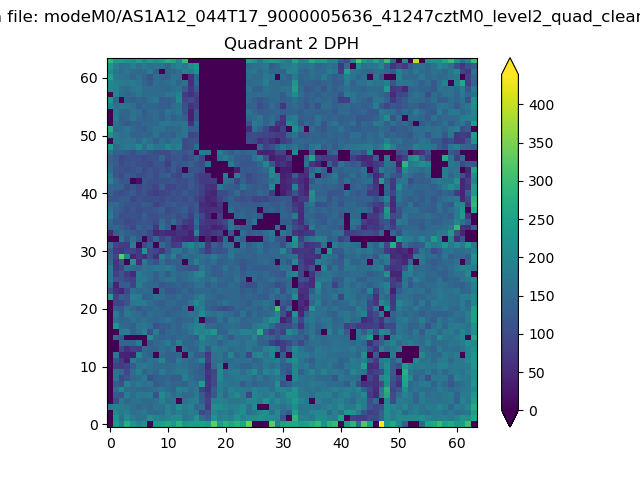
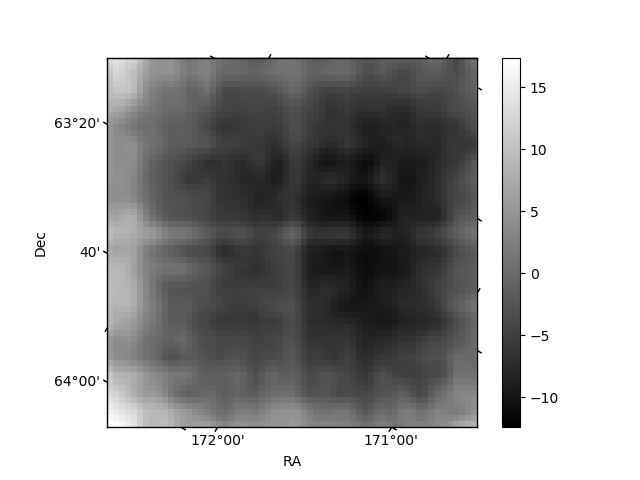
| Quadrant D | 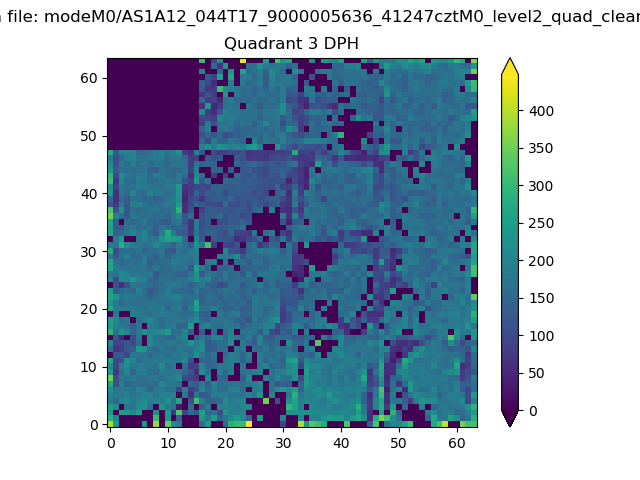 |
 |
Quadrant C |
| Plot type | Count rate plots | Images |
|---|---|---|
| Comparison with Poisson distribution Blue bars denote a histogram of data divided into 1 sec bins. Red curve is a Poisson curve with rate = median count rate of data. |
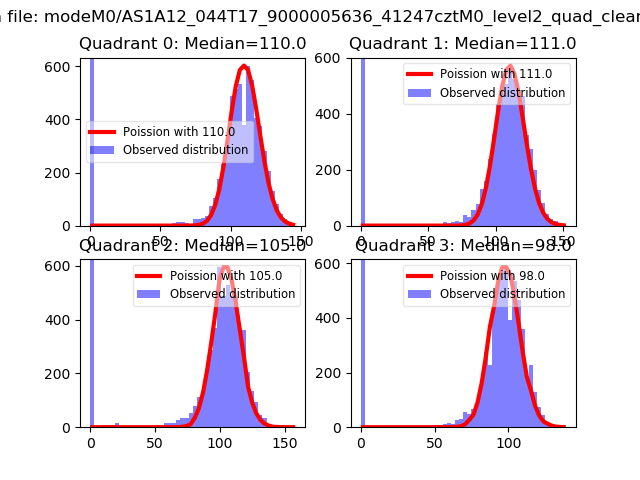 |
 |
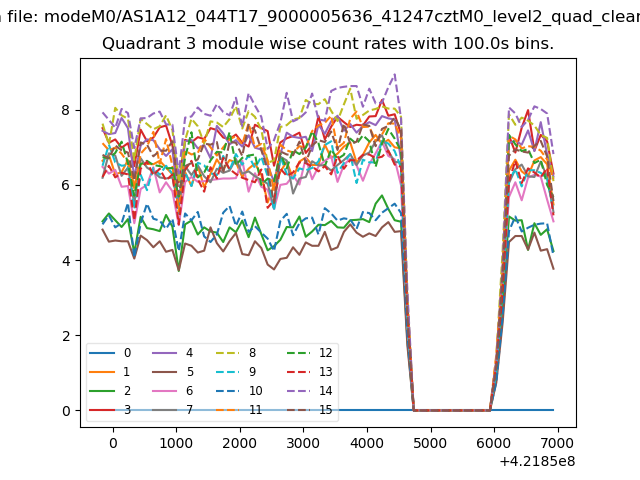
| Quadrant-wise count rates Data is divided into 100 sec bins |
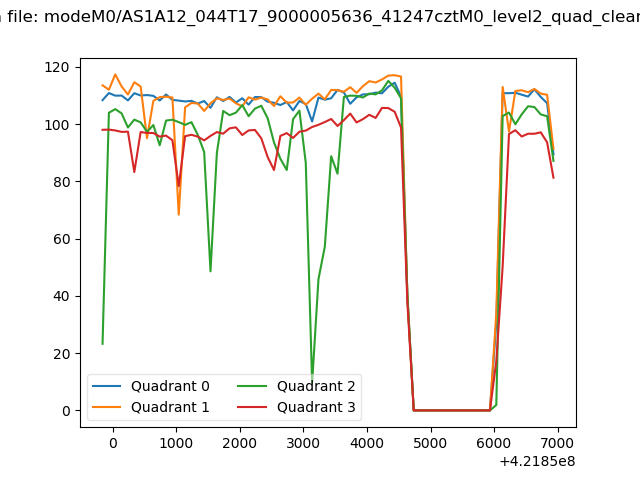 |
|
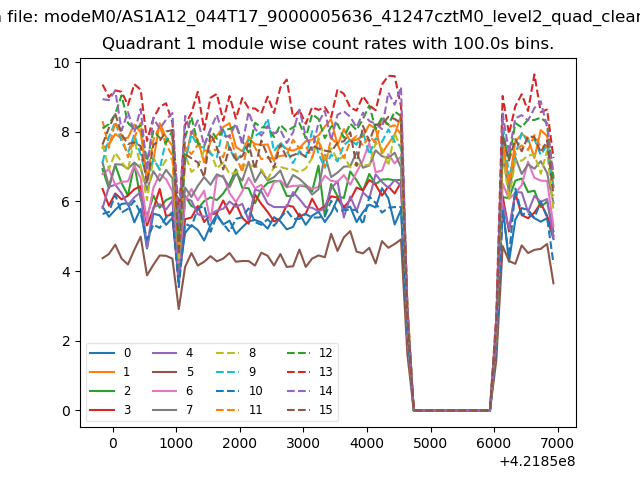
| Module-wise count rates for Quadrant A Data is divided into 100 sec bins |
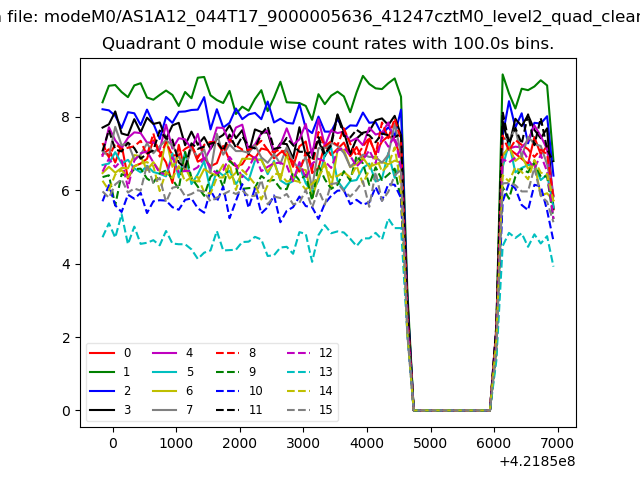 |
 |
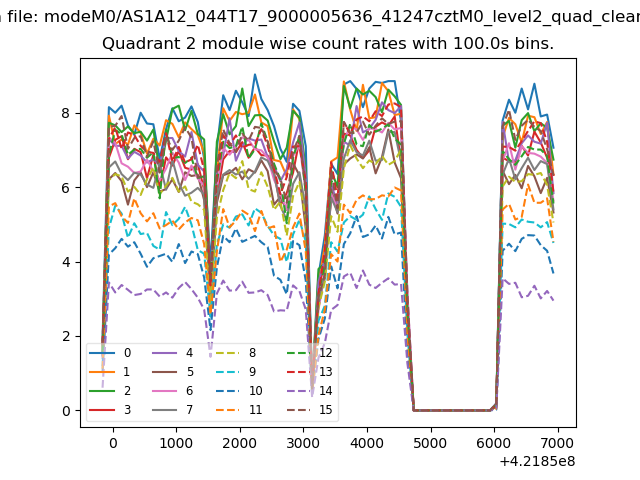
| Module-wise count rates for Quadrant B Data is divided into 100 sec bins |
 |
 |
| Module-wise count rates for Quadrant C Data is divided into 100 sec bins |
 |
 |
| Module-wise count rates for Quadrant D Data is divided into 100 sec bins |
 |
 |
| Parameter | Plot |
|---|---|
| CZT HV Monitor | 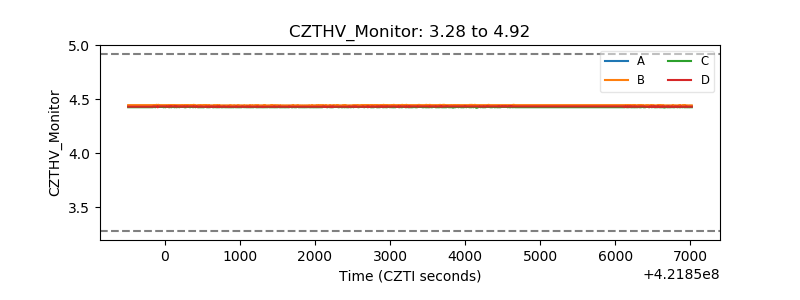 |
| D_VDD | 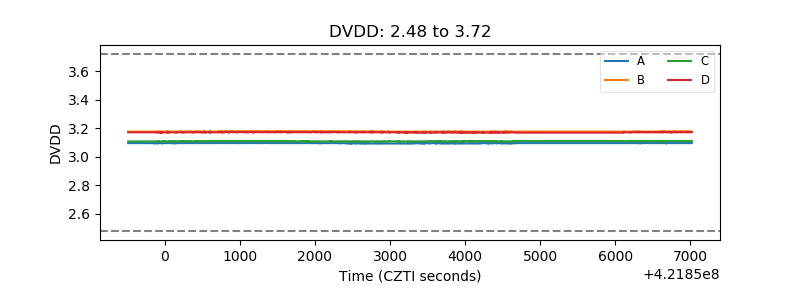 |
| Temperature 1 | 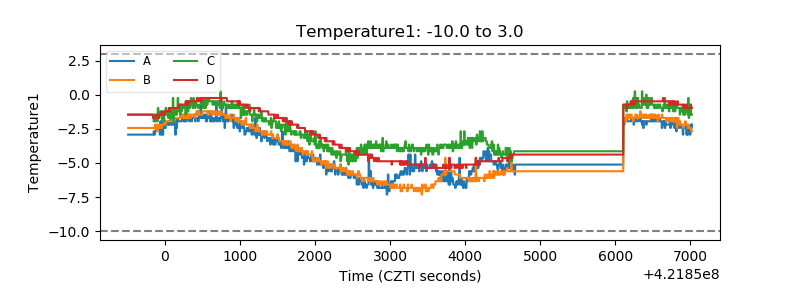 |
| Veto HV Monitor | 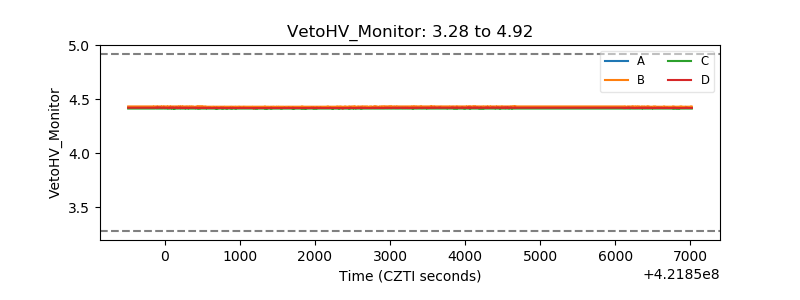 |
| Veto LLD | 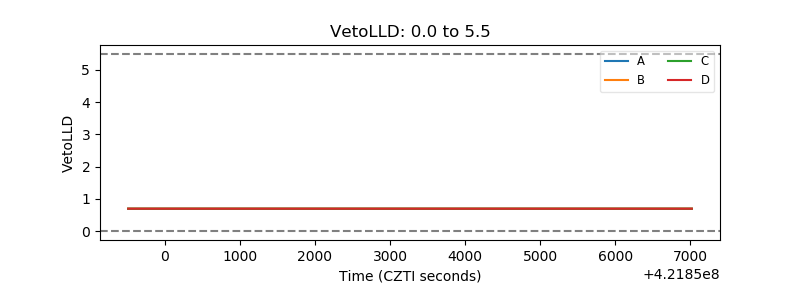 |
| Alpha Counter | 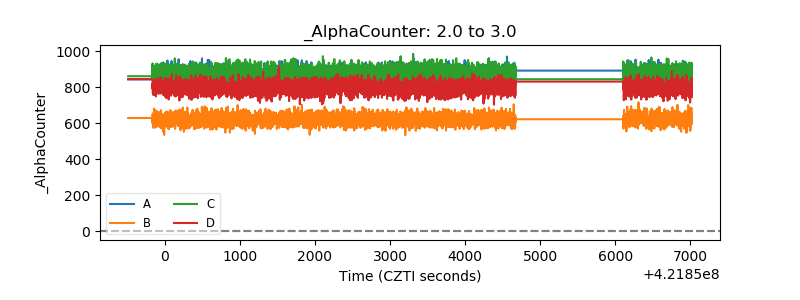 |
| _CPM_Rate | 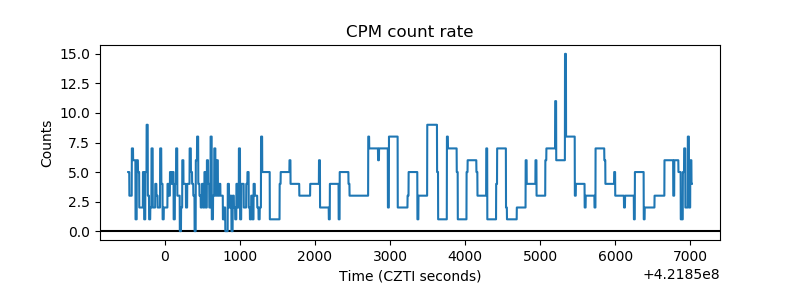 |
| CZT Counter | 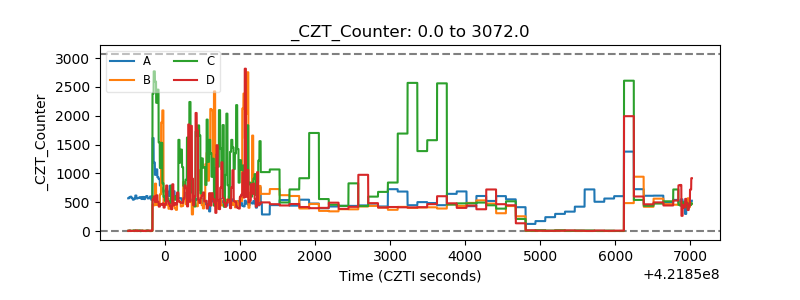 |
| +2.5 Volts monitor | 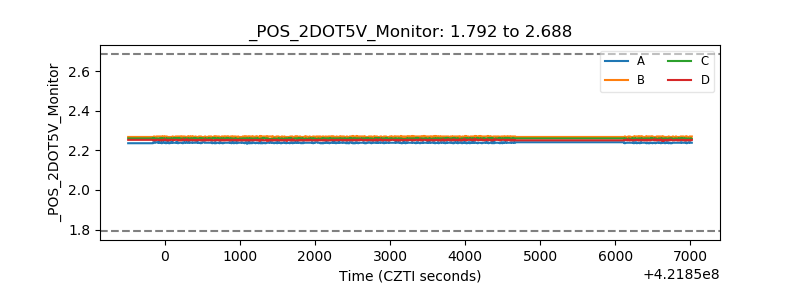 |
| +5 Volts monitor | 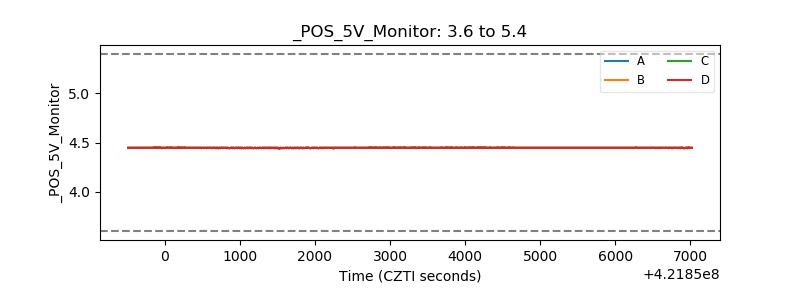 |
| _ROLL_ROT | 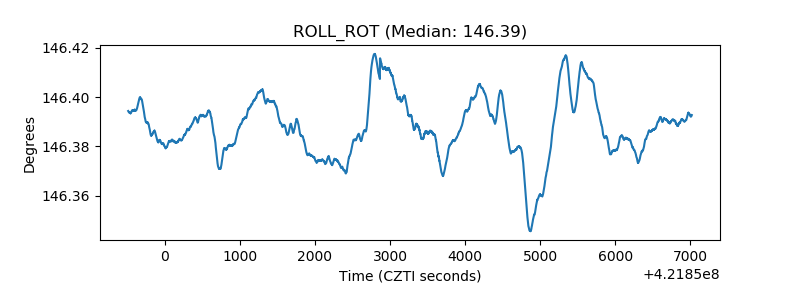 |
| _Roll_DEC | 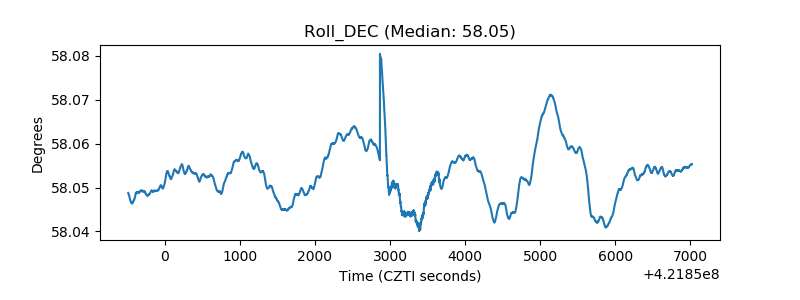 |
| _Roll_RA | 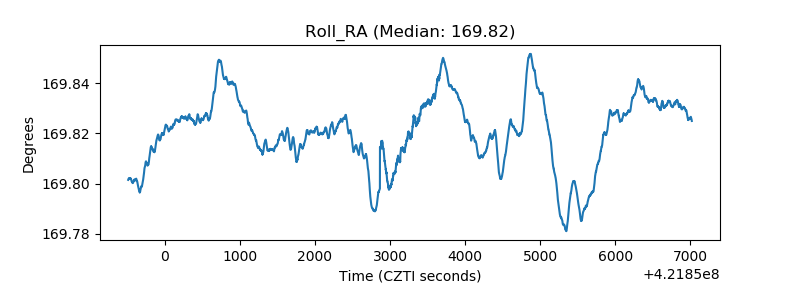 |
| Veto Counter |  |