| Param | Original file | Final file |
|---|---|---|
| Filename | modeM0/AS1A12_044T17_9000005636_41248cztM0_level2.fits | modeM0/AS1A12_044T17_9000005636_41248cztM0_level2_quad_clean.evt |
| Size (bytes) | 388,549,440 | 92,736,000 |
| Size | 370.5 MB | 88.4 MB |
| Events in quadrant A | 3,153,387 | 633,955 |
| Events in quadrant B | 4,066,389 | 603,109 |
| Events in quadrant C | 3,267,162 | 602,861 |
| Events in quadrant D | 3,442,620 | 560,374 |
| Mode SS | |||
|---|---|---|---|
| Quadrant | BADHDUFLAG | Total packets | Discarded packets |
| A | 0 | 120 | 0 |
| B | 0 | 120 | 0 |
| C | 0 | 120 | 0 |
| D | 0 | 120 | 0 |
| Mode M0 | |||
|---|---|---|---|
| Quadrant | BADHDUFLAG | Total packets | Discarded packets |
| A | 0 | 12958 | 3 |
| B | 0 | 16226 | 2 |
| C | 0 | 13413 | 2 |
| D | 0 | 14333 | 2 |
| Mode M9 | |||
|---|---|---|---|
| Quadrant | BADHDUFLAG | Total packets | Discarded packets |
| A | 0 | 15 | 0 |
| B | 0 | 15 | 0 |
| C | 0 | 15 | 0 |
| D | 0 | 16 | 0 |
| Quadrant | Total seconds | Saturated seconds | Saturation percentage |
|---|---|---|---|
| A | 5823 | 23 | 0.394985% |
| B | 5823 | 466 | 8.002748% |
| C | 5823 | 105 | 1.803194% |
| D | 5823 | 169 | 2.902284% |
Noise dominated data is calculated using 1-second bins in cleaned event files. If a bin has >2000 counts, and if more than 50% of those come from <1% of pixels, then it is considered to be noise-dominated and hence unusable.
| Quadrant | # 1 sec bins | Bins with >0 counts | Bins with >2000 counts | High rate bins dominated by noise | Noise dominated (total time) | Noise dominated (detector-on time) | Marked lightcurve |
|---|---|---|---|---|---|---|---|
| A | 7106 | 5824 | 10 | 10 | 0.14% | 0.17% | 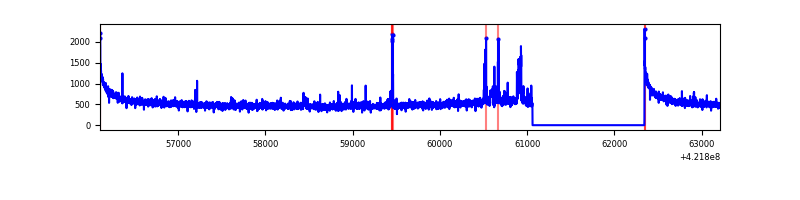 |
| B | 7106 | 5824 | 336 | 336 | 4.73% | 5.77% | 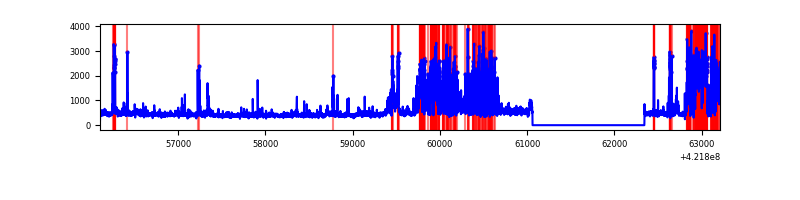 |
| C | 7106 | 5824 | 99 | 99 | 1.39% | 1.70% | 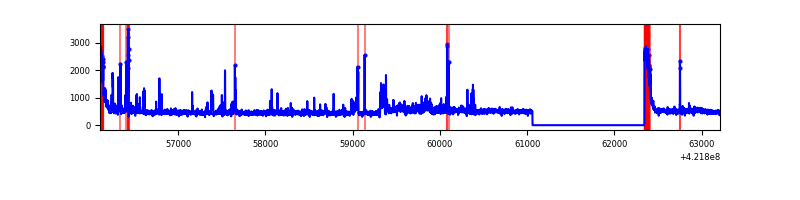 |
| D | 7106 | 5824 | 145 | 145 | 2.04% | 2.49% | 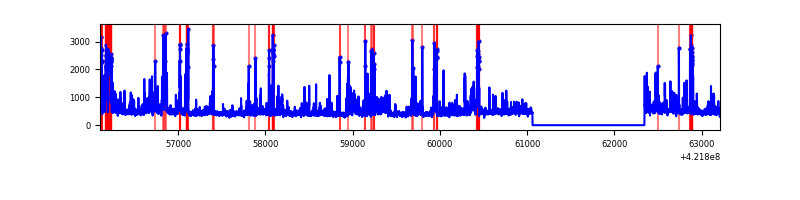 |
Top three noisy pixels from each quadrant. If the there are fewer than three noisy pixels in the level2.evt file, extra rows are filled as -1
| Pixel properties | Quadrant properties | ||||||
|---|---|---|---|---|---|---|---|
| Quadrant | DetID | PixID | Counts | Sigma | Mean | Median | Sigma |
| A | 10 | 83 | 573302 | 4478.43 | 624 | 610 | 127.9 |
| A | 15 | 252 | 78893 | 612.17 | 624 | 610 | 127.9 |
| A | 0 | 8 | 41313 | 318.3 | 624 | 610 | 127.9 |
| B | 0 | 229 | 984966 | 8422.45 | 606 | 589 | 116.9 |
| B | 0 | 186 | 636891 | 5444.28 | 606 | 589 | 116.9 |
| B | 15 | 85 | 29592 | 248.15 | 606 | 589 | 116.9 |
| C | 9 | 54 | 296388 | 2089.87 | 603 | 605 | 141.5 |
| C | 0 | 10 | 255820 | 1803.24 | 603 | 605 | 141.5 |
| C | 15 | 214 | 245332 | 1729.13 | 603 | 605 | 141.5 |
| D | 2 | 249 | 362595 | 2496.96 | 601 | 583 | 145.0 |
| D | 5 | 222 | 353909 | 2437.05 | 601 | 583 | 145.0 |
| D | 13 | 249 | 271837 | 1870.96 | 601 | 583 | 145.0 |
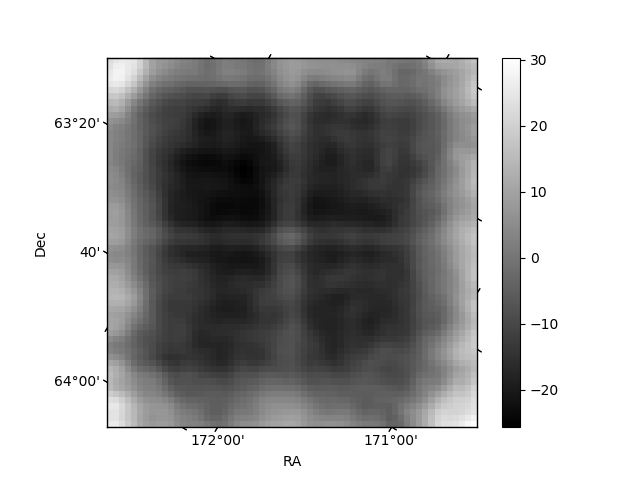
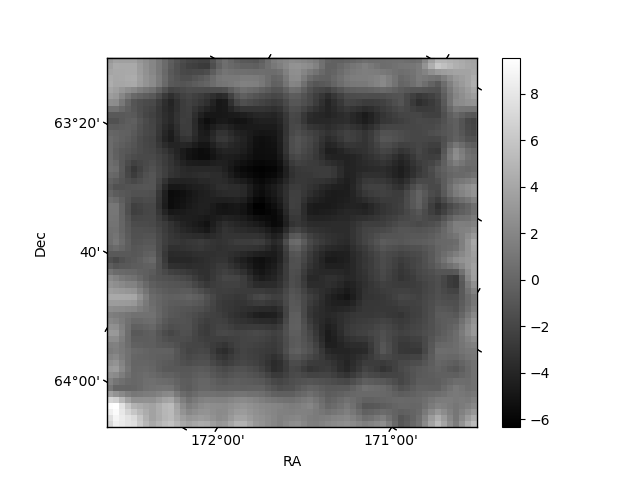
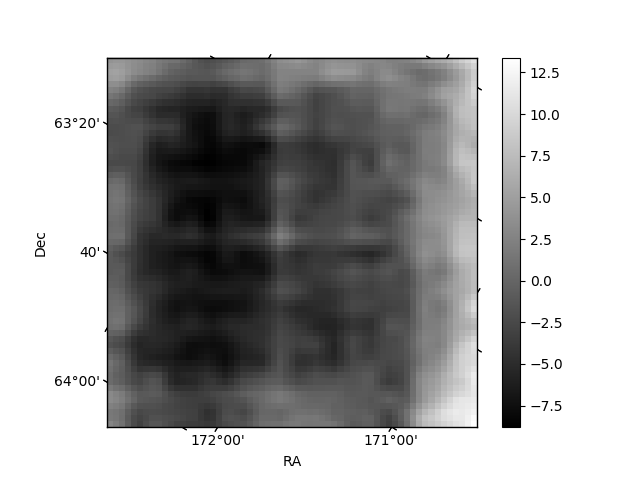
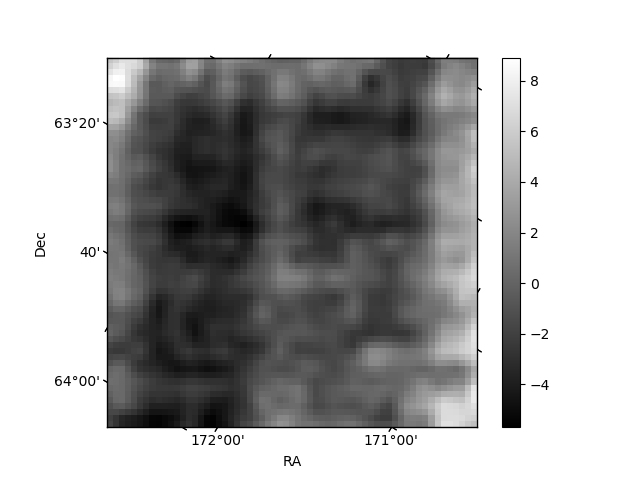
Histogram calculated using DETX and DETY for each event in the final _common_clean file
| Quadrant A | 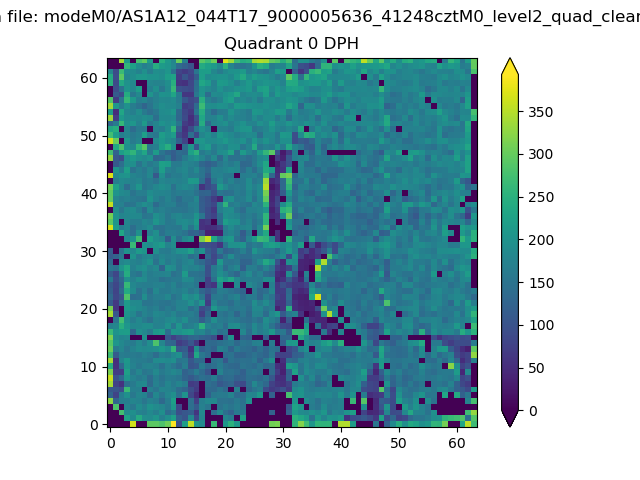 |
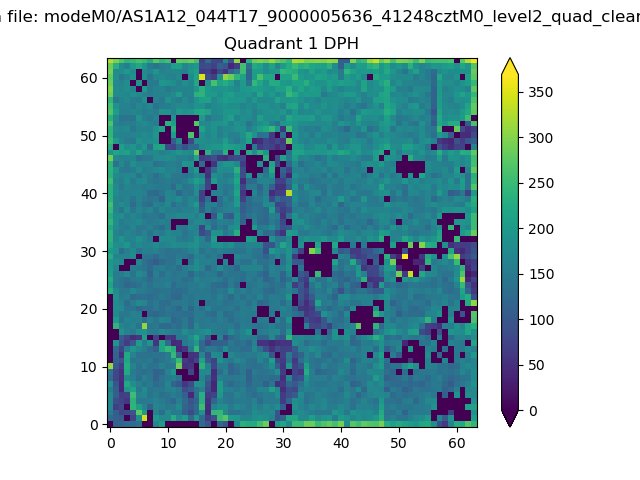 |
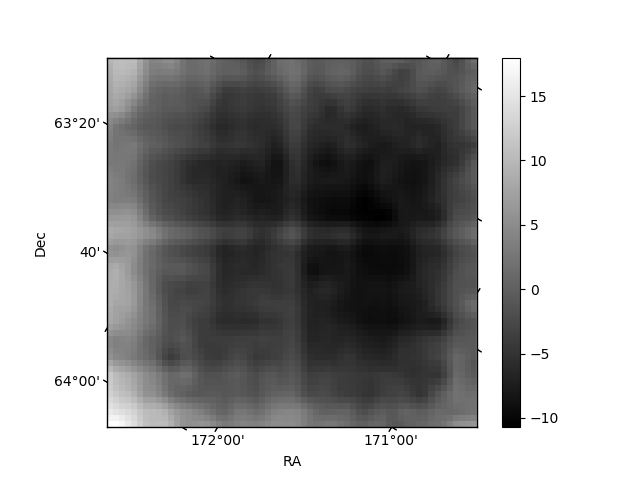
Quadrant B |
|---|---|---|---|
| Quadrant D | 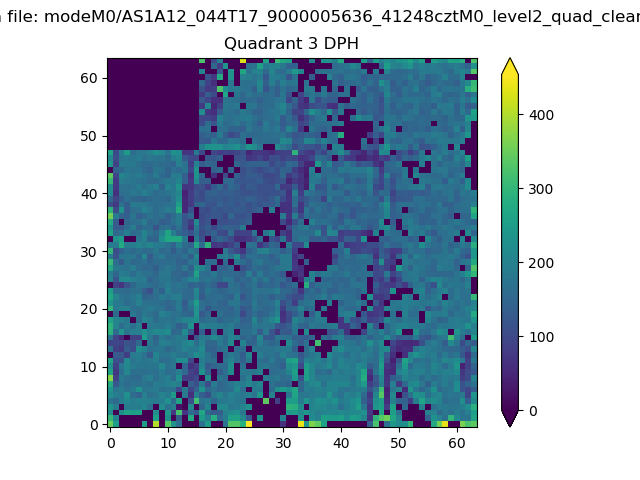 |
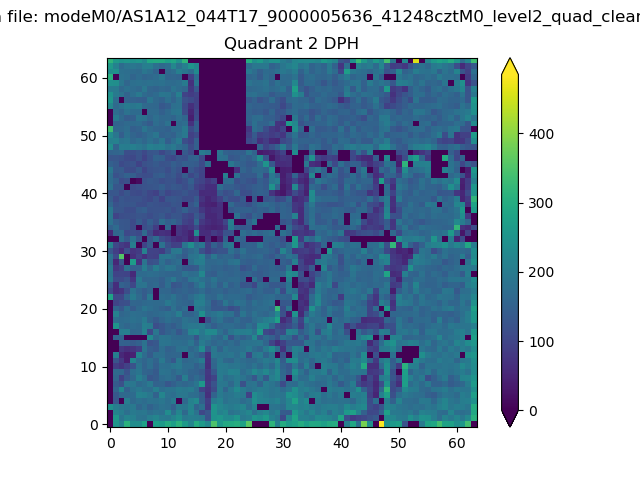 |
Quadrant C |
| Plot type | Count rate plots | Images |
|---|---|---|
| Comparison with Poisson distribution Blue bars denote a histogram of data divided into 1 sec bins. Red curve is a Poisson curve with rate = median count rate of data. |
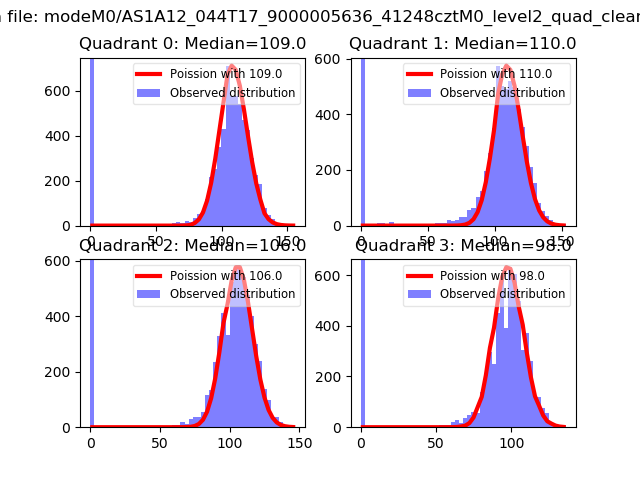 |
 |
| Quadrant-wise count rates Data is divided into 100 sec bins |
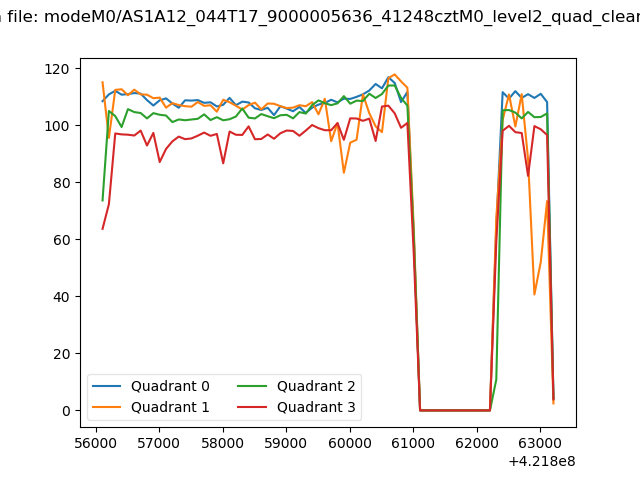 |
|
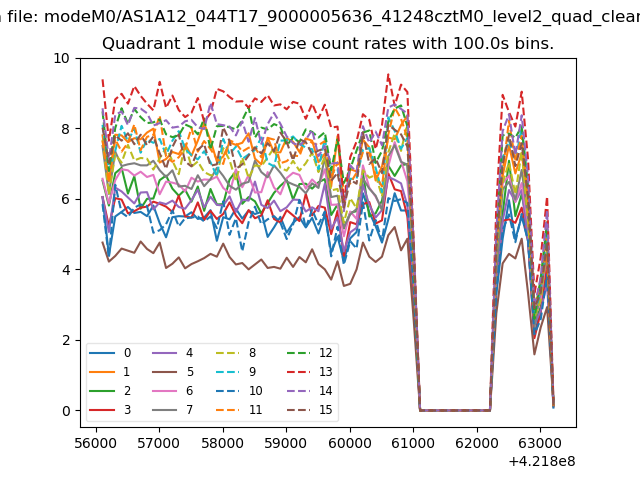
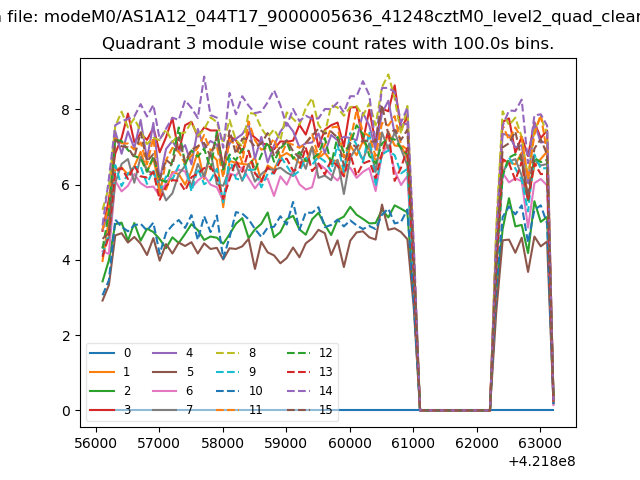
| Module-wise count rates for Quadrant A Data is divided into 100 sec bins |
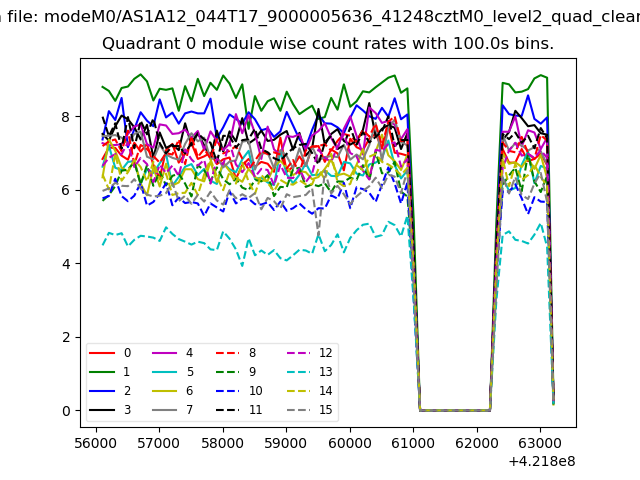 |
 |
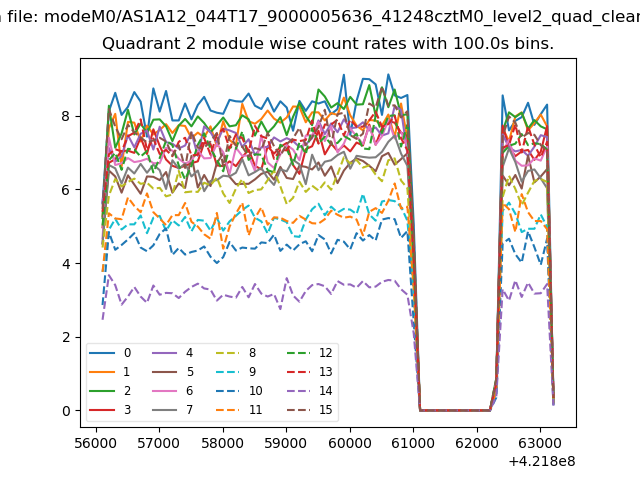
| Module-wise count rates for Quadrant B Data is divided into 100 sec bins |
 |
 |
| Module-wise count rates for Quadrant C Data is divided into 100 sec bins |
 |
 |
| Module-wise count rates for Quadrant D Data is divided into 100 sec bins |
 |
 |
| Parameter | Plot |
|---|---|
| CZT HV Monitor | 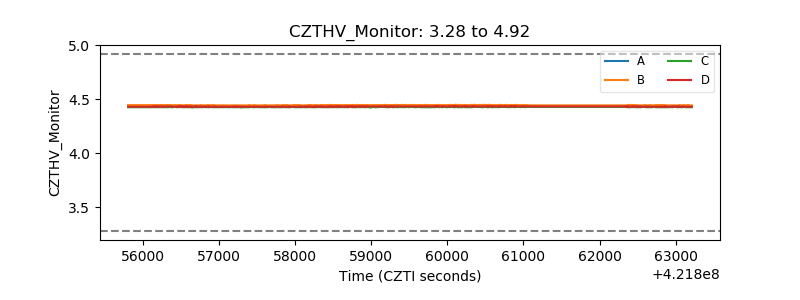 |
| D_VDD | 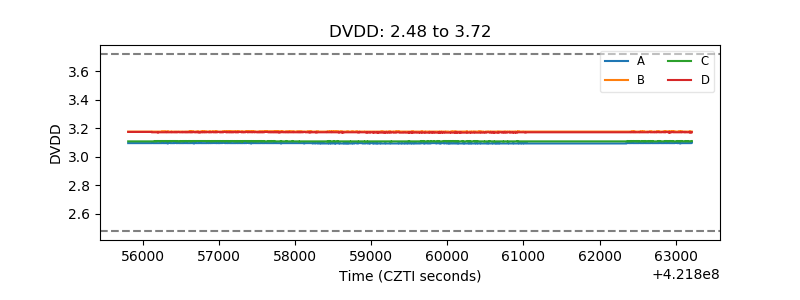 |
| Temperature 1 | 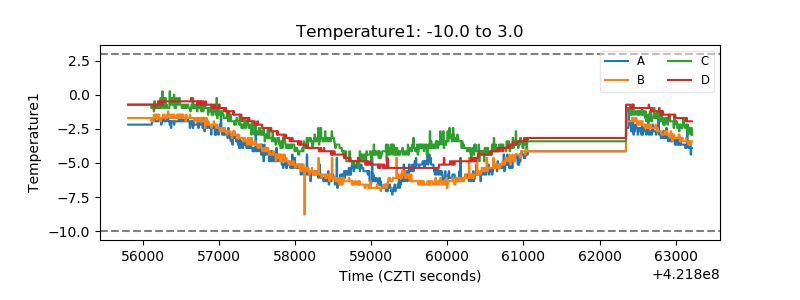 |
| Veto HV Monitor | 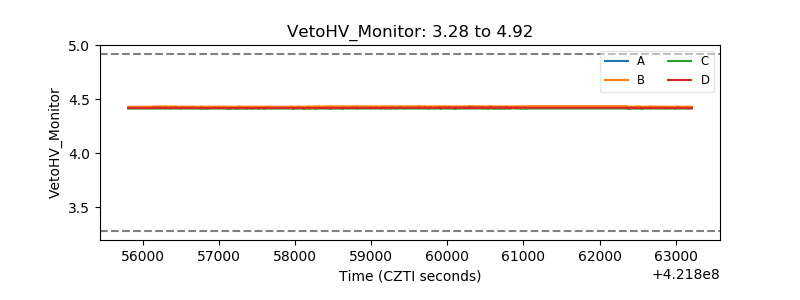 |
| Veto LLD | 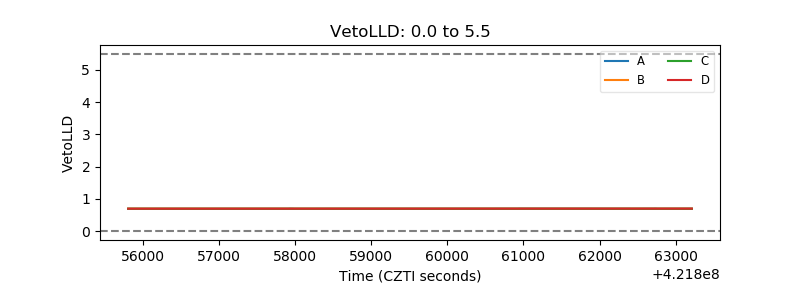 |
| Alpha Counter | 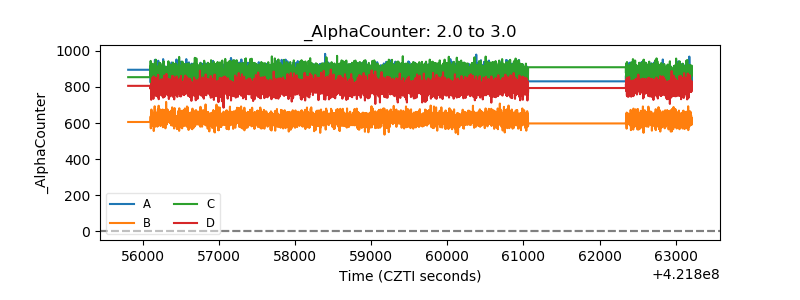 |
| _CPM_Rate | 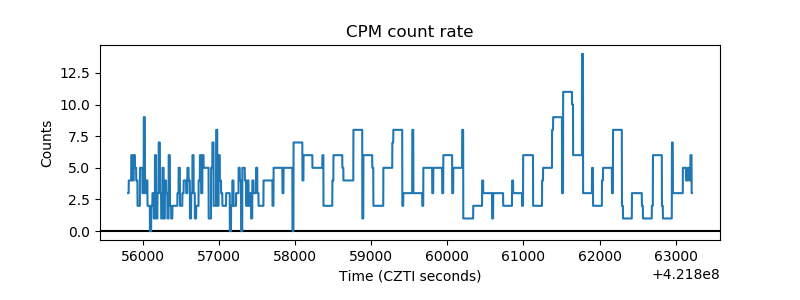 |
| CZT Counter | 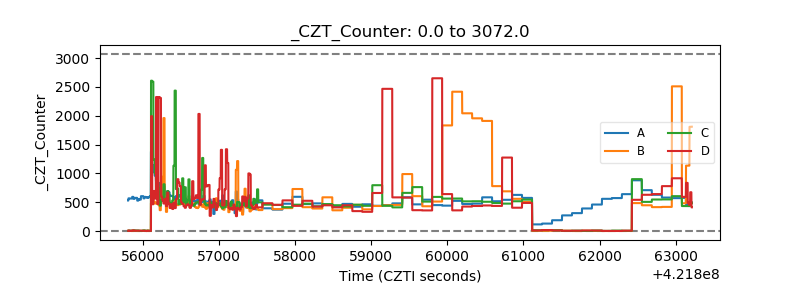 |
| +2.5 Volts monitor | 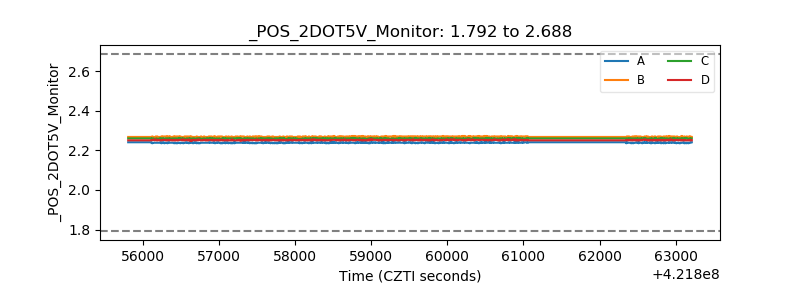 |
| +5 Volts monitor | 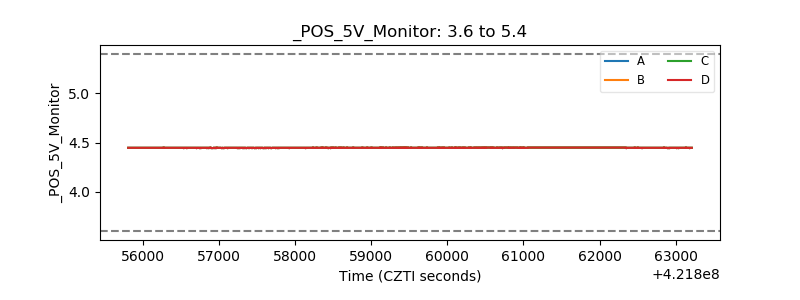 |
| _ROLL_ROT | 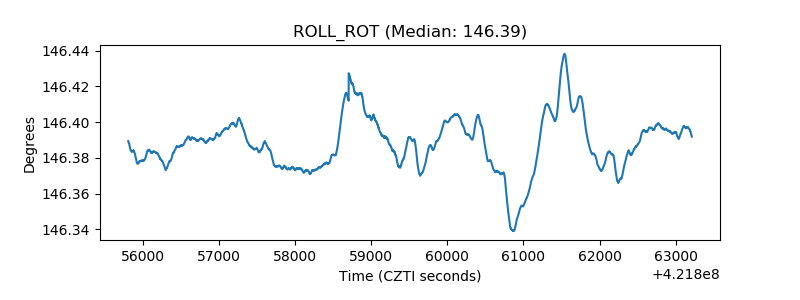 |
| _Roll_DEC |  |
| _Roll_RA | 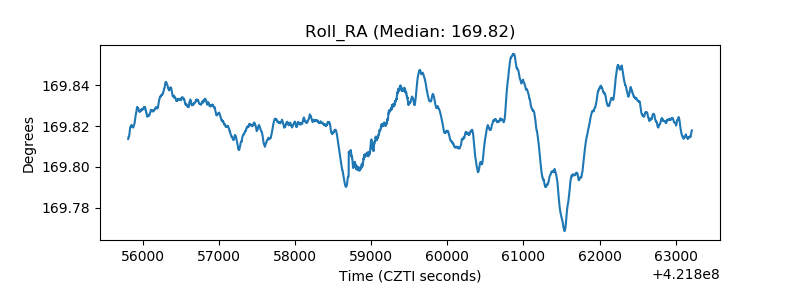 |
| Veto Counter | 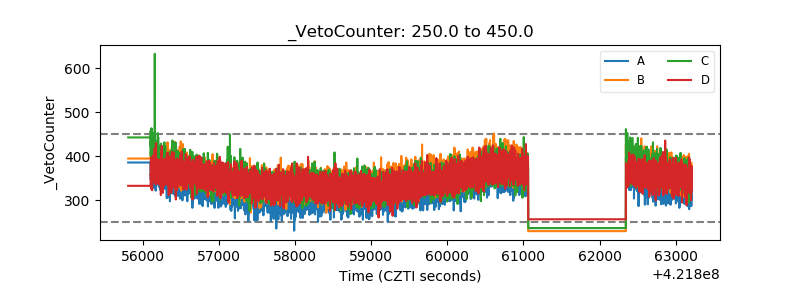 |