| Param | Original file | Final file |
|---|---|---|
| Filename | modeM0/AS1A12_044T17_9000005636_41251cztM0_level2.fits | modeM0/AS1A12_044T17_9000005636_41251cztM0_level2_quad_clean.evt |
| Size (bytes) | 480,044,160 | 106,237,440 |
| Size | 457.8 MB | 101.3 MB |
| Events in quadrant A | 3,737,446 | 717,040 |
| Events in quadrant B | 3,693,949 | 710,610 |
| Events in quadrant C | 5,928,064 | 674,029 |
| Events in quadrant D | 3,887,220 | 645,547 |
| Mode SS | |||
|---|---|---|---|
| Quadrant | BADHDUFLAG | Total packets | Discarded packets |
| A | 0 | 136 | 0 |
| B | 0 | 136 | 0 |
| C | 0 | 136 | 0 |
| D | 0 | 136 | 0 |
| Mode M0 | |||
|---|---|---|---|
| Quadrant | BADHDUFLAG | Total packets | Discarded packets |
| A | 0 | 15439 | 2 |
| B | 0 | 16031 | 2 |
| C | 0 | 22117 | 2 |
| D | 0 | 16378 | 2 |
| Mode M9 | |||
|---|---|---|---|
| Quadrant | BADHDUFLAG | Total packets | Discarded packets |
| A | 0 | 14 | 0 |
| B | 0 | 14 | 0 |
| C | 0 | 14 | 0 |
| D | 0 | 15 | 0 |
| Quadrant | Total seconds | Saturated seconds | Saturation percentage |
|---|---|---|---|
| A | 6737 | 74 | 1.098412% |
| B | 6737 | 237 | 3.517886% |
| C | 6737 | 387 | 5.744397% |
| D | 6737 | 151 | 2.241354% |
Noise dominated data is calculated using 1-second bins in cleaned event files. If a bin has >2000 counts, and if more than 50% of those come from <1% of pixels, then it is considered to be noise-dominated and hence unusable.
| Quadrant | # 1 sec bins | Bins with >0 counts | Bins with >2000 counts | High rate bins dominated by noise | Noise dominated (total time) | Noise dominated (detector-on time) | Marked lightcurve |
|---|---|---|---|---|---|---|---|
| A | 8019 | 6738 | 55 | 55 | 0.69% | 0.82% | 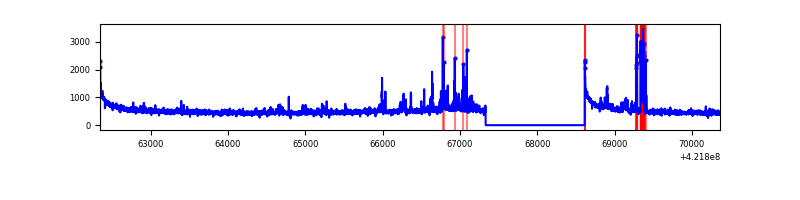 |
| B | 8019 | 6738 | 183 | 183 | 2.28% | 2.72% | 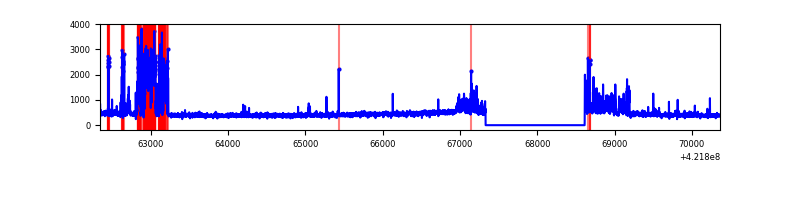 |
| C | 8019 | 6738 | 372 | 372 | 4.64% | 5.52% | 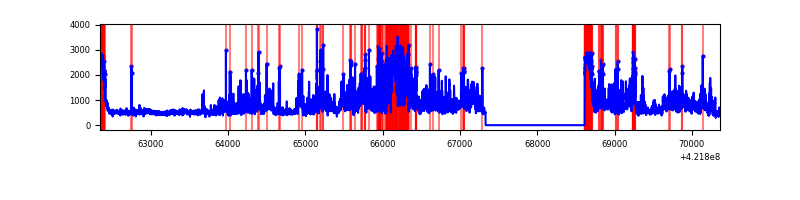 |
| D | 8019 | 6738 | 140 | 140 | 1.75% | 2.08% | 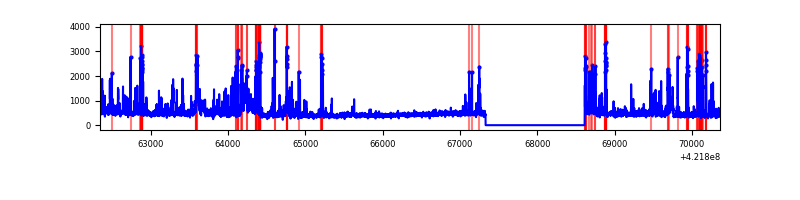 |
Top three noisy pixels from each quadrant. If the there are fewer than three noisy pixels in the level2.evt file, extra rows are filled as -1
| Pixel properties | Quadrant properties | ||||||
|---|---|---|---|---|---|---|---|
| Quadrant | DetID | PixID | Counts | Sigma | Mean | Median | Sigma |
| A | 10 | 83 | 620727 | 4268.14 | 708 | 691 | 145.3 |
| A | 0 | 8 | 167400 | 1147.57 | 708 | 691 | 145.3 |
| A | 6 | 10 | 131208 | 898.44 | 708 | 691 | 145.3 |
| B | 0 | 186 | 742593 | 5428.02 | 701 | 683 | 136.7 |
| B | 0 | 229 | 133095 | 968.76 | 701 | 683 | 136.7 |
| B | 5 | 255 | 37930 | 272.51 | 701 | 683 | 136.7 |
| C | 9 | 54 | 2294996 | 14229.24 | 683 | 686 | 161.2 |
| C | 0 | 10 | 362391 | 2243.28 | 683 | 686 | 161.2 |
| C | 15 | 214 | 279153 | 1727.04 | 683 | 686 | 161.2 |
| D | 13 | 249 | 517216 | 3088.9 | 693 | 674 | 167.2 |
| D | 5 | 222 | 231545 | 1380.6 | 693 | 674 | 167.2 |
| D | 2 | 249 | 225243 | 1342.91 | 693 | 674 | 167.2 |
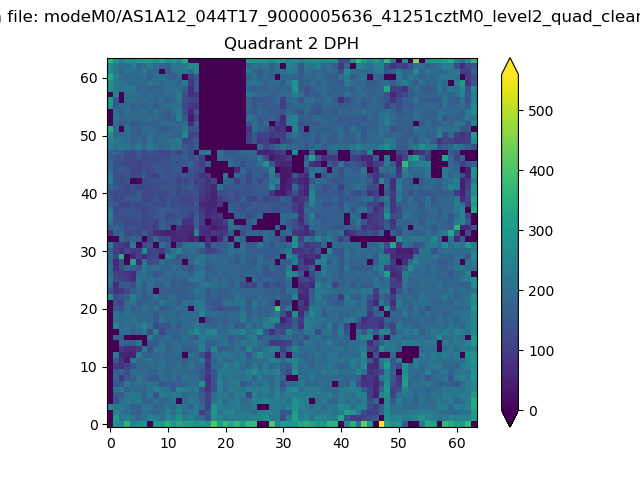
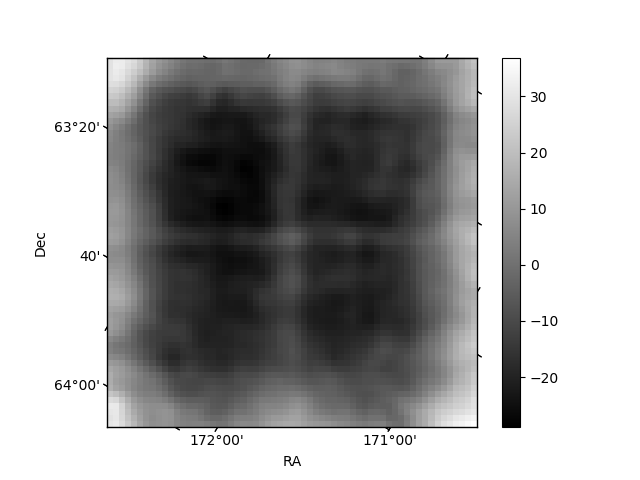
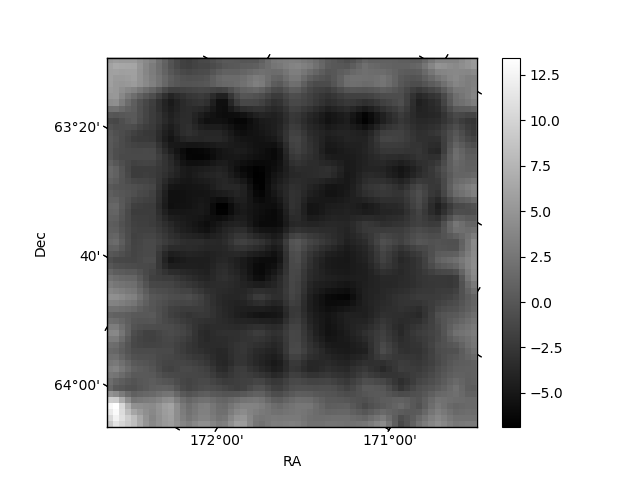
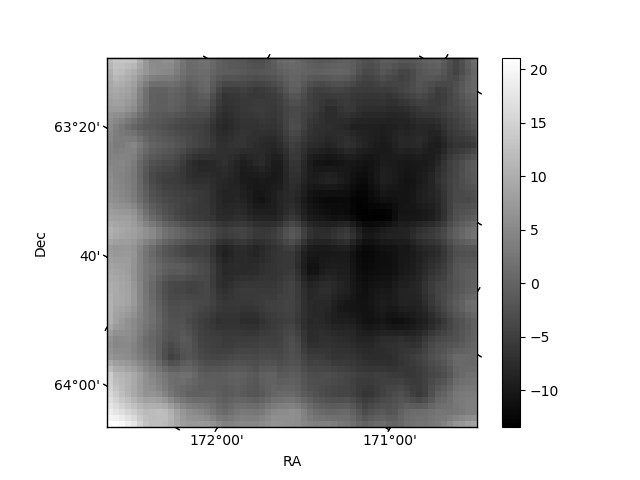
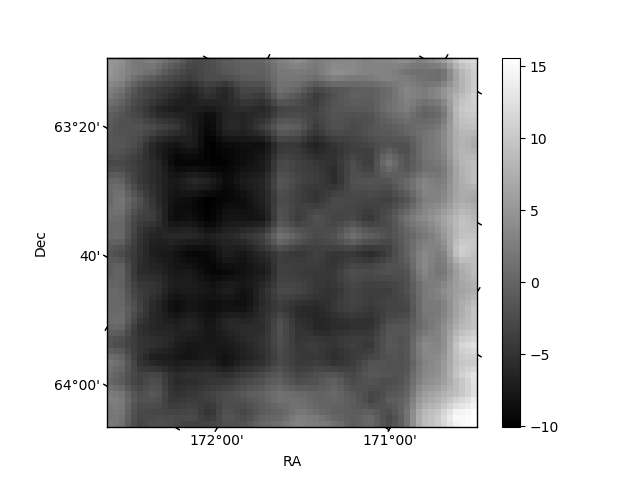
Histogram calculated using DETX and DETY for each event in the final _common_clean file
| Quadrant A | 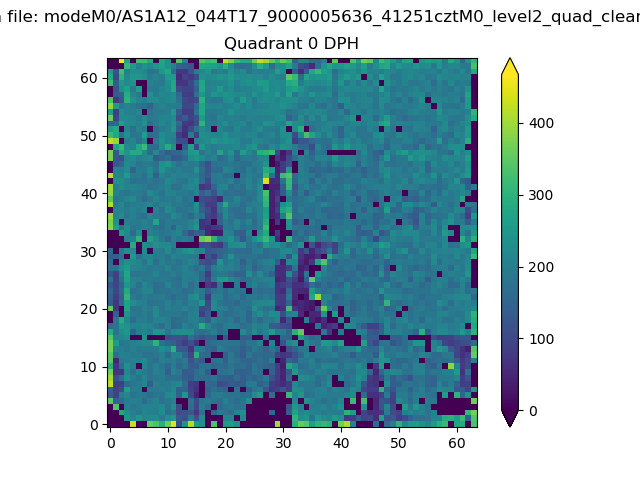 |
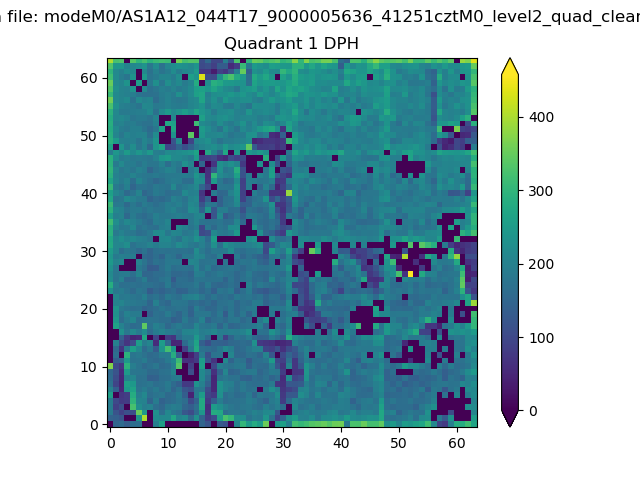 |
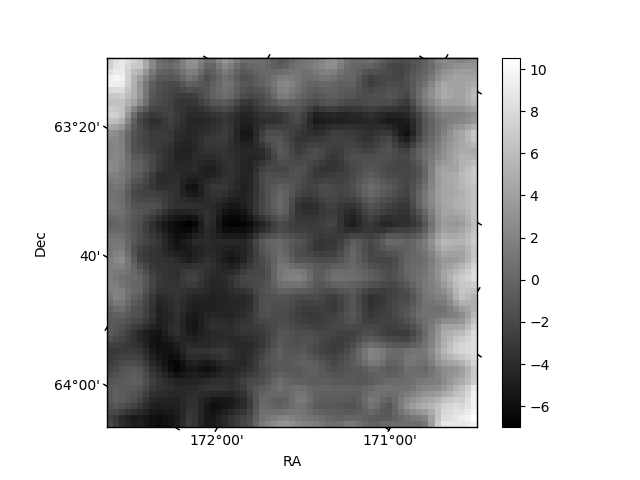
Quadrant B |
|---|---|---|---|
| Quadrant D | 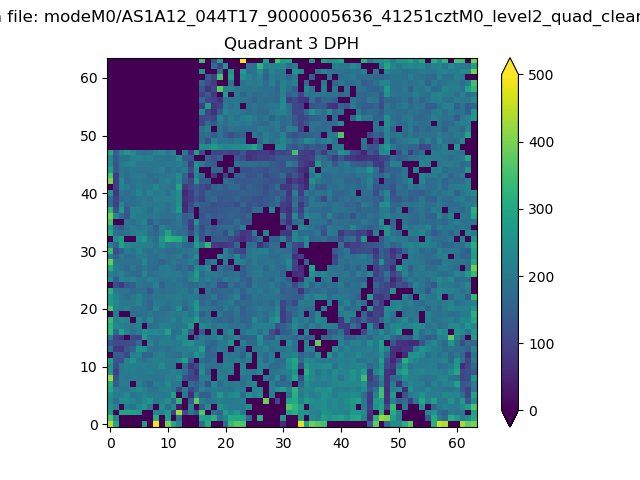 |
 |
Quadrant C |
| Plot type | Count rate plots | Images |
|---|---|---|
| Comparison with Poisson distribution Blue bars denote a histogram of data divided into 1 sec bins. Red curve is a Poisson curve with rate = median count rate of data. |
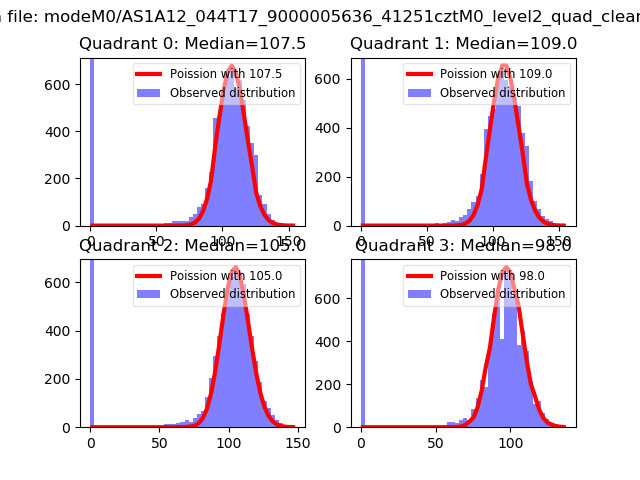 |
 |
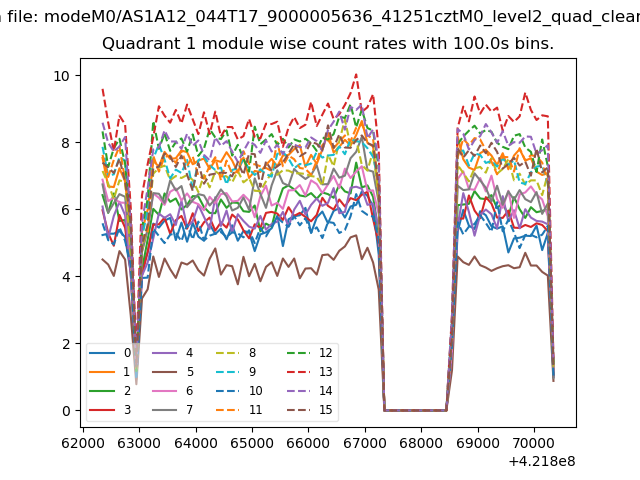
| Quadrant-wise count rates Data is divided into 100 sec bins |
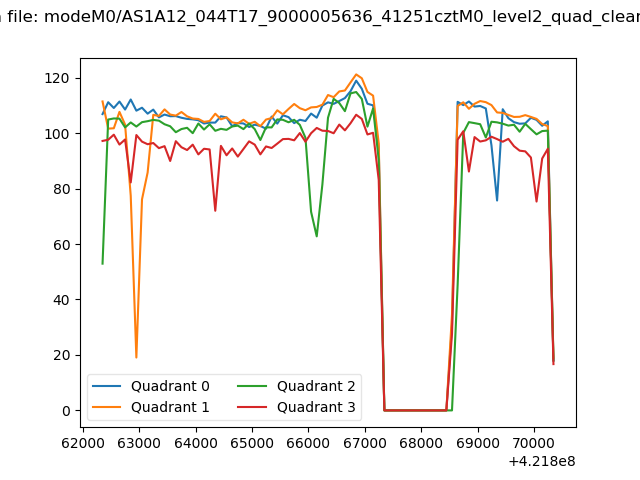 |
|
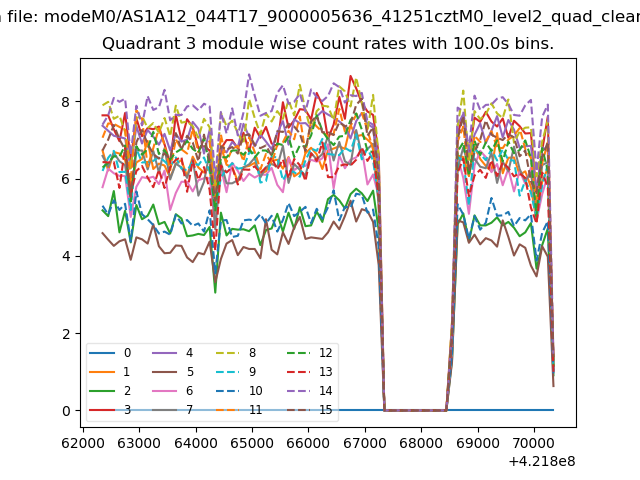
| Module-wise count rates for Quadrant A Data is divided into 100 sec bins |
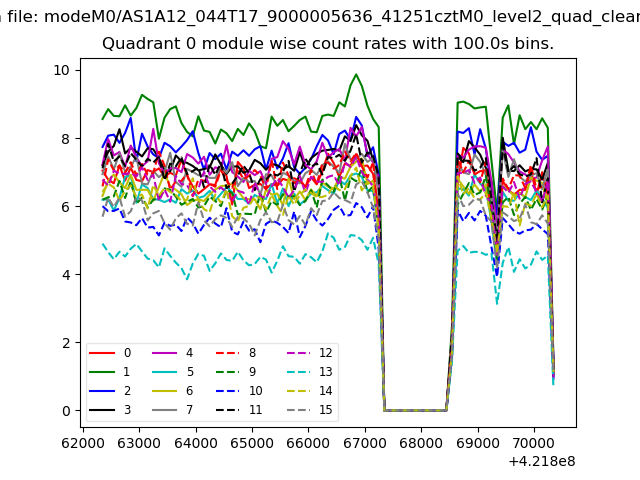 |
 |
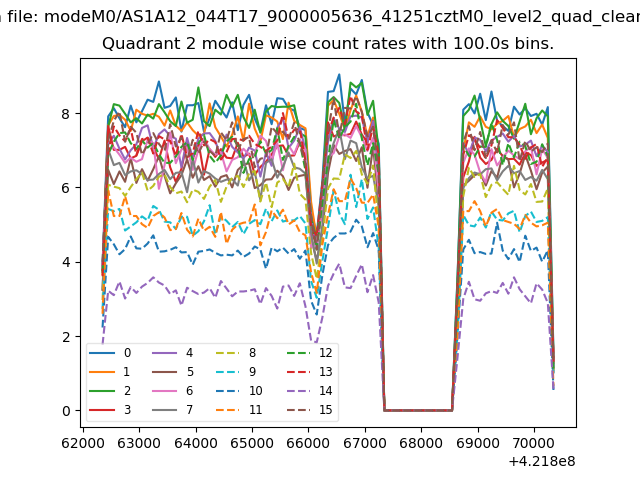
| Module-wise count rates for Quadrant B Data is divided into 100 sec bins |
 |
 |
| Module-wise count rates for Quadrant C Data is divided into 100 sec bins |
 |
 |
| Module-wise count rates for Quadrant D Data is divided into 100 sec bins |
 |
 |
| Parameter | Plot |
|---|---|
| CZT HV Monitor | 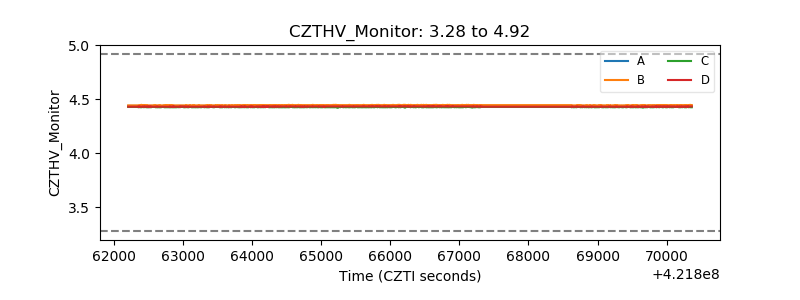 |
| D_VDD | 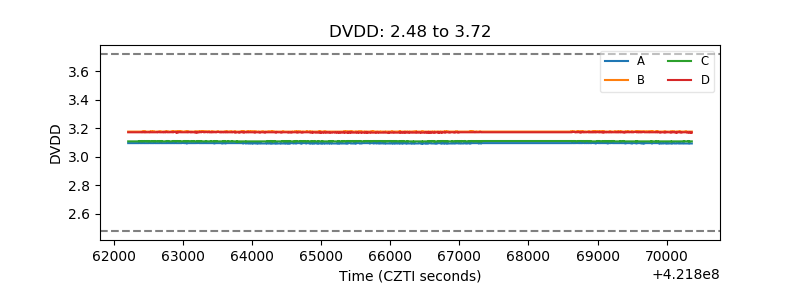 |
| Temperature 1 |  |
| Veto HV Monitor | 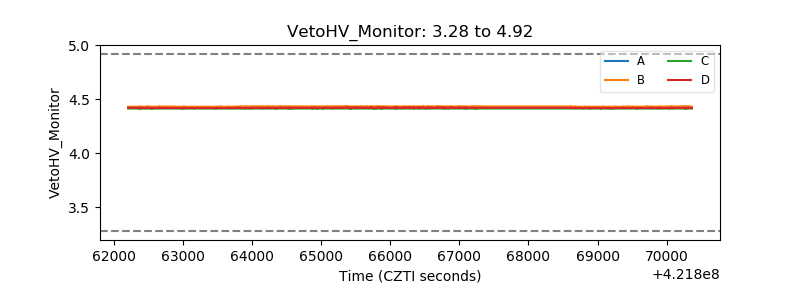 |
| Veto LLD | 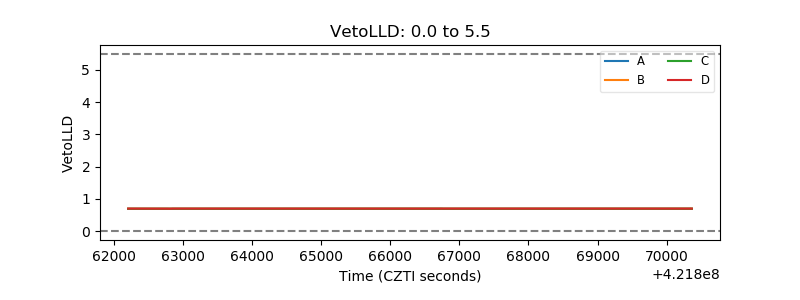 |
| Alpha Counter | 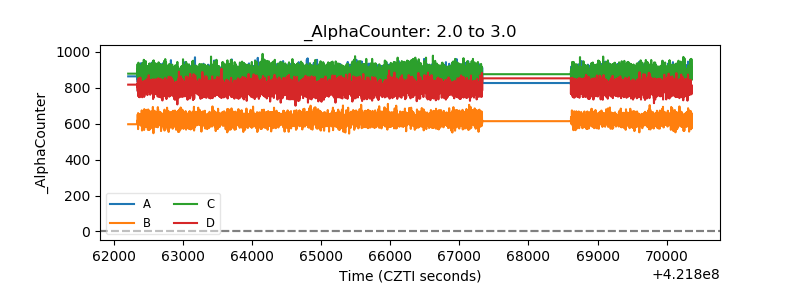 |
| _CPM_Rate | 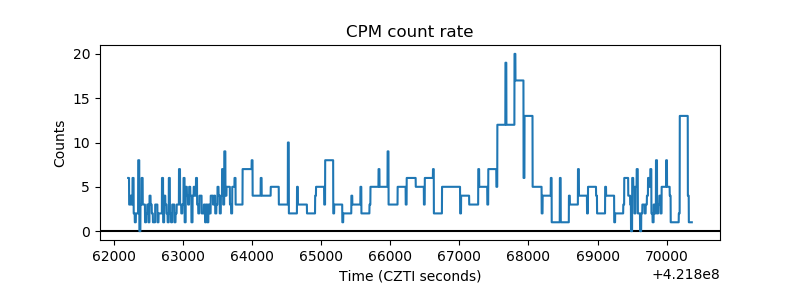 |
| CZT Counter | 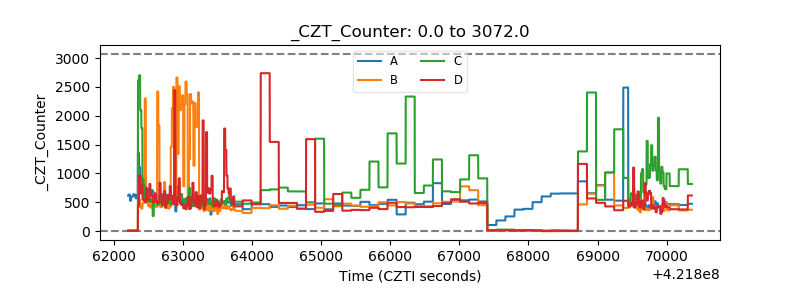 |
| +2.5 Volts monitor | 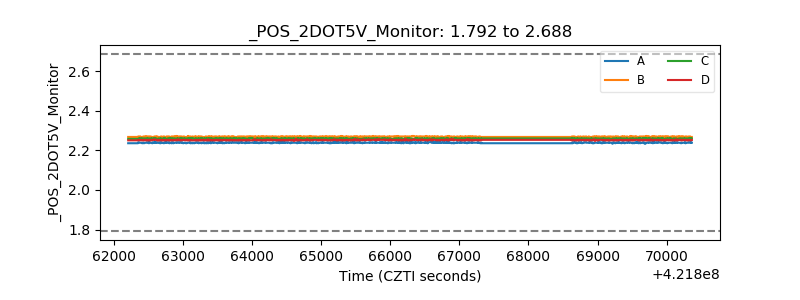 |
| +5 Volts monitor | 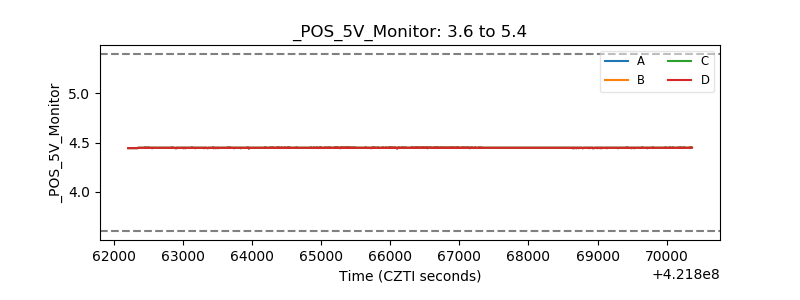 |
| _ROLL_ROT |  |
| _Roll_DEC | 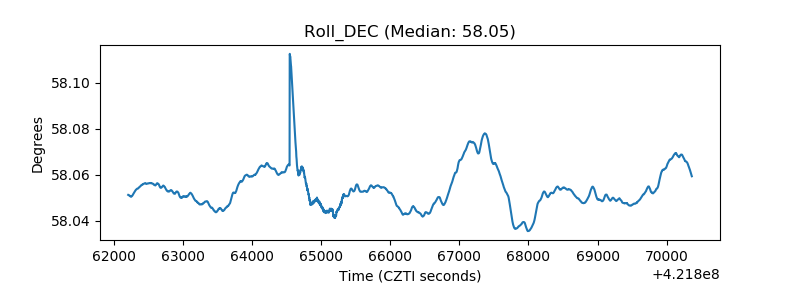 |
| _Roll_RA | 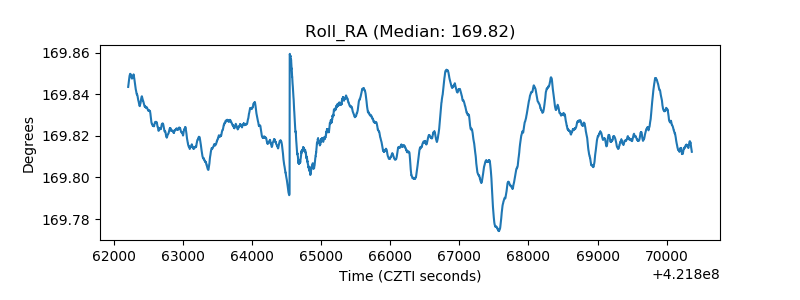 |
| Veto Counter | 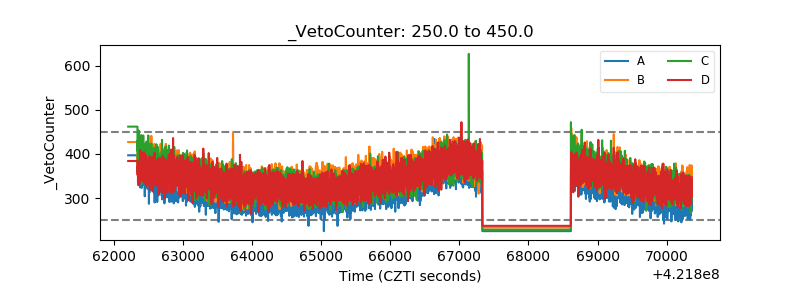 |