| Param | Original file | Final file |
|---|---|---|
| Filename | modeM0/AS1A12_052T04_9000005638_41251cztM0_level2.fits | modeM0/AS1A12_052T04_9000005638_41251cztM0_level2_quad_clean.evt |
| Size (bytes) | 460,221,120 | 121,296,960 |
| Size | 438.9 MB | 115.7 MB |
| Events in quadrant A | 4,411,347 | 811,269 |
| Events in quadrant B | 3,317,794 | 834,063 |
| Events in quadrant C | 4,203,034 | 785,327 |
| Events in quadrant D | 4,522,927 | 721,594 |
| Mode M9 | |||
|---|---|---|---|
| Quadrant | BADHDUFLAG | Total packets | Discarded packets |
| A | 0 | 28 | 0 |
| B | 0 | 28 | 0 |
| C | 0 | 28 | 0 |
| D | 0 | 28 | 0 |
| Mode SS | |||
|---|---|---|---|
| Quadrant | BADHDUFLAG | Total packets | Discarded packets |
| A | 0 | 156 | 0 |
| B | 0 | 156 | 0 |
| C | 0 | 156 | 0 |
| D | 0 | 156 | 0 |
| Mode M0 | |||
|---|---|---|---|
| Quadrant | BADHDUFLAG | Total packets | Discarded packets |
| A | 0 | 17579 | 3 |
| B | 0 | 15221 | 2 |
| C | 0 | 17086 | 2 |
| D | 0 | 18752 | 2 |
| Quadrant | Total seconds | Saturated seconds | Saturation percentage |
|---|---|---|---|
| A | 7471 | 89 | 1.191273% |
| B | 7471 | 15 | 0.200776% |
| C | 7471 | 147 | 1.967608% |
| D | 7471 | 270 | 3.613974% |
Noise dominated data is calculated using 1-second bins in cleaned event files. If a bin has >2000 counts, and if more than 50% of those come from <1% of pixels, then it is considered to be noise-dominated and hence unusable.
| Quadrant | # 1 sec bins | Bins with >0 counts | Bins with >2000 counts | High rate bins dominated by noise | Noise dominated (total time) | Noise dominated (detector-on time) | Marked lightcurve |
|---|---|---|---|---|---|---|---|
| A | 10338 | 7473 | 72 | 72 | 0.70% | 0.96% | 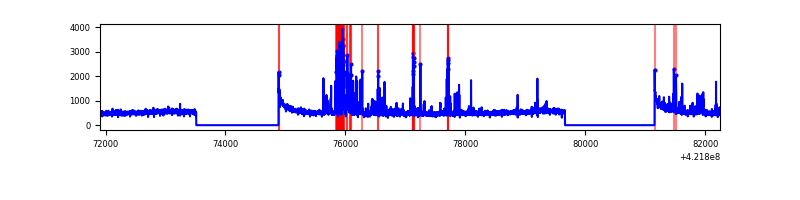 |
| B | 10338 | 7473 | 0 | 0 | 0.00% | 0.00% | 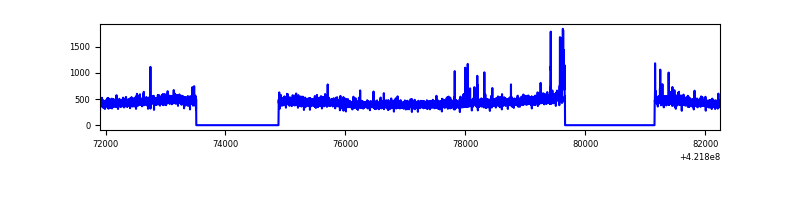 |
| C | 10338 | 7473 | 134 | 134 | 1.30% | 1.79% | 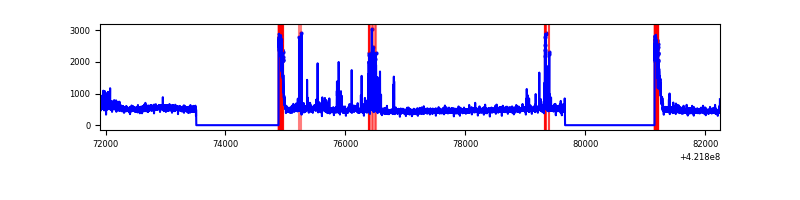 |
| D | 10338 | 7473 | 254 | 254 | 2.46% | 3.40% | 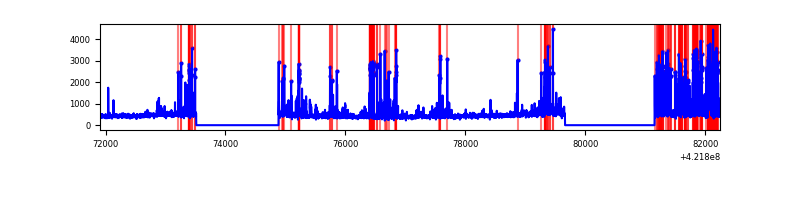 |
Top three noisy pixels from each quadrant. If the there are fewer than three noisy pixels in the level2.evt file, extra rows are filled as -1
| Pixel properties | Quadrant properties | ||||||
|---|---|---|---|---|---|---|---|
| Quadrant | DetID | PixID | Counts | Sigma | Mean | Median | Sigma |
| A | 10 | 83 | 635229 | 3775.9 | 824 | 807 | 168.0 |
| A | 0 | 8 | 566356 | 3365.99 | 824 | 807 | 168.0 |
| A | 13 | 254 | 12481 | 69.48 | 824 | 807 | 168.0 |
| B | 0 | 186 | 62662 | 389.7 | 815 | 790 | 158.8 |
| B | 5 | 255 | 29694 | 182.05 | 815 | 790 | 158.8 |
| B | 12 | 111 | 20333 | 123.09 | 815 | 790 | 158.8 |
| C | 0 | 10 | 350057 | 1876.12 | 799 | 804 | 186.2 |
| C | 9 | 54 | 328697 | 1761.38 | 799 | 804 | 186.2 |
| C | 15 | 214 | 313053 | 1677.34 | 799 | 804 | 186.2 |
| D | 1 | 52 | 994949 | 5033.92 | 799 | 775 | 197.5 |
| D | 13 | 249 | 232806 | 1174.87 | 799 | 775 | 197.5 |
| D | 12 | 16 | 73425 | 367.86 | 799 | 775 | 197.5 |
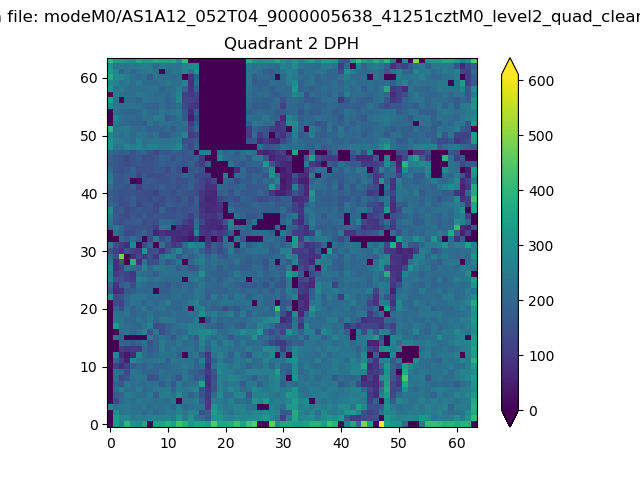
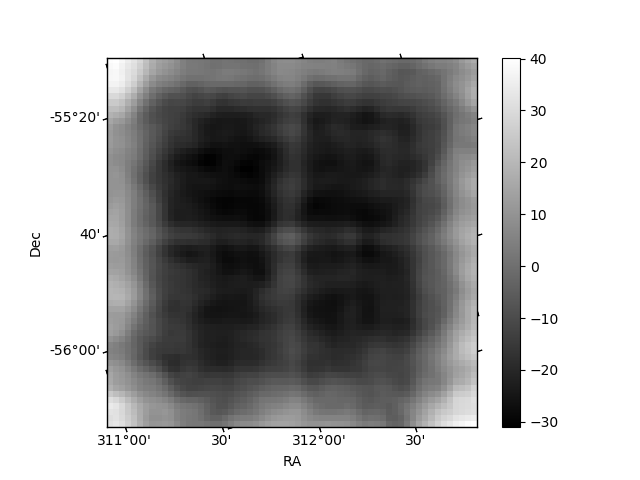
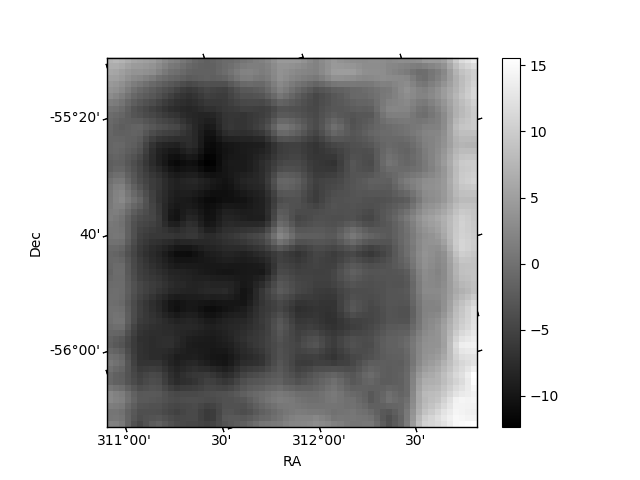
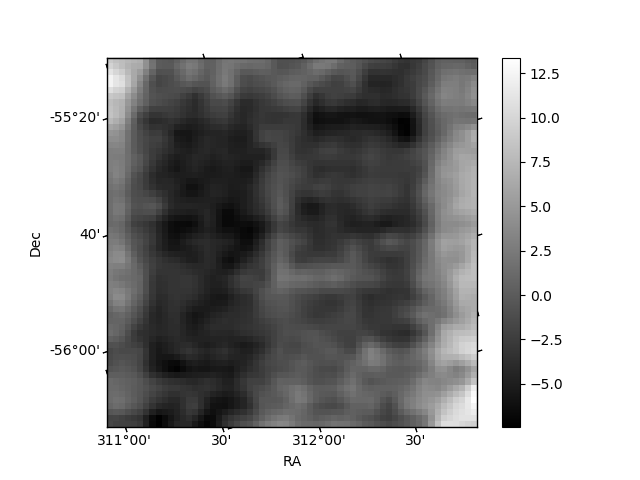
Histogram calculated using DETX and DETY for each event in the final _common_clean file
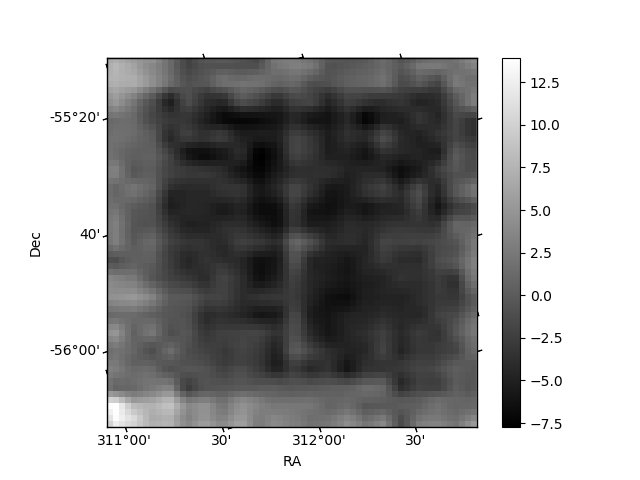
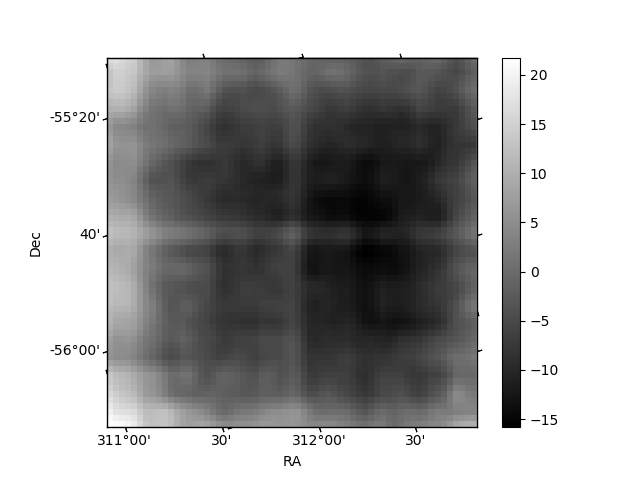
| Quadrant A | 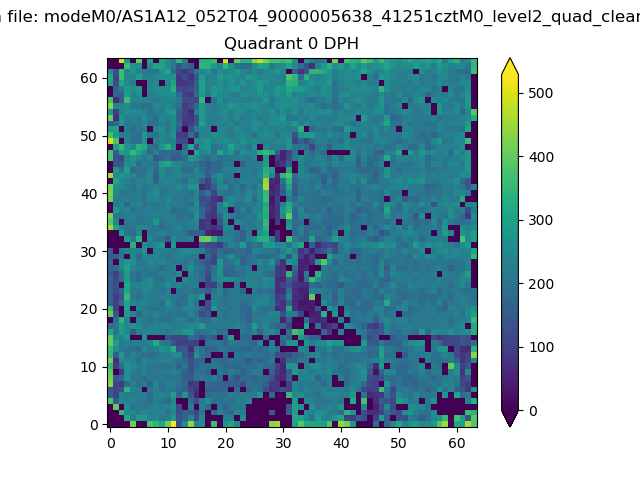 |
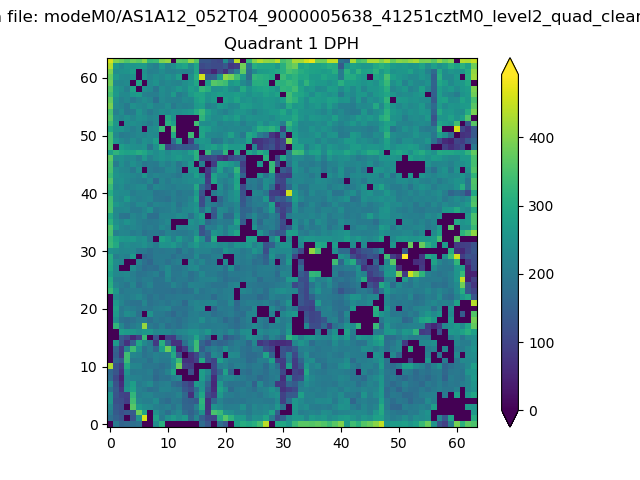 |
Quadrant B |
|---|---|---|---|
| Quadrant D | 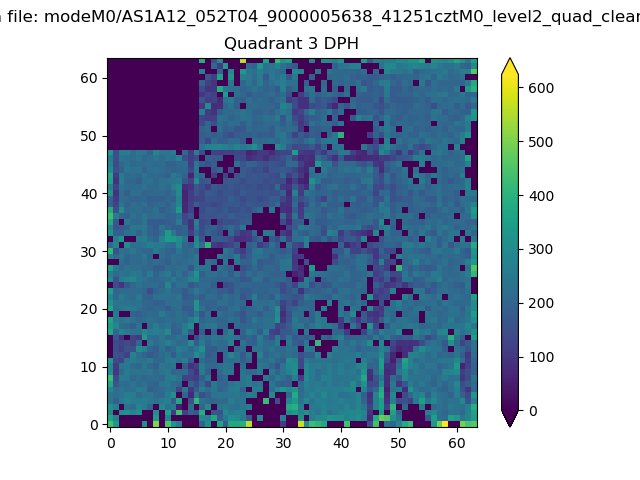 |
 |
Quadrant C |
| Plot type | Count rate plots | Images |
|---|---|---|
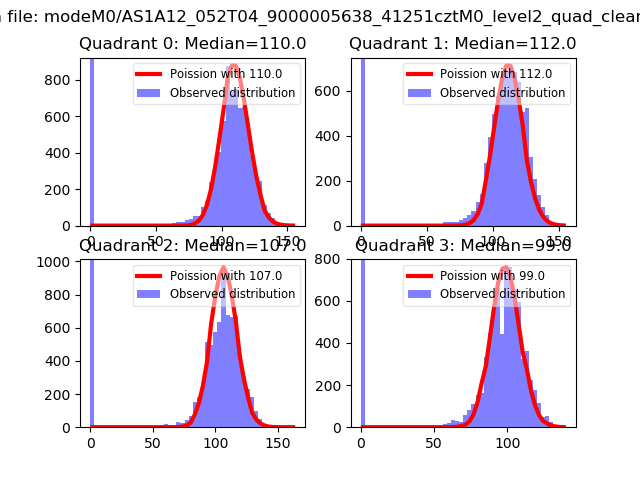
| Comparison with Poisson distribution Blue bars denote a histogram of data divided into 1 sec bins. Red curve is a Poisson curve with rate = median count rate of data. |
 |
 |
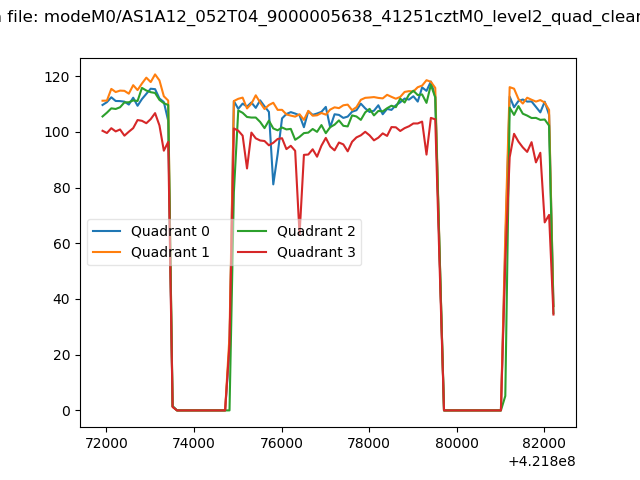
| Quadrant-wise count rates Data is divided into 100 sec bins |
 |
|
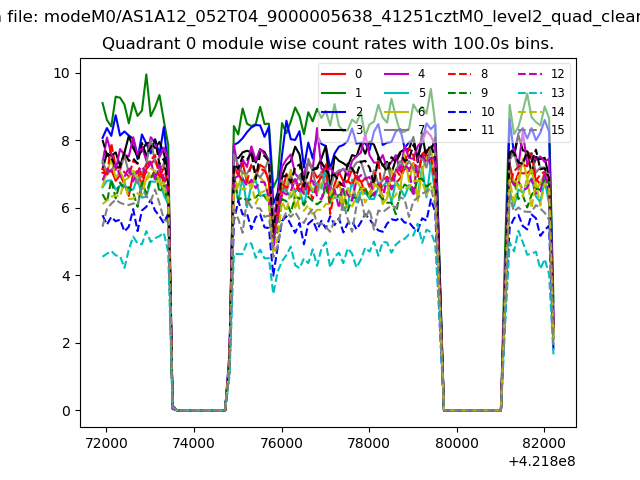
| Module-wise count rates for Quadrant A Data is divided into 100 sec bins |
 |
 |
| Module-wise count rates for Quadrant B Data is divided into 100 sec bins |
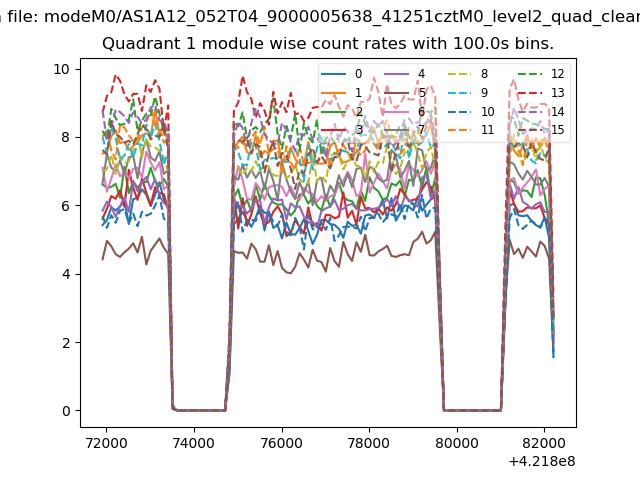 |
 |
| Module-wise count rates for Quadrant C Data is divided into 100 sec bins |
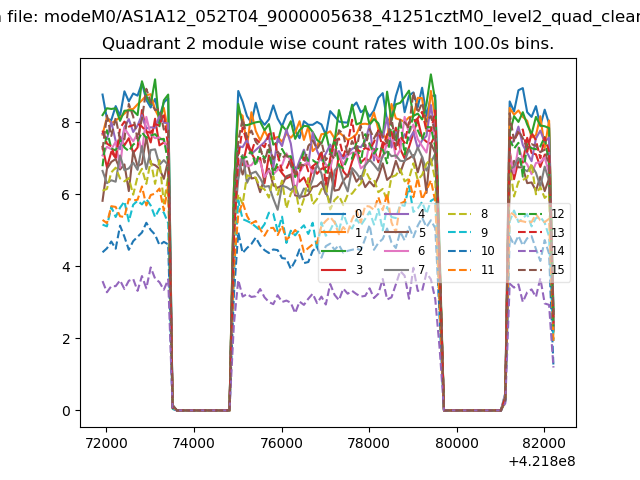 |
 |
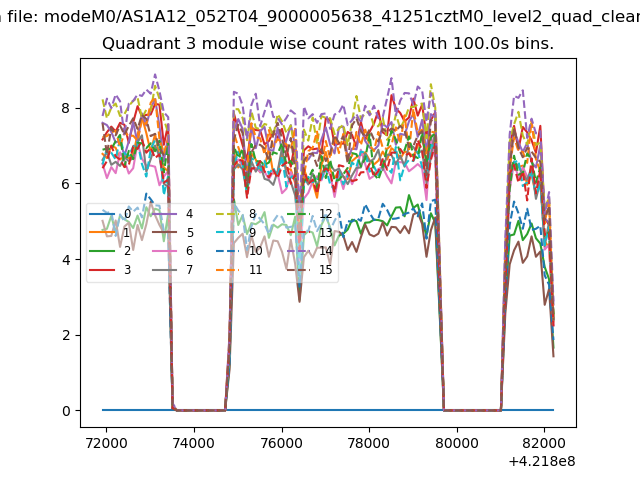
| Module-wise count rates for Quadrant D Data is divided into 100 sec bins |
 |
 |
| Parameter | Plot |
|---|---|
| CZT HV Monitor | 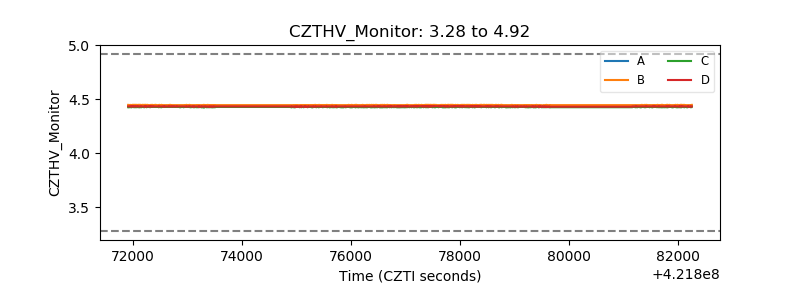 |
| D_VDD | 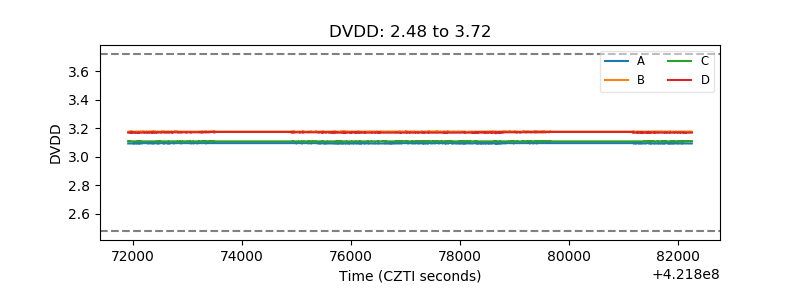 |
| Temperature 1 | 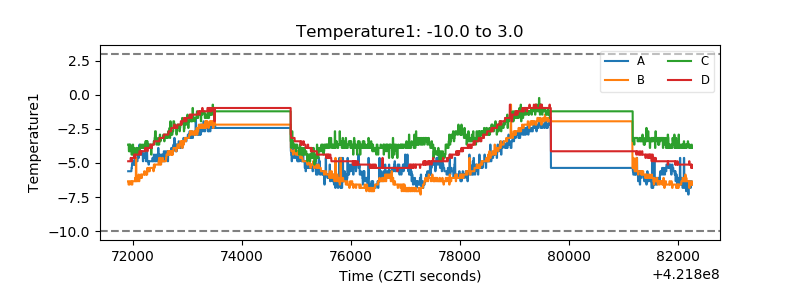 |
| Veto HV Monitor | 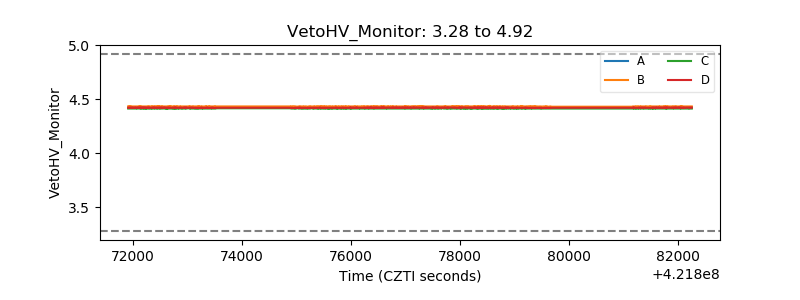 |
| Veto LLD | 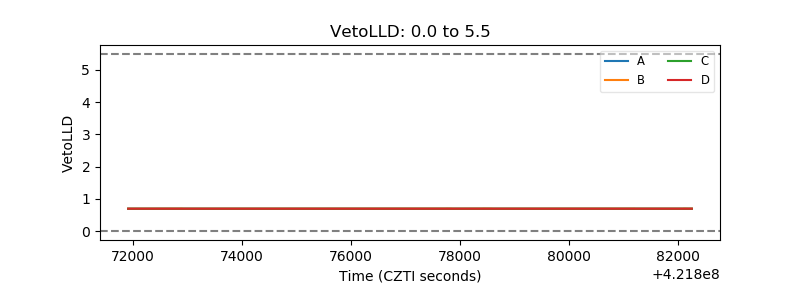 |
| Alpha Counter | 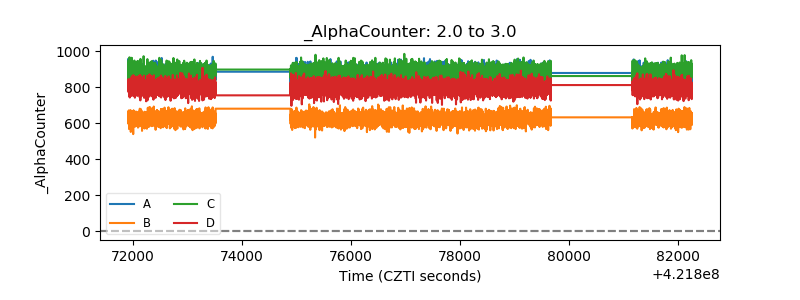 |
| _CPM_Rate | 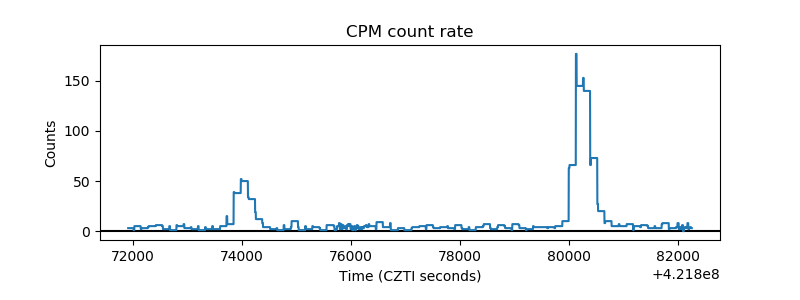 |
| CZT Counter | 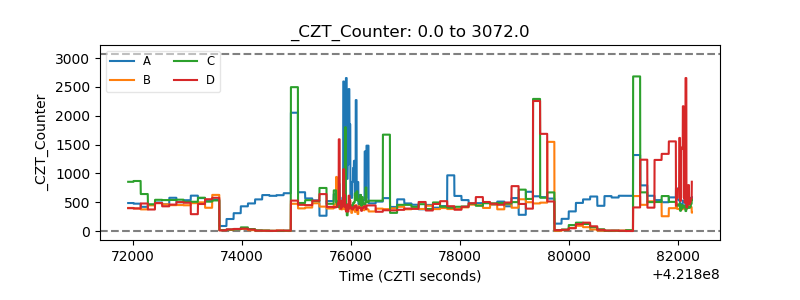 |
| +2.5 Volts monitor | 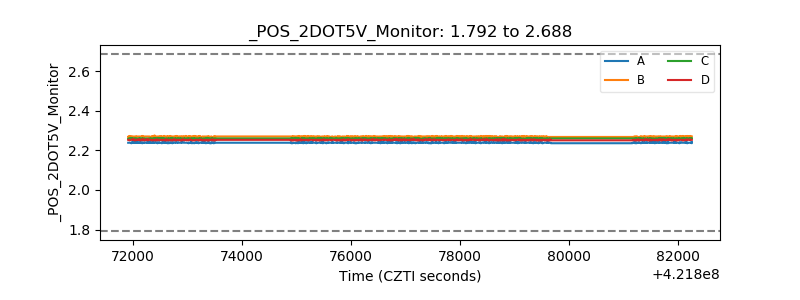 |
| +5 Volts monitor | 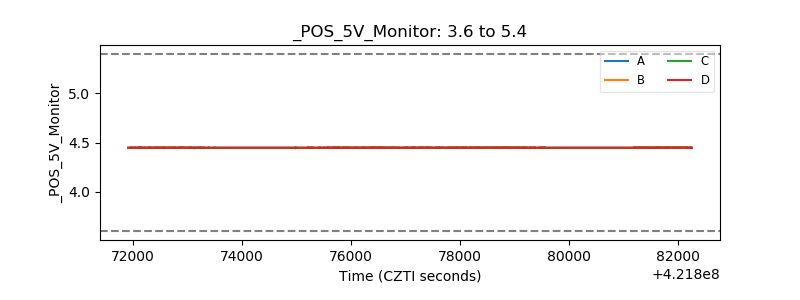 |
| _ROLL_ROT | 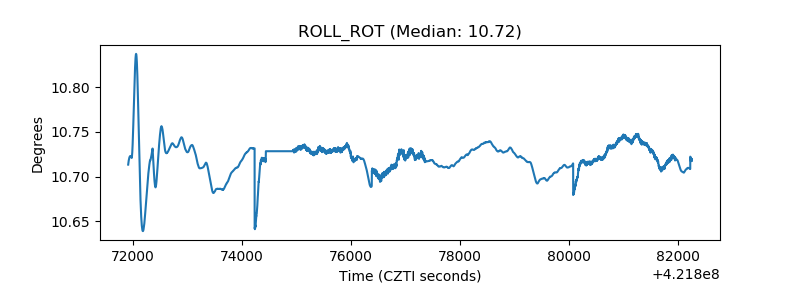 |
| _Roll_DEC |  |
| _Roll_RA | 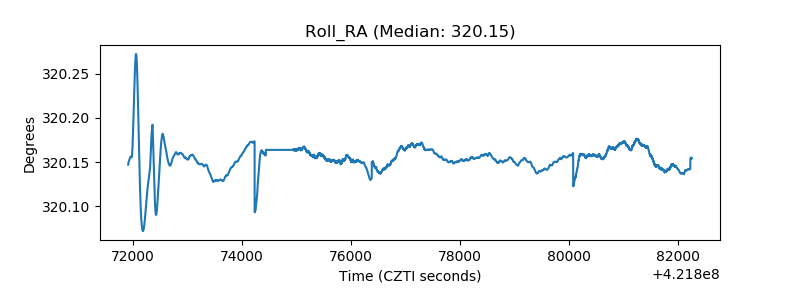 |
| Veto Counter | 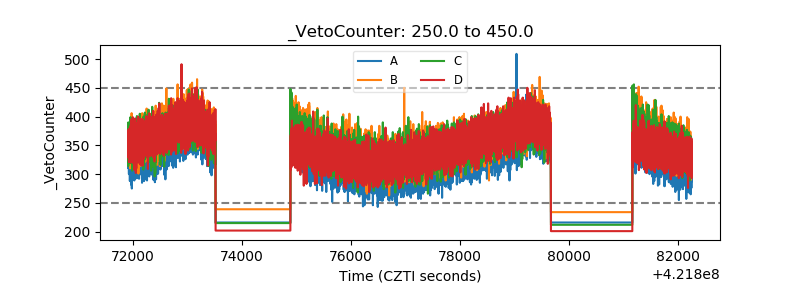 |