| Param | Original file | Final file |
|---|---|---|
| Filename | modeM0/AS1A12_052T04_9000005638_41252cztM0_level2.fits | modeM0/AS1A12_052T04_9000005638_41252cztM0_level2_quad_clean.evt |
| Size (bytes) | 425,914,560 | 98,876,160 |
| Size | 406.2 MB | 94.3 MB |
| Events in quadrant A | 3,526,662 | 673,564 |
| Events in quadrant B | 2,778,529 | 683,361 |
| Events in quadrant C | 3,877,873 | 638,085 |
| Events in quadrant D | 5,107,410 | 571,931 |
| Mode M9 | |||
|---|---|---|---|
| Quadrant | BADHDUFLAG | Total packets | Discarded packets |
| A | 0 | 31 | 0 |
| B | 0 | 31 | 0 |
| C | 0 | 31 | 0 |
| D | 0 | 31 | 0 |
| Mode SS | |||
|---|---|---|---|
| Quadrant | BADHDUFLAG | Total packets | Discarded packets |
| A | 0 | 126 | 0 |
| B | 0 | 126 | 0 |
| C | 0 | 126 | 0 |
| D | 0 | 126 | 0 |
| Mode M0 | |||
|---|---|---|---|
| Quadrant | BADHDUFLAG | Total packets | Discarded packets |
| A | 0 | 14262 | 3 |
| B | 0 | 12696 | 2 |
| C | 0 | 15612 | 2 |
| D | 0 | 19454 | 2 |
| Quadrant | Total seconds | Saturated seconds | Saturation percentage |
|---|---|---|---|
| A | 6116 | 19 | 0.310661% |
| B | 6116 | 18 | 0.294310% |
| C | 6116 | 175 | 2.861347% |
| D | 6116 | 500 | 8.175278% |
Noise dominated data is calculated using 1-second bins in cleaned event files. If a bin has >2000 counts, and if more than 50% of those come from <1% of pixels, then it is considered to be noise-dominated and hence unusable.
| Quadrant | # 1 sec bins | Bins with >0 counts | Bins with >2000 counts | High rate bins dominated by noise | Noise dominated (total time) | Noise dominated (detector-on time) | Marked lightcurve |
|---|---|---|---|---|---|---|---|
| A | 9223 | 6118 | 5 | 5 | 0.05% | 0.08% | 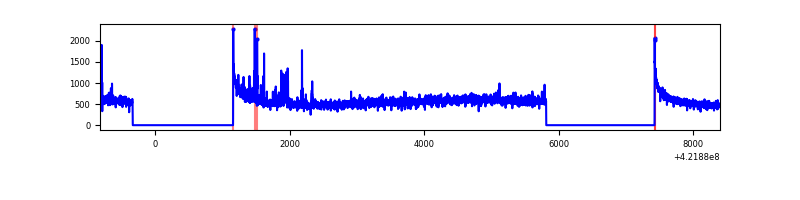 |
| B | 9223 | 6118 | 7 | 7 | 0.08% | 0.11% | 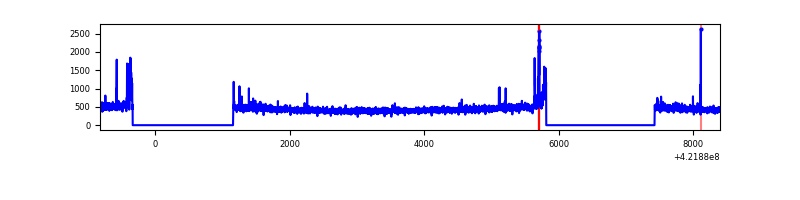 |
| C | 9223 | 6118 | 156 | 156 | 1.69% | 2.55% | 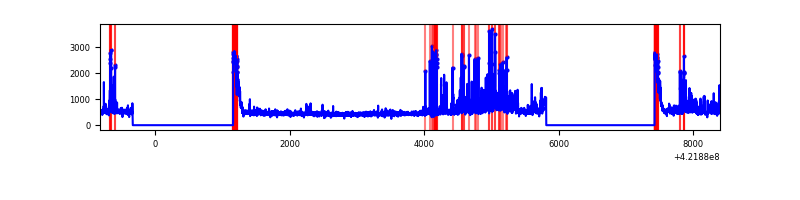 |
| D | 9223 | 6118 | 471 | 471 | 5.11% | 7.70% | 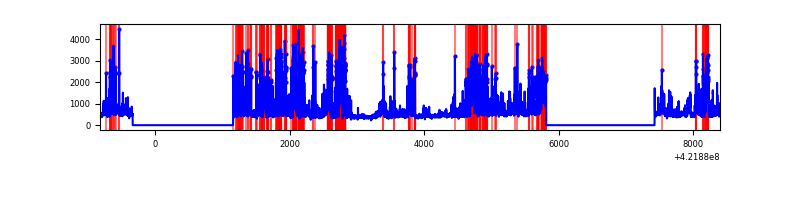 |
Top three noisy pixels from each quadrant. If the there are fewer than three noisy pixels in the level2.evt file, extra rows are filled as -1
| Pixel properties | Quadrant properties | ||||||
|---|---|---|---|---|---|---|---|
| Quadrant | DetID | PixID | Counts | Sigma | Mean | Median | Sigma |
| A | 10 | 83 | 548207 | 3987.95 | 672 | 659 | 137.3 |
| A | 0 | 8 | 339808 | 2470.12 | 672 | 659 | 137.3 |
| A | 13 | 248 | 19743 | 138.99 | 672 | 659 | 137.3 |
| B | 0 | 186 | 122606 | 933.23 | 664 | 644 | 130.7 |
| B | 0 | 245 | 20966 | 155.5 | 664 | 644 | 130.7 |
| B | 5 | 255 | 18007 | 132.86 | 664 | 644 | 130.7 |
| C | 9 | 54 | 662056 | 4328.05 | 650 | 654 | 152.8 |
| C | 0 | 10 | 333482 | 2177.94 | 650 | 654 | 152.8 |
| C | 15 | 214 | 258258 | 1685.7 | 650 | 654 | 152.8 |
| D | 1 | 52 | 2057047 | 13121.68 | 639 | 620 | 156.7 |
| D | 13 | 249 | 319856 | 2036.99 | 639 | 620 | 156.7 |
| D | 12 | 16 | 105622 | 670.0 | 639 | 620 | 156.7 |
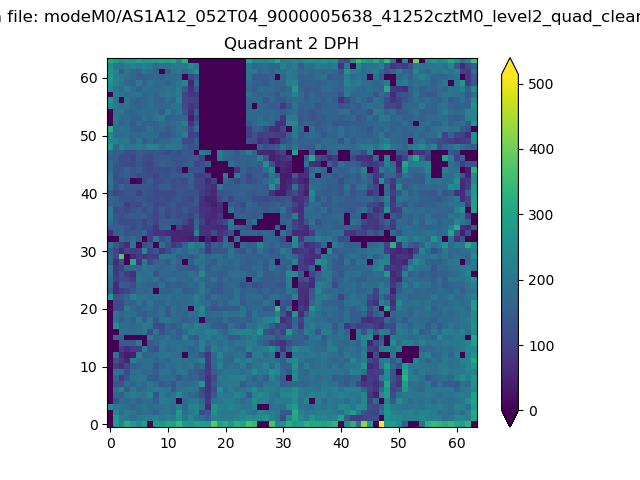
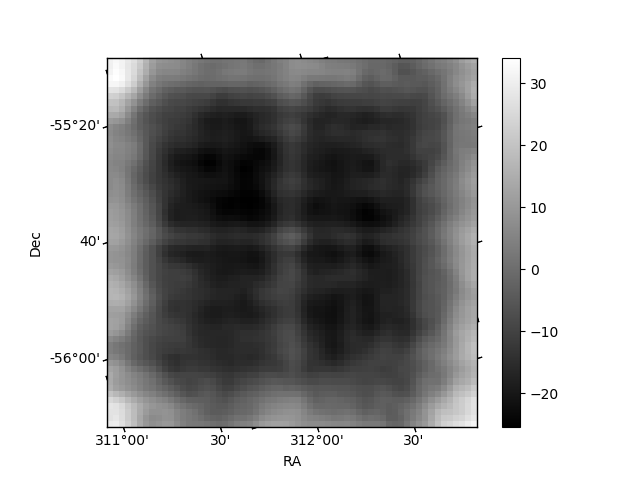
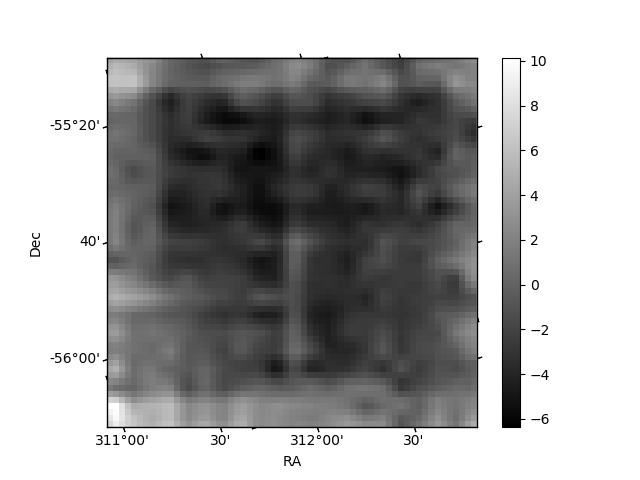
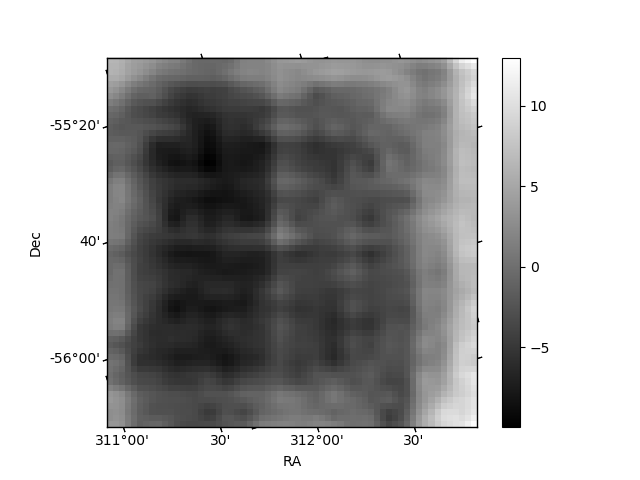
Histogram calculated using DETX and DETY for each event in the final _common_clean file
| Quadrant A | 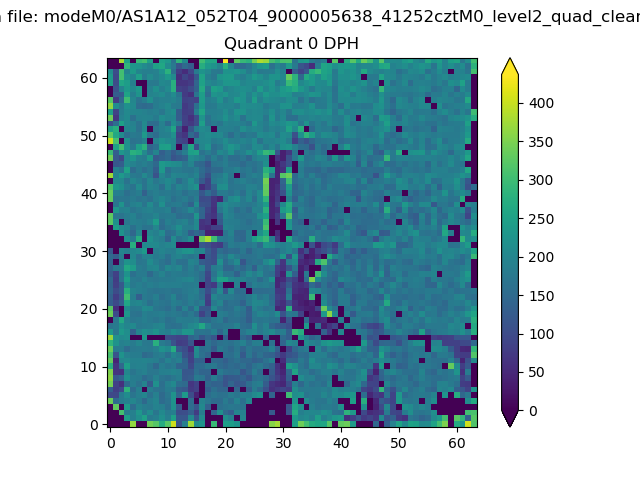 |
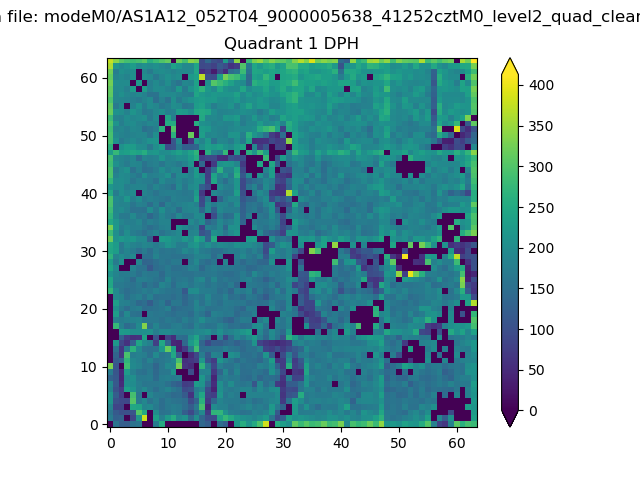 |
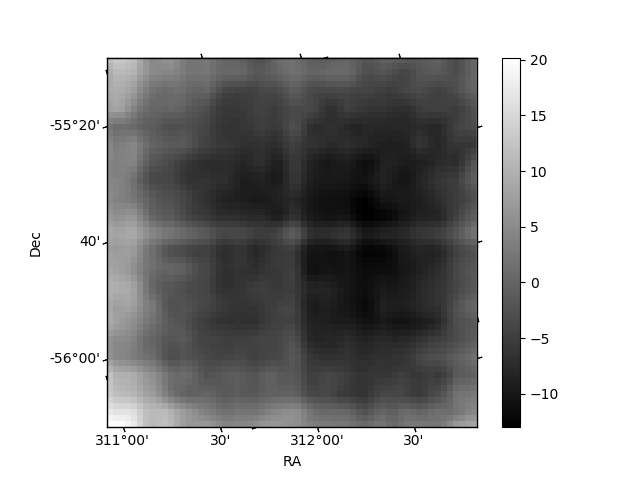
Quadrant B |
|---|---|---|---|
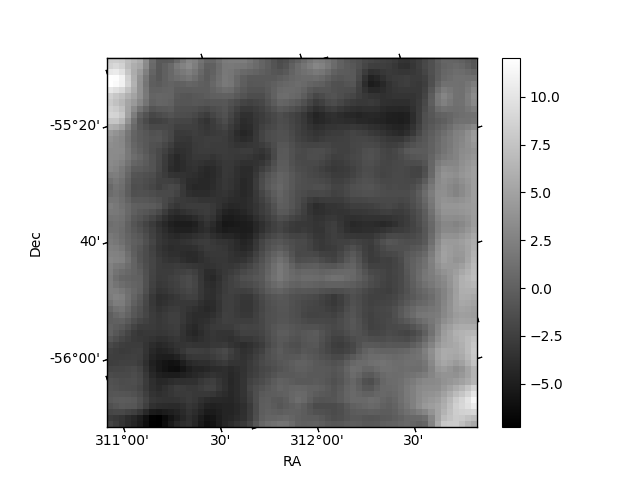
| Quadrant D | 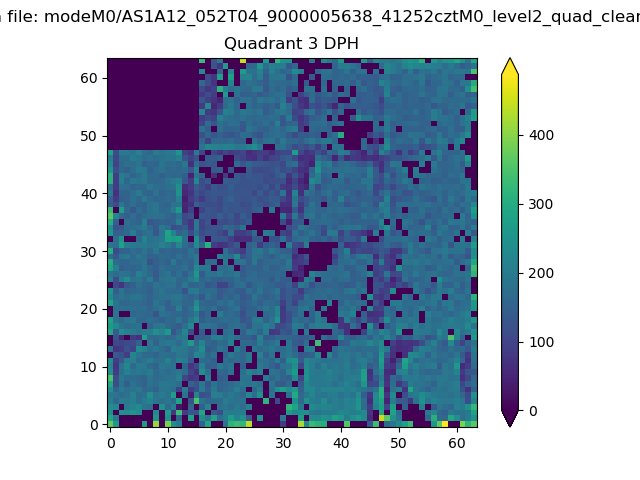 |
 |
Quadrant C |
| Plot type | Count rate plots | Images |
|---|---|---|
| Comparison with Poisson distribution Blue bars denote a histogram of data divided into 1 sec bins. Red curve is a Poisson curve with rate = median count rate of data. |
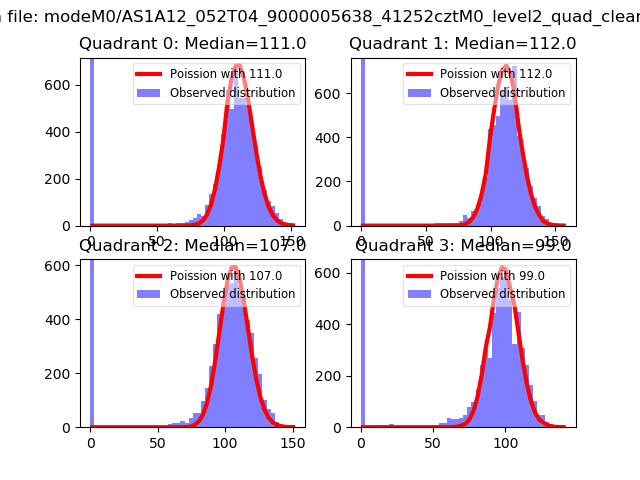 |
 |
| Quadrant-wise count rates Data is divided into 100 sec bins |
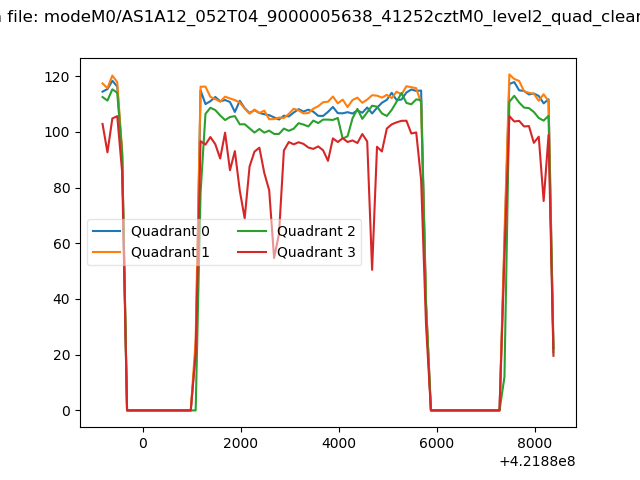 |
|
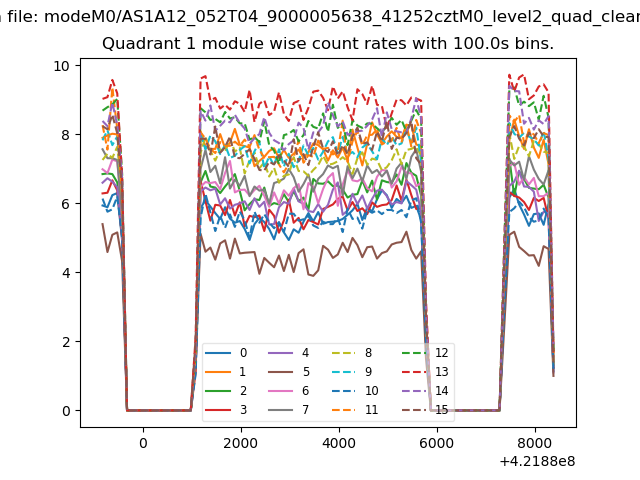
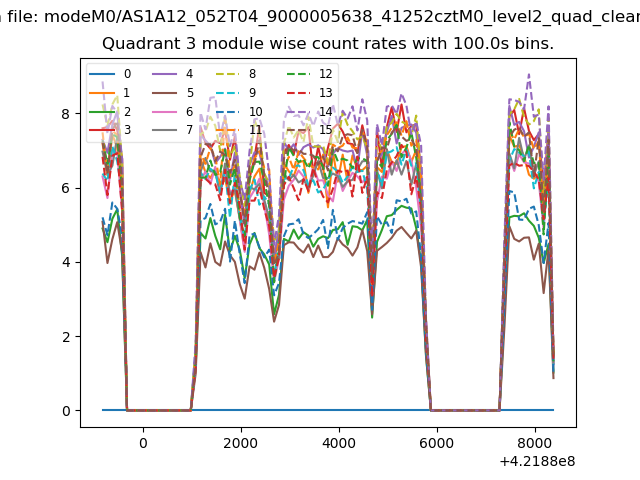
| Module-wise count rates for Quadrant A Data is divided into 100 sec bins |
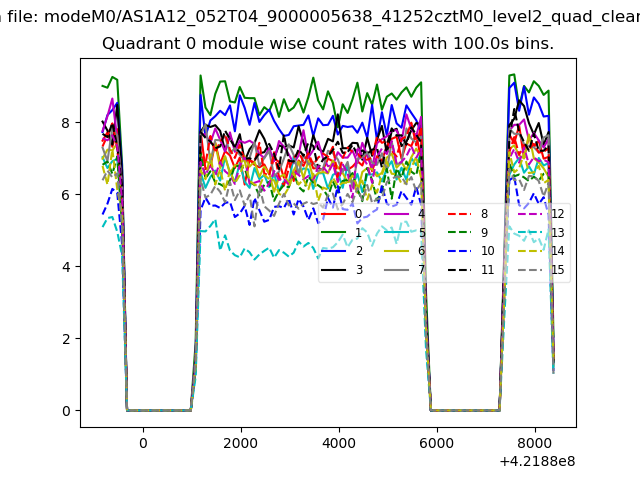 |
 |
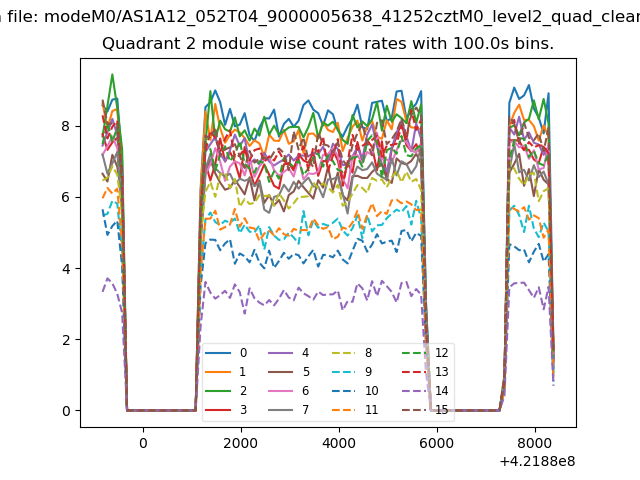
| Module-wise count rates for Quadrant B Data is divided into 100 sec bins |
 |
 |
| Module-wise count rates for Quadrant C Data is divided into 100 sec bins |
 |
 |
| Module-wise count rates for Quadrant D Data is divided into 100 sec bins |
 |
 |
| Parameter | Plot |
|---|---|
| CZT HV Monitor | 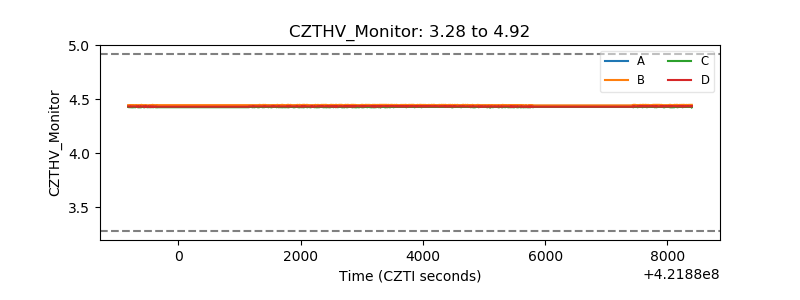 |
| D_VDD | 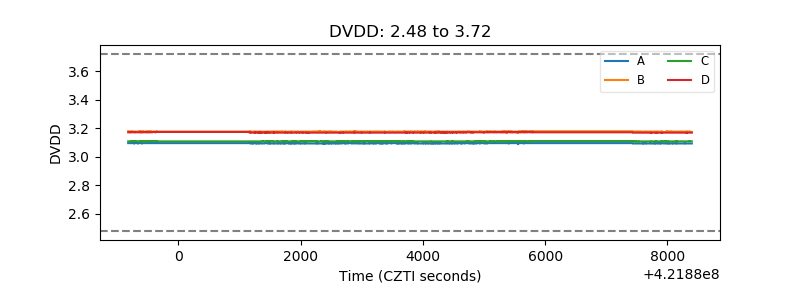 |
| Temperature 1 | 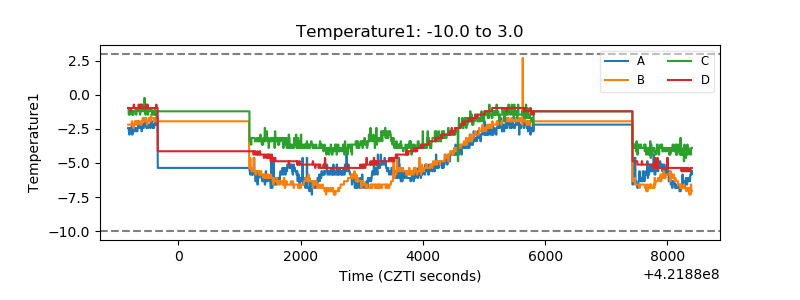 |
| Veto HV Monitor | 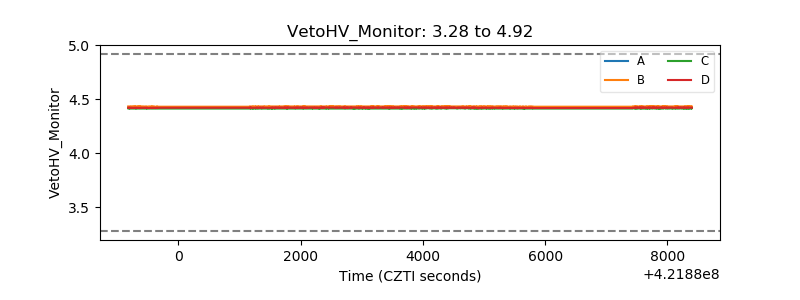 |
| Veto LLD | 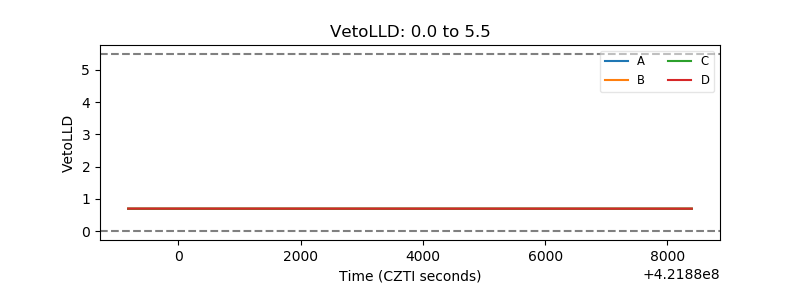 |
| Alpha Counter | 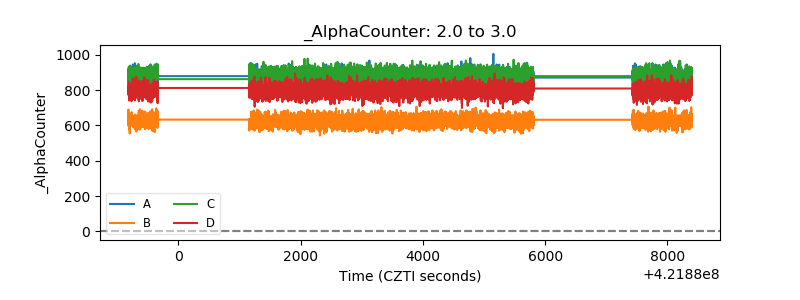 |
| _CPM_Rate | 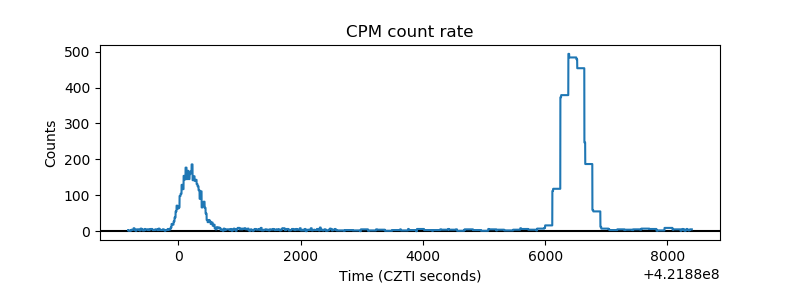 |
| CZT Counter | 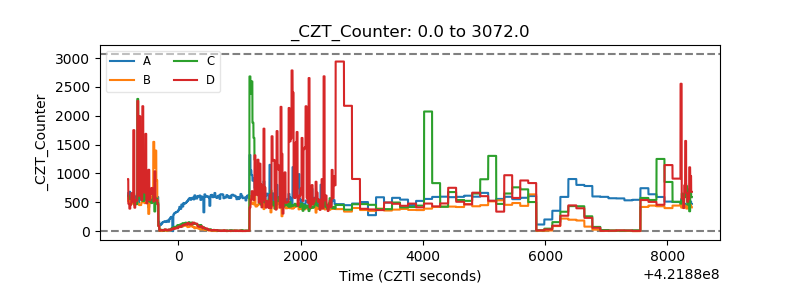 |
| +2.5 Volts monitor | 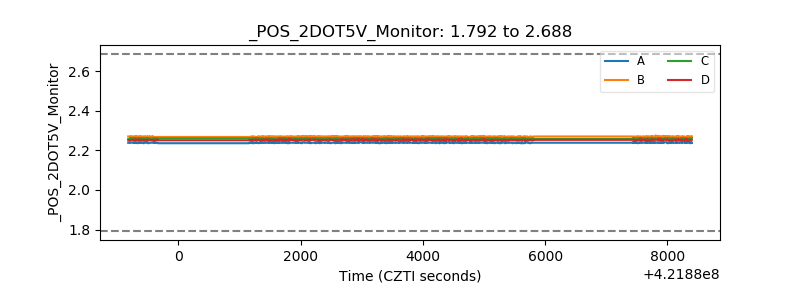 |
| +5 Volts monitor | 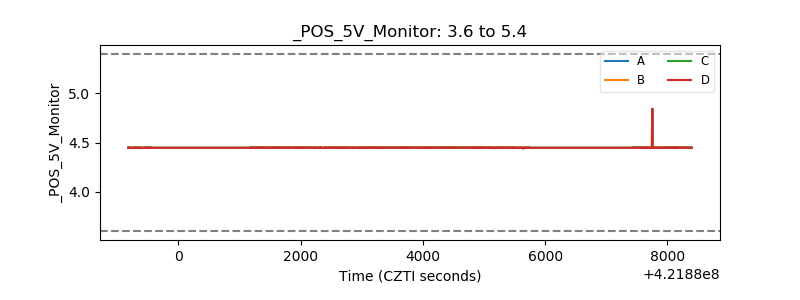 |
| _ROLL_ROT | 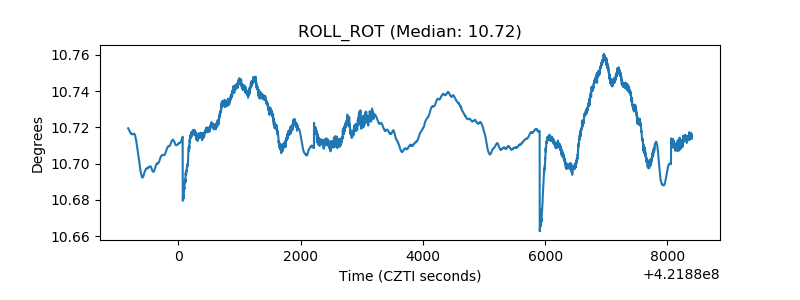 |
| _Roll_DEC | 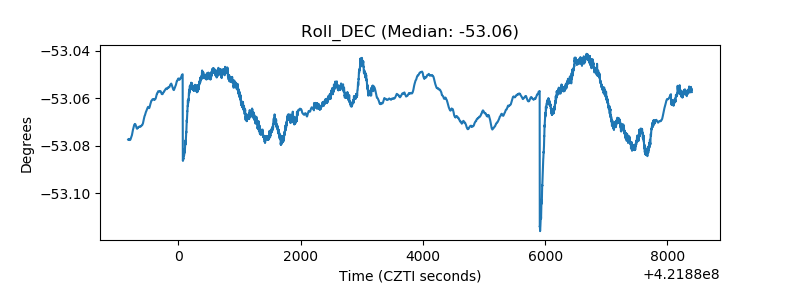 |
| _Roll_RA | 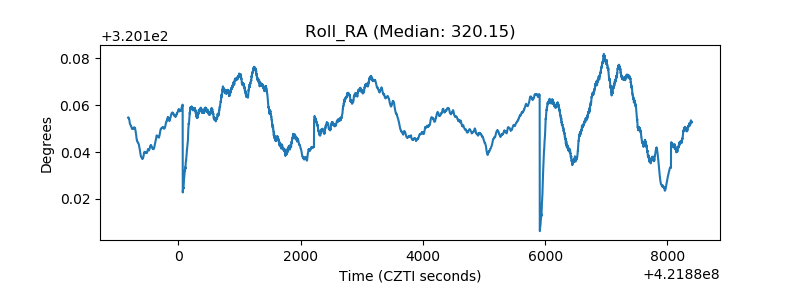 |
| Veto Counter | 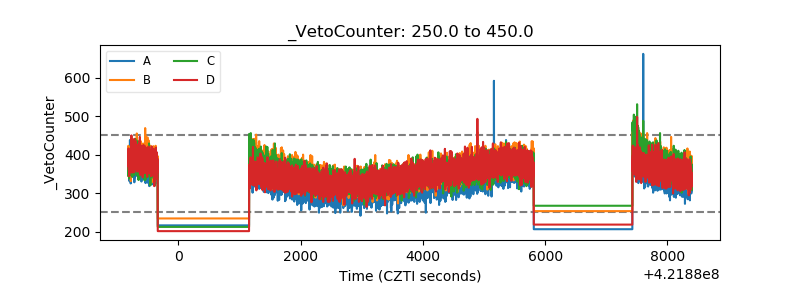 |