| Param | Original file | Final file |
|---|---|---|
| Filename | modeM0/AS1A12_052T04_9000005638_41254cztM0_level2.fits | modeM0/AS1A12_052T04_9000005638_41254cztM0_level2_quad_clean.evt |
| Size (bytes) | 362,378,880 | 86,253,120 |
| Size | 345.6 MB | 82.3 MB |
| Events in quadrant A | 3,216,760 | 582,220 |
| Events in quadrant B | 2,597,701 | 594,917 |
| Events in quadrant C | 3,809,766 | 547,370 |
| Events in quadrant D | 3,378,702 | 517,345 |
| Mode M9 | |||
|---|---|---|---|
| Quadrant | BADHDUFLAG | Total packets | Discarded packets |
| A | 0 | 28 | 0 |
| B | 0 | 28 | 0 |
| C | 0 | 28 | 0 |
| D | 0 | 29 | 0 |
| Mode SS | |||
|---|---|---|---|
| Quadrant | BADHDUFLAG | Total packets | Discarded packets |
| A | 0 | 108 | 0 |
| B | 0 | 108 | 0 |
| C | 0 | 108 | 0 |
| D | 0 | 108 | 0 |
| Mode M0 | |||
|---|---|---|---|
| Quadrant | BADHDUFLAG | Total packets | Discarded packets |
| A | 0 | 13038 | 3 |
| B | 0 | 11586 | 2 |
| C | 0 | 14657 | 2 |
| D | 0 | 13754 | 2 |
| Quadrant | Total seconds | Saturated seconds | Saturation percentage |
|---|---|---|---|
| A | 5281 | 81 | 1.533800% |
| B | 5281 | 71 | 1.344442% |
| C | 5281 | 273 | 5.169475% |
| D | 5281 | 181 | 3.427381% |
Noise dominated data is calculated using 1-second bins in cleaned event files. If a bin has >2000 counts, and if more than 50% of those come from <1% of pixels, then it is considered to be noise-dominated and hence unusable.
| Quadrant | # 1 sec bins | Bins with >0 counts | Bins with >2000 counts | High rate bins dominated by noise | Noise dominated (total time) | Noise dominated (detector-on time) | Marked lightcurve |
|---|---|---|---|---|---|---|---|
| A | 7043 | 5282 | 70 | 70 | 0.99% | 1.33% | 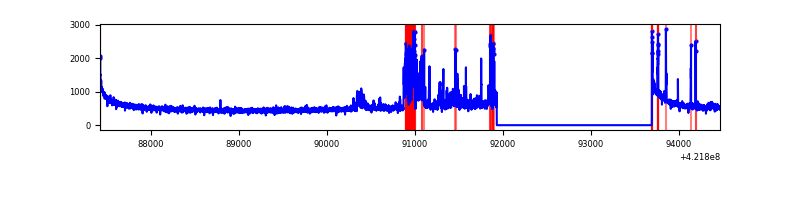 |
| B | 7043 | 5282 | 32 | 32 | 0.45% | 0.61% | 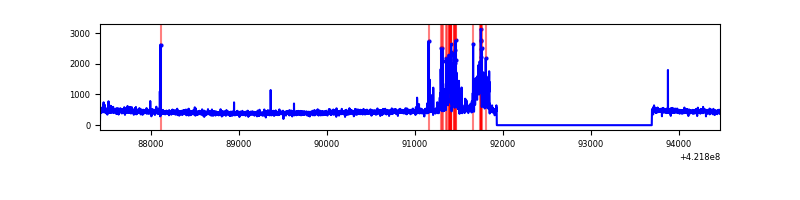 |
| C | 7043 | 5282 | 261 | 261 | 3.71% | 4.94% | 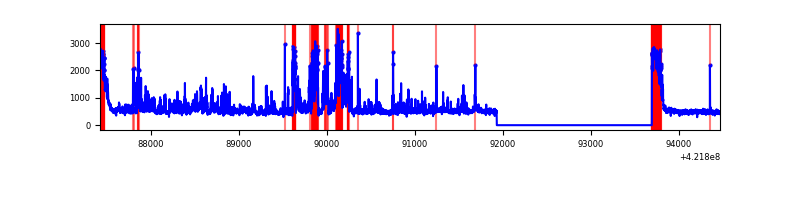 |
| D | 7043 | 5282 | 169 | 169 | 2.40% | 3.20% |  |
Top three noisy pixels from each quadrant. If the there are fewer than three noisy pixels in the level2.evt file, extra rows are filled as -1
| Pixel properties | Quadrant properties | ||||||
|---|---|---|---|---|---|---|---|
| Quadrant | DetID | PixID | Counts | Sigma | Mean | Median | Sigma |
| A | 10 | 83 | 500450 | 4272.54 | 572 | 559 | 117.0 |
| A | 6 | 10 | 481483 | 4110.43 | 572 | 559 | 117.0 |
| A | 12 | 189 | 10982 | 89.08 | 572 | 559 | 117.0 |
| B | 0 | 186 | 281981 | 2530.01 | 571 | 553 | 111.2 |
| B | 5 | 185 | 43449 | 385.63 | 571 | 553 | 111.2 |
| B | 12 | 111 | 14157 | 122.3 | 571 | 553 | 111.2 |
| C | 9 | 54 | 1017784 | 7751.28 | 556 | 559 | 131.2 |
| C | 0 | 10 | 384195 | 2923.32 | 556 | 559 | 131.2 |
| C | 15 | 214 | 222928 | 1694.46 | 556 | 559 | 131.2 |
| D | 2 | 120 | 432520 | 3150.84 | 560 | 544 | 137.1 |
| D | 13 | 249 | 350937 | 2555.78 | 560 | 544 | 137.1 |
| D | 1 | 52 | 213735 | 1555.02 | 560 | 544 | 137.1 |
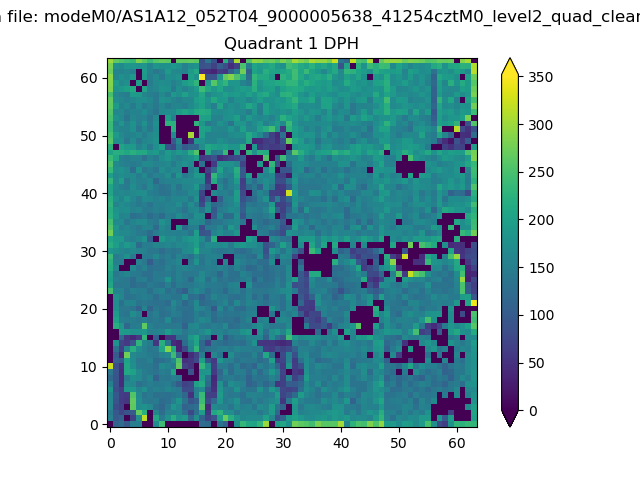
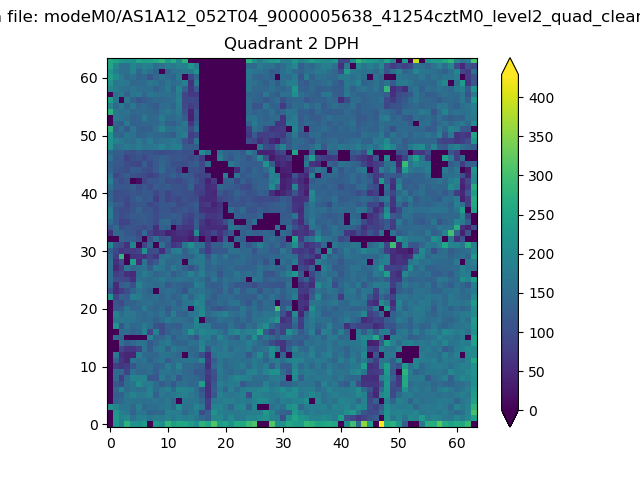
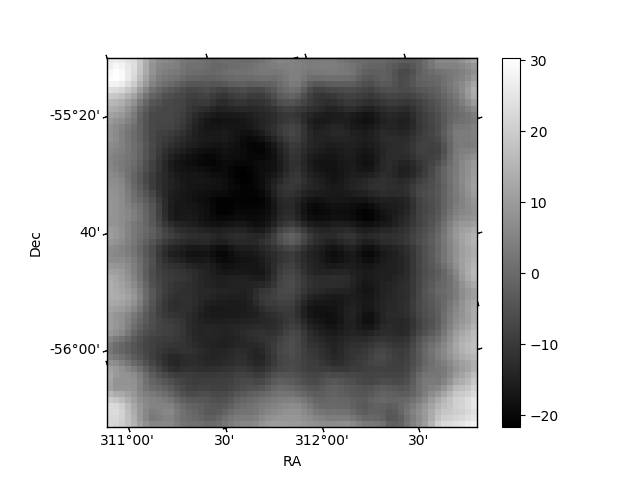
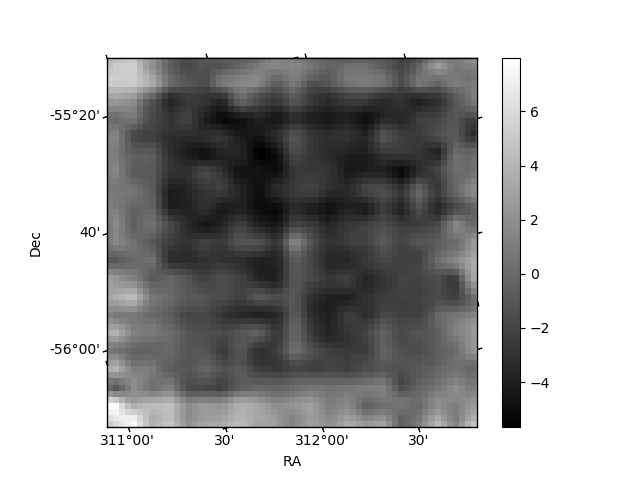
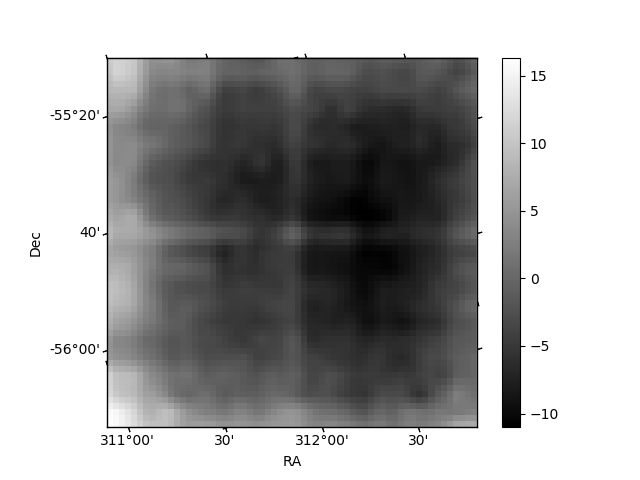
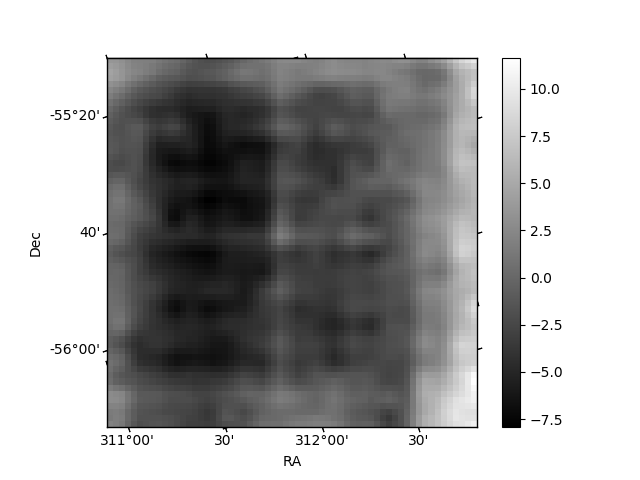
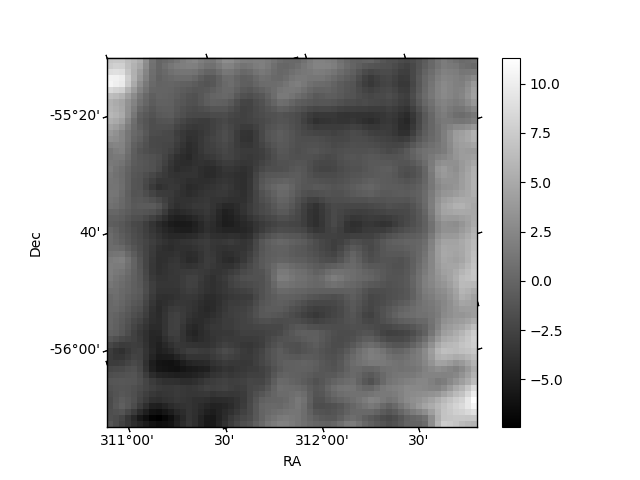
Histogram calculated using DETX and DETY for each event in the final _common_clean file
| Quadrant A | 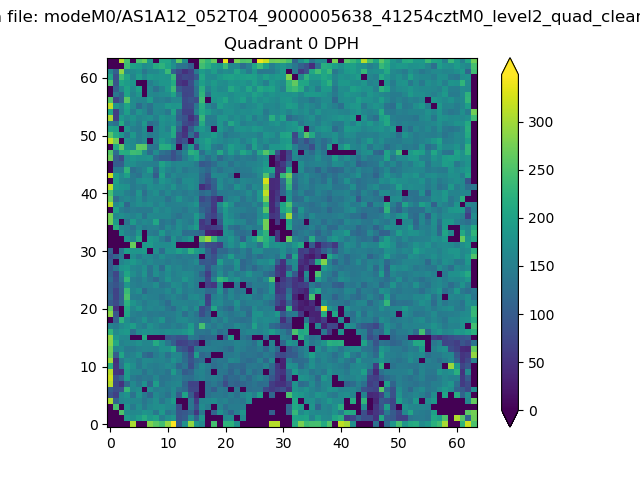 |
 |
Quadrant B |
|---|---|---|---|
| Quadrant D | 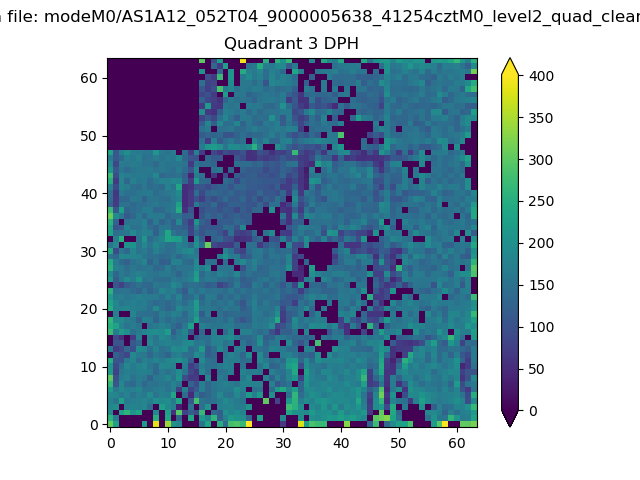 |
 |
Quadrant C |
| Plot type | Count rate plots | Images |
|---|---|---|
| Comparison with Poisson distribution Blue bars denote a histogram of data divided into 1 sec bins. Red curve is a Poisson curve with rate = median count rate of data. |
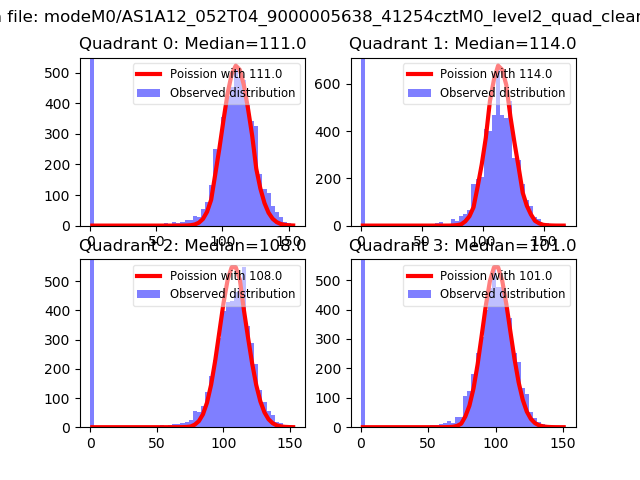 |
 |
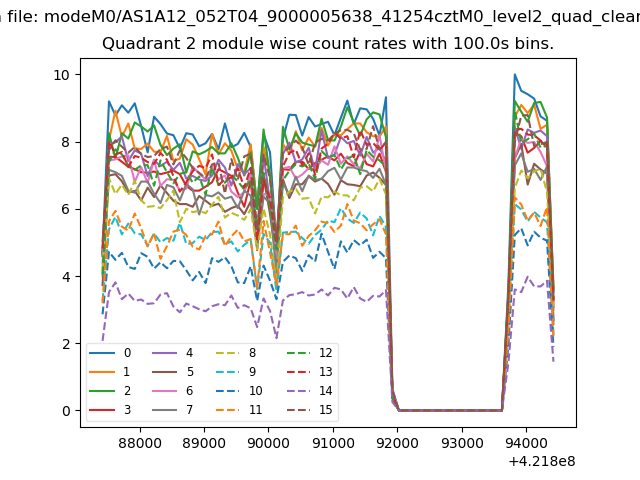
| Quadrant-wise count rates Data is divided into 100 sec bins |
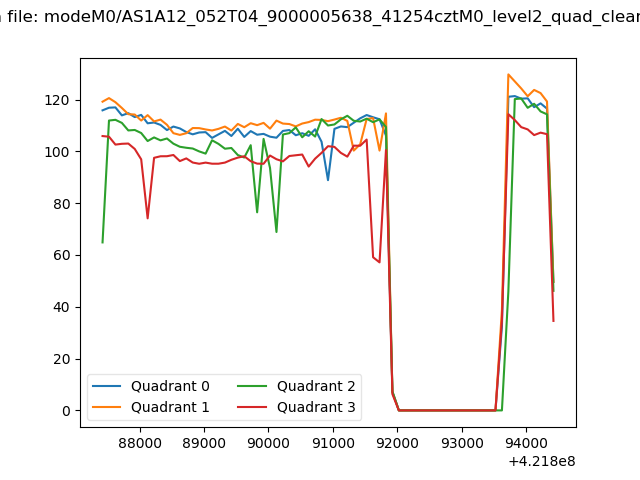 |
|
| Module-wise count rates for Quadrant A Data is divided into 100 sec bins |
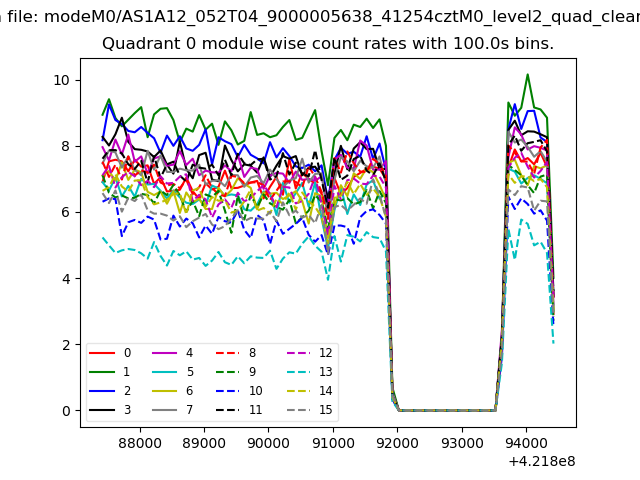 |
 |
| Module-wise count rates for Quadrant B Data is divided into 100 sec bins |
 |
 |
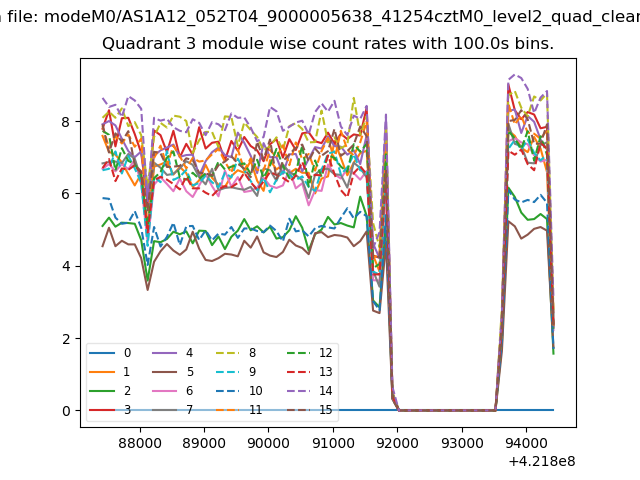
| Module-wise count rates for Quadrant C Data is divided into 100 sec bins |
 |
 |
| Module-wise count rates for Quadrant D Data is divided into 100 sec bins |
 |
 |
| Parameter | Plot |
|---|---|
| CZT HV Monitor | 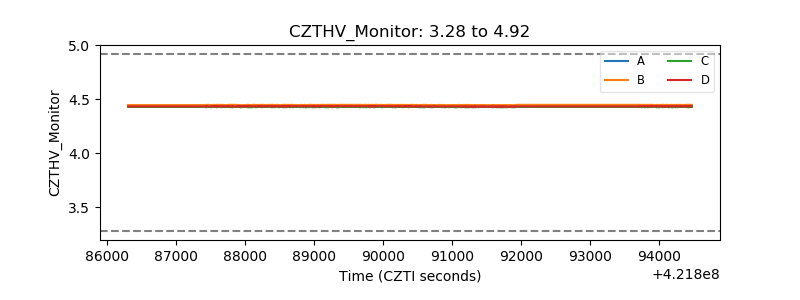 |
| D_VDD | 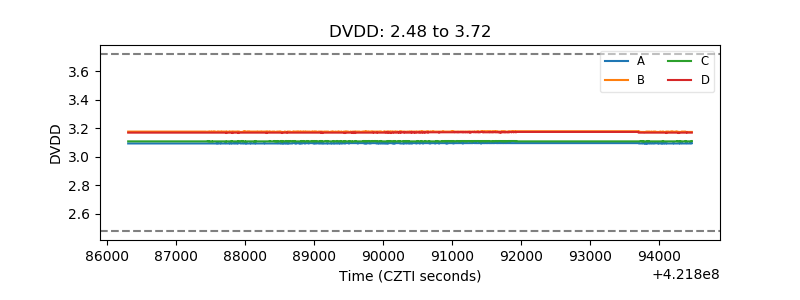 |
| Temperature 1 | 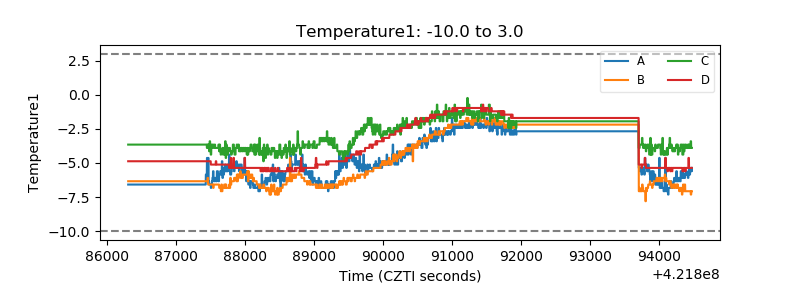 |
| Veto HV Monitor | 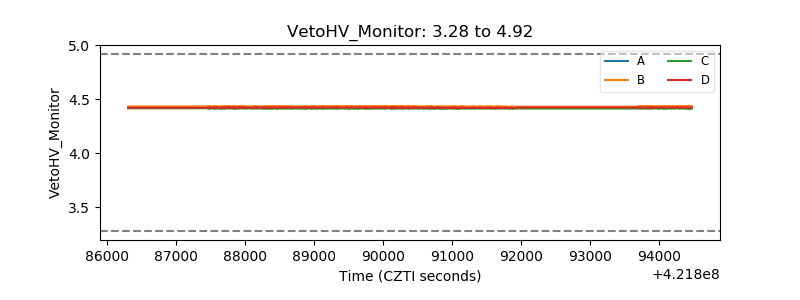 |
| Veto LLD | 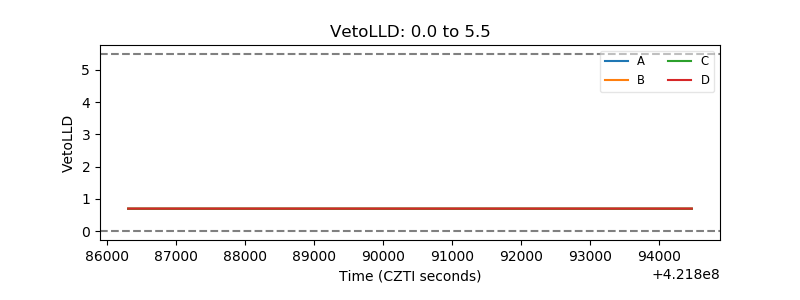 |
| Alpha Counter | 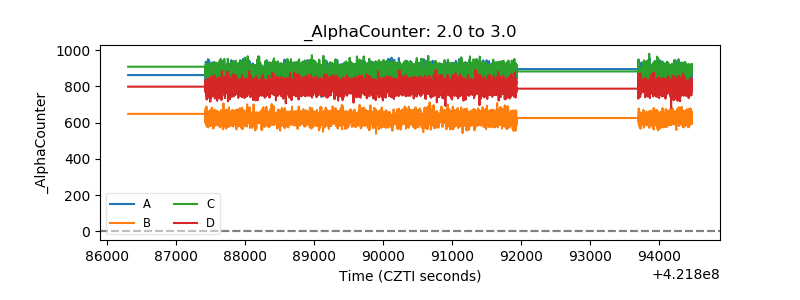 |
| _CPM_Rate |  |
| CZT Counter | 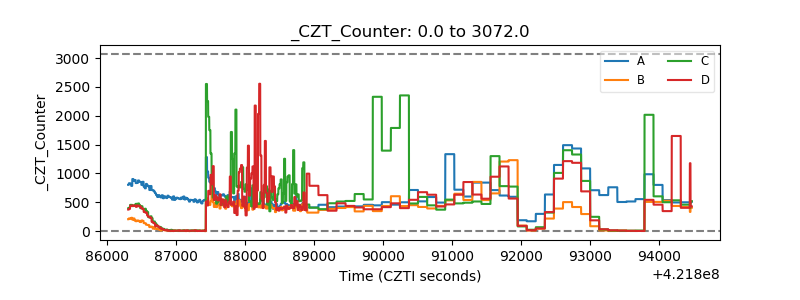 |
| +2.5 Volts monitor | 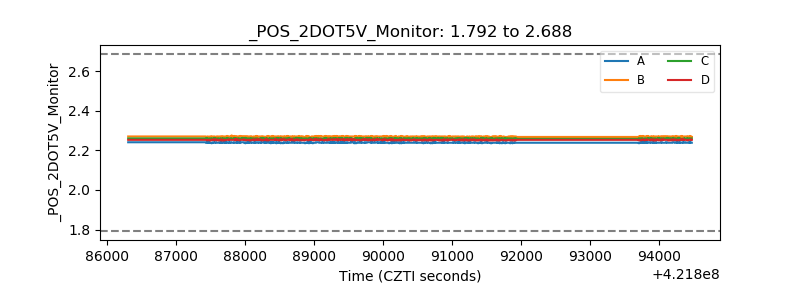 |
| +5 Volts monitor |  |
| _ROLL_ROT | 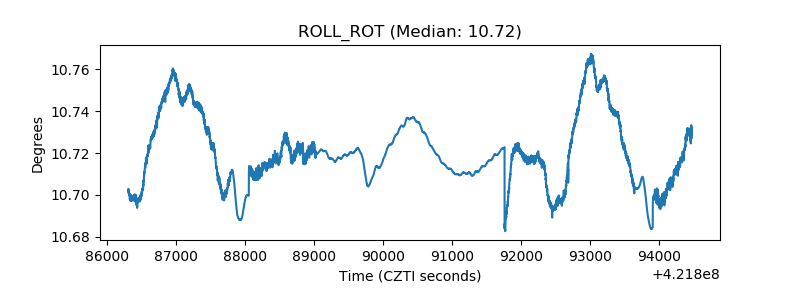 |
| _Roll_DEC | 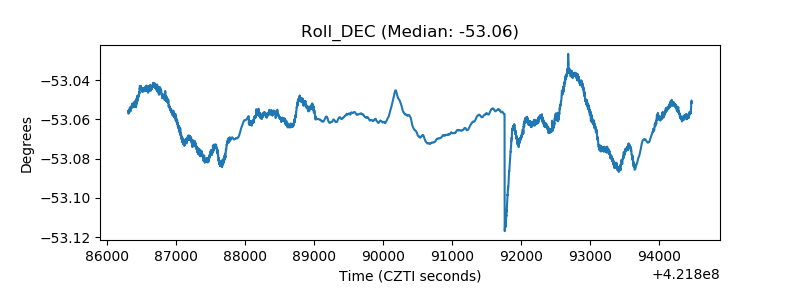 |
| _Roll_RA | 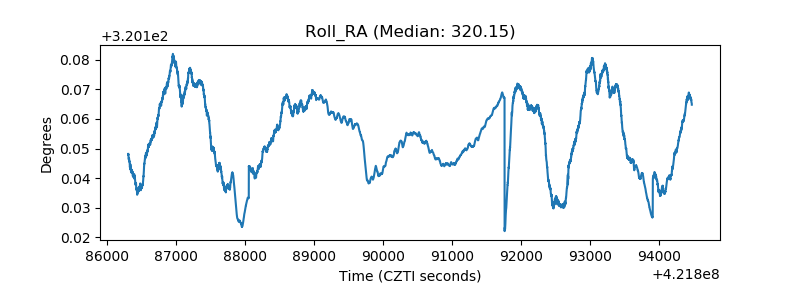 |
| Veto Counter | 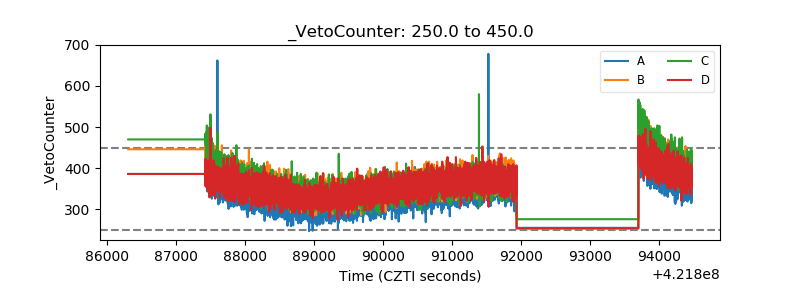 |