| Param | Original file | Final file |
|---|---|---|
| Filename | modeM0/AS1A12_052T04_9000005638_41255cztM0_level2.fits | modeM0/AS1A12_052T04_9000005638_41255cztM0_level2_quad_clean.evt |
| Size (bytes) | 356,909,760 | 90,478,080 |
| Size | 340.4 MB | 86.3 MB |
| Events in quadrant A | 3,267,934 | 611,175 |
| Events in quadrant B | 3,133,350 | 604,700 |
| Events in quadrant C | 2,971,443 | 592,628 |
| Events in quadrant D | 3,422,560 | 556,579 |
| Mode M9 | |||
|---|---|---|---|
| Quadrant | BADHDUFLAG | Total packets | Discarded packets |
| A | 0 | 36 | 0 |
| B | 0 | 36 | 0 |
| C | 0 | 36 | 0 |
| D | 0 | 36 | 0 |
| Mode SS | |||
|---|---|---|---|
| Quadrant | BADHDUFLAG | Total packets | Discarded packets |
| A | 0 | 112 | 0 |
| B | 0 | 112 | 0 |
| C | 0 | 112 | 0 |
| D | 0 | 112 | 0 |
| Mode M0 | |||
|---|---|---|---|
| Quadrant | BADHDUFLAG | Total packets | Discarded packets |
| A | 0 | 12951 | 3 |
| B | 0 | 13103 | 2 |
| C | 0 | 12055 | 2 |
| D | 0 | 13780 | 2 |
| Quadrant | Total seconds | Saturated seconds | Saturation percentage |
|---|---|---|---|
| A | 5347 | 39 | 0.729381% |
| B | 5347 | 270 | 5.049561% |
| C | 5347 | 146 | 2.730503% |
| D | 5347 | 69 | 1.290443% |
Noise dominated data is calculated using 1-second bins in cleaned event files. If a bin has >2000 counts, and if more than 50% of those come from <1% of pixels, then it is considered to be noise-dominated and hence unusable.
| Quadrant | # 1 sec bins | Bins with >0 counts | Bins with >2000 counts | High rate bins dominated by noise | Noise dominated (total time) | Noise dominated (detector-on time) | Marked lightcurve |
|---|---|---|---|---|---|---|---|
| A | 8961 | 5349 | 38 | 38 | 0.42% | 0.71% | 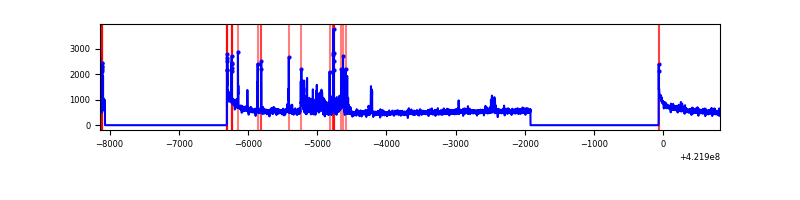 |
| B | 8961 | 5348 | 199 | 199 | 2.22% | 3.72% | 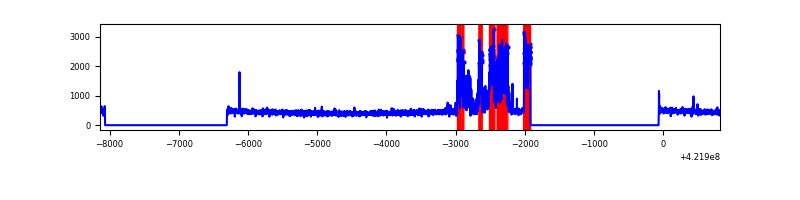 |
| C | 8961 | 5349 | 136 | 136 | 1.52% | 2.54% | 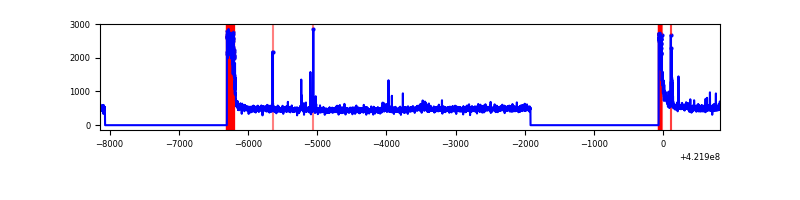 |
| D | 8961 | 5349 | 56 | 56 | 0.62% | 1.05% | 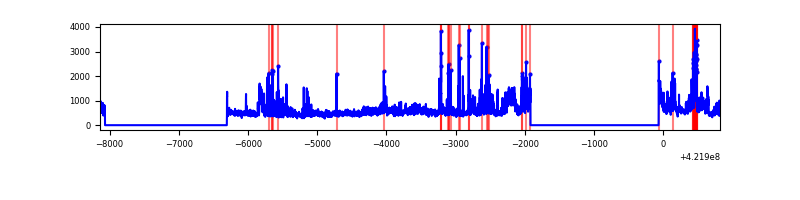 |
Top three noisy pixels from each quadrant. If the there are fewer than three noisy pixels in the level2.evt file, extra rows are filled as -1
| Pixel properties | Quadrant properties | ||||||
|---|---|---|---|---|---|---|---|
| Quadrant | DetID | PixID | Counts | Sigma | Mean | Median | Sigma |
| A | 10 | 83 | 520300 | 4330.23 | 592 | 580 | 120.0 |
| A | 6 | 10 | 410453 | 3415.0 | 592 | 580 | 120.0 |
| A | 12 | 189 | 30991 | 253.38 | 592 | 580 | 120.0 |
| B | 0 | 186 | 808257 | 7166.52 | 583 | 567 | 112.7 |
| B | 0 | 245 | 14494 | 123.57 | 583 | 567 | 112.7 |
| B | 12 | 111 | 14031 | 119.46 | 583 | 567 | 112.7 |
| C | 0 | 10 | 363896 | 2677.46 | 582 | 587 | 135.7 |
| C | 15 | 214 | 228691 | 1681.05 | 582 | 587 | 135.7 |
| C | 9 | 54 | 74435 | 544.23 | 582 | 587 | 135.7 |
| D | 2 | 120 | 596613 | 4156.96 | 587 | 572 | 143.4 |
| D | 5 | 222 | 231715 | 1612.06 | 587 | 572 | 143.4 |
| D | 1 | 52 | 125801 | 873.38 | 587 | 572 | 143.4 |
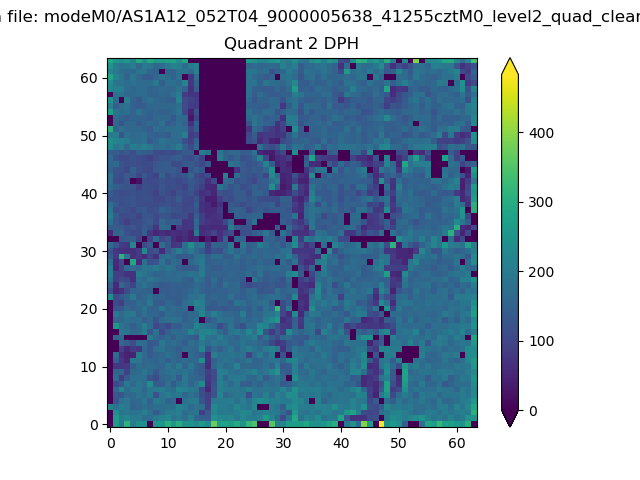
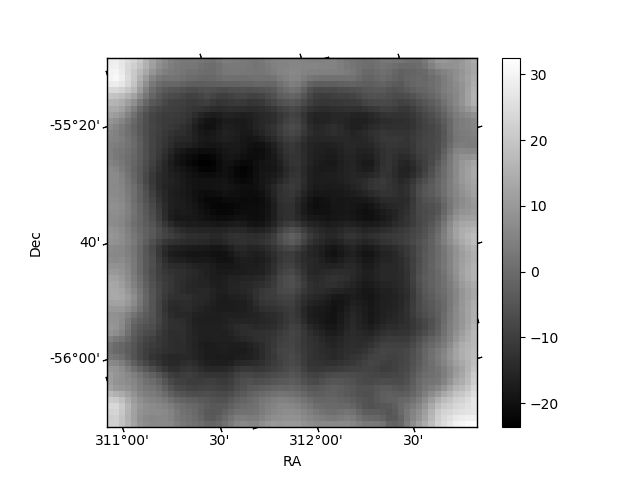
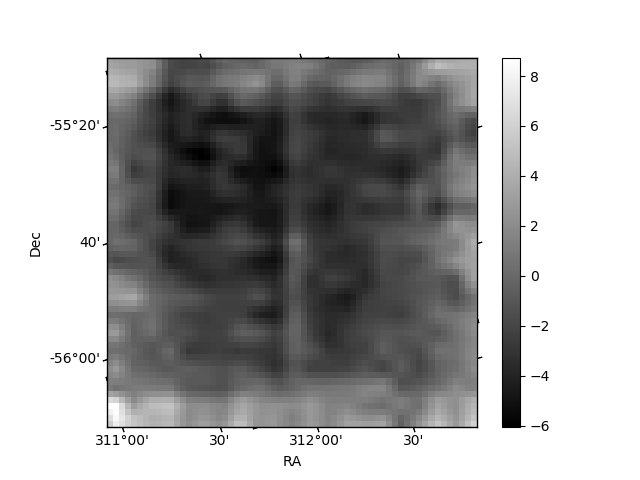
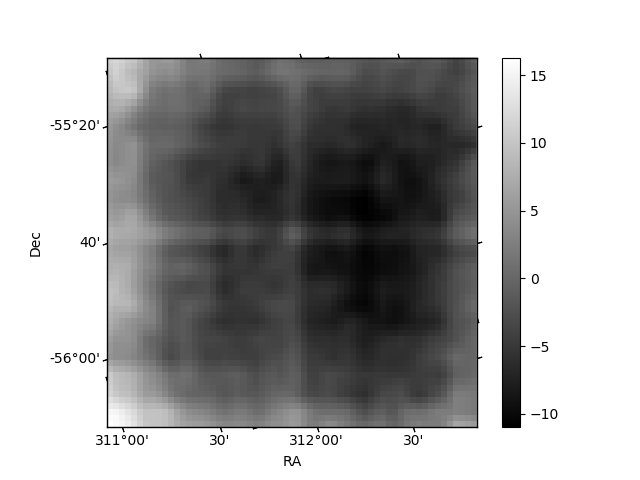
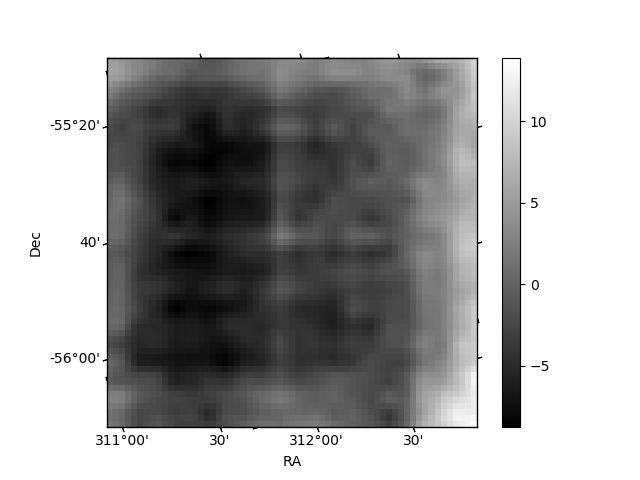
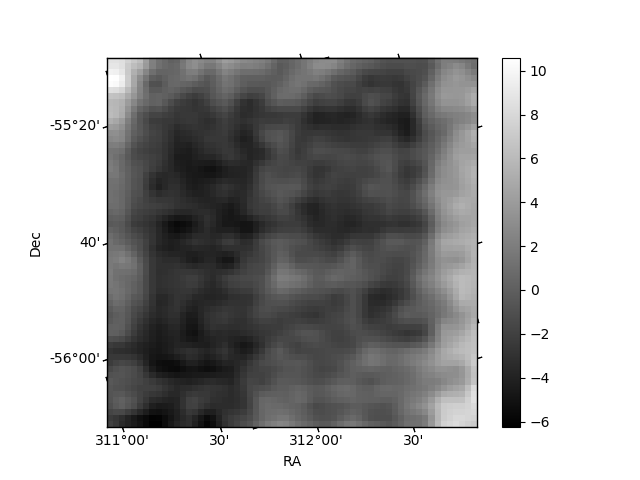
Histogram calculated using DETX and DETY for each event in the final _common_clean file
| Quadrant A | 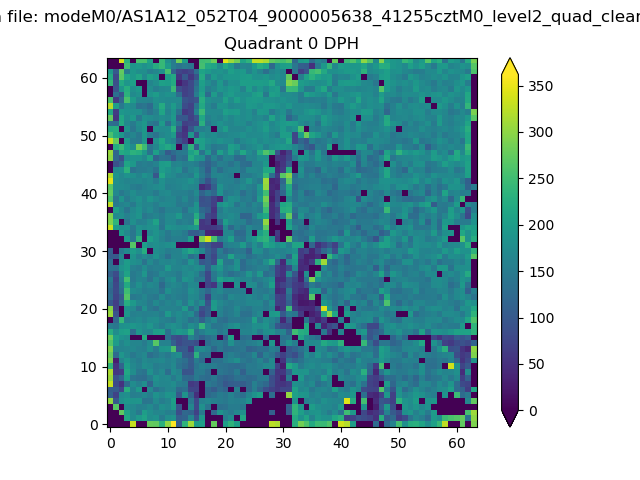 |
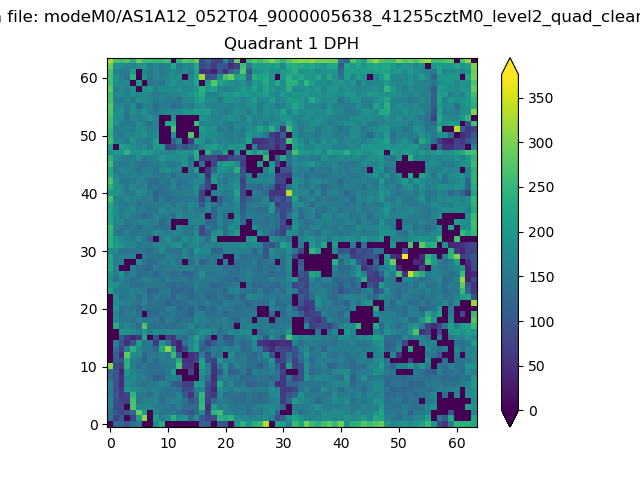 |
Quadrant B |
|---|---|---|---|
| Quadrant D | 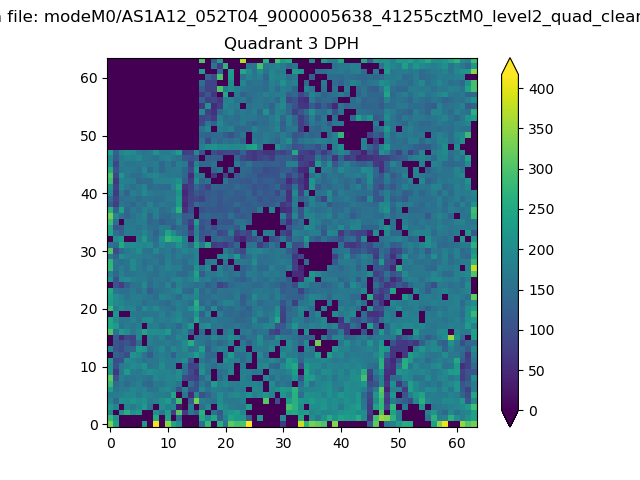 |
 |
Quadrant C |
| Plot type | Count rate plots | Images |
|---|---|---|
| Comparison with Poisson distribution Blue bars denote a histogram of data divided into 1 sec bins. Red curve is a Poisson curve with rate = median count rate of data. |
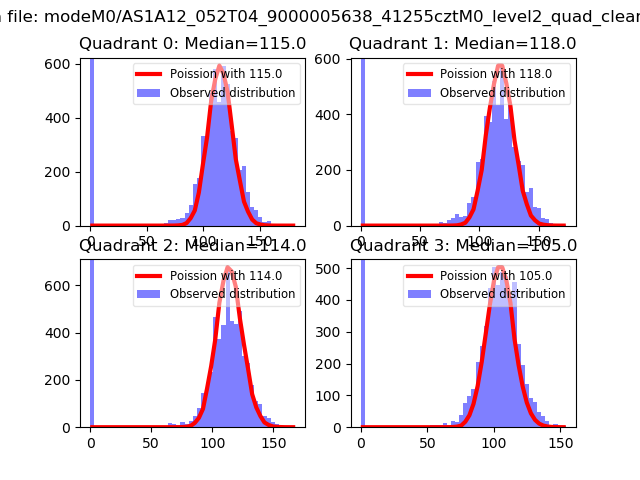 |
 |
| Quadrant-wise count rates Data is divided into 100 sec bins |
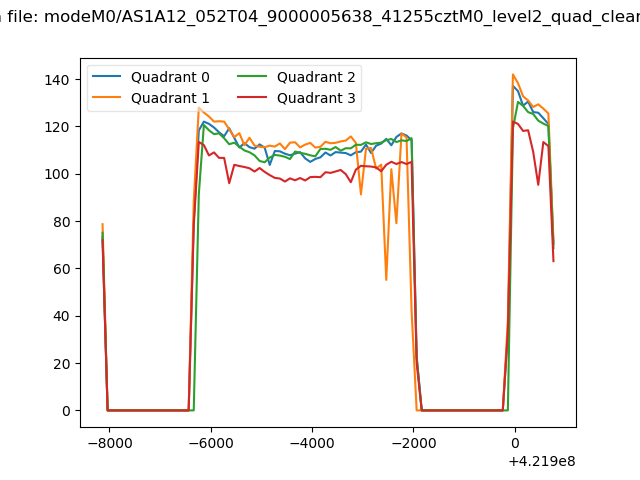 |
|
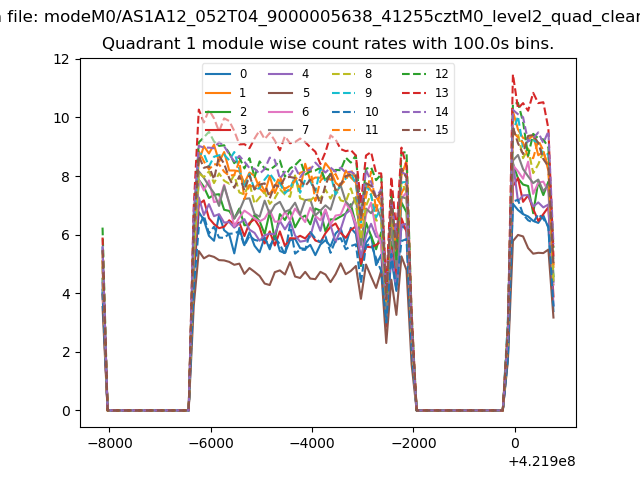
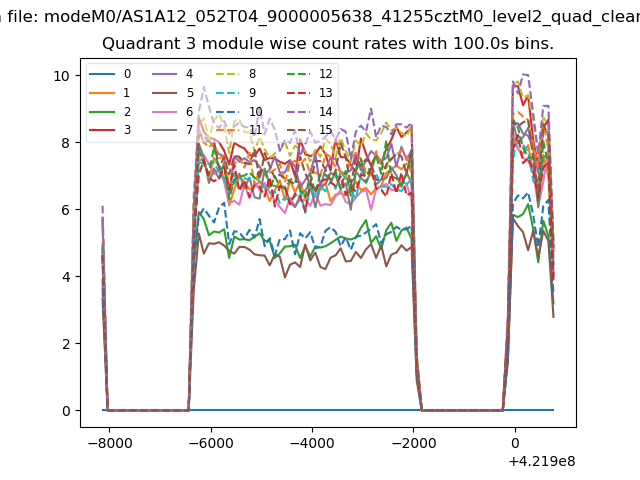
| Module-wise count rates for Quadrant A Data is divided into 100 sec bins |
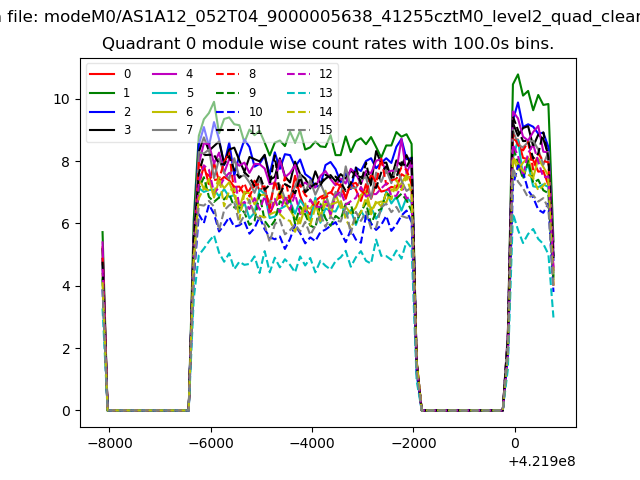 |
 |
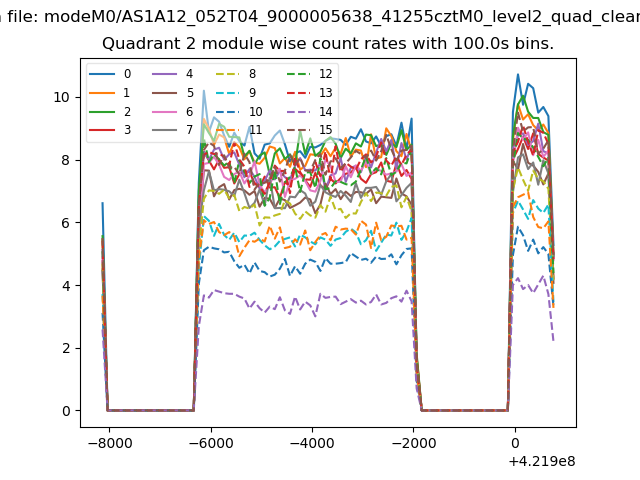
| Module-wise count rates for Quadrant B Data is divided into 100 sec bins |
 |
 |
| Module-wise count rates for Quadrant C Data is divided into 100 sec bins |
 |
 |
| Module-wise count rates for Quadrant D Data is divided into 100 sec bins |
 |
 |
| Parameter | Plot |
|---|---|
| CZT HV Monitor | 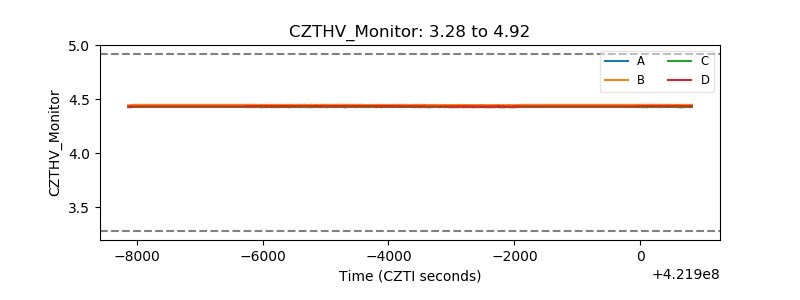 |
| D_VDD | 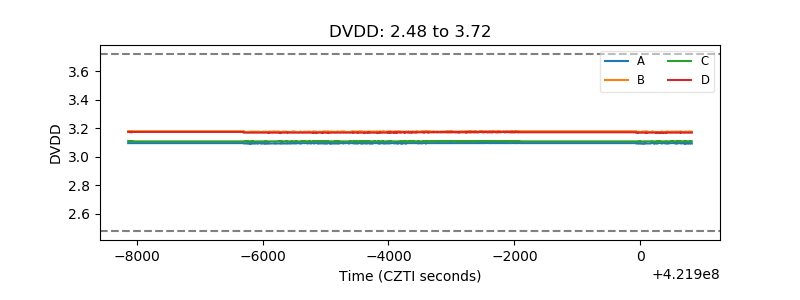 |
| Temperature 1 | 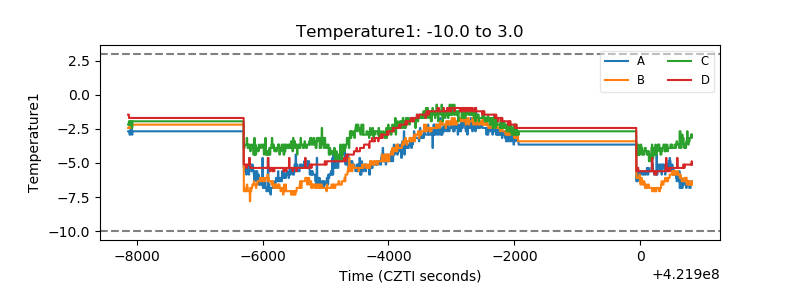 |
| Veto HV Monitor | 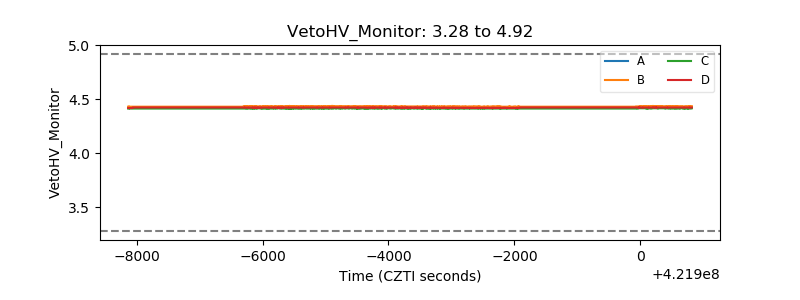 |
| Veto LLD | 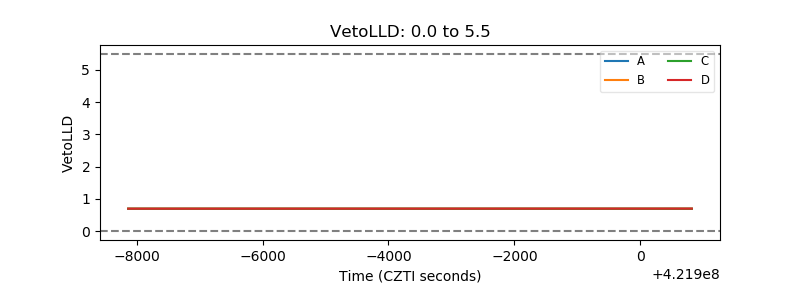 |
| Alpha Counter | 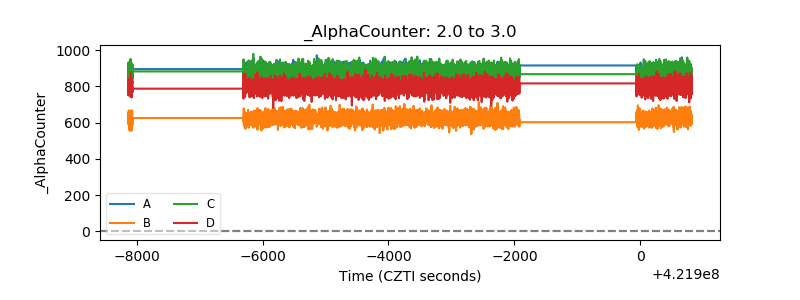 |
| _CPM_Rate | 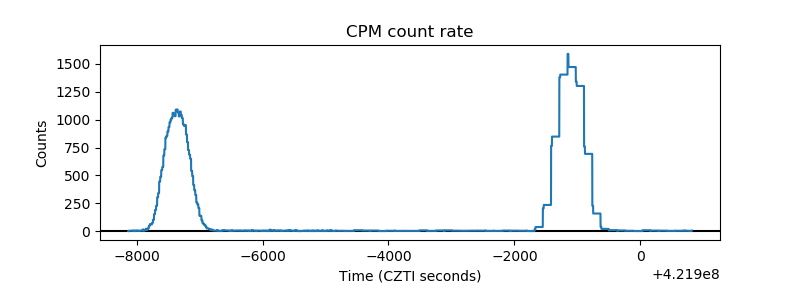 |
| CZT Counter | 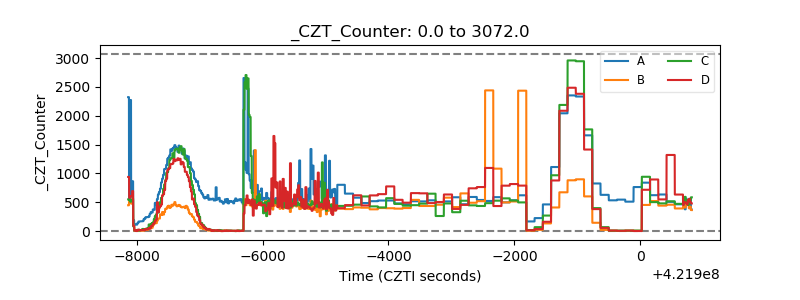 |
| +2.5 Volts monitor | 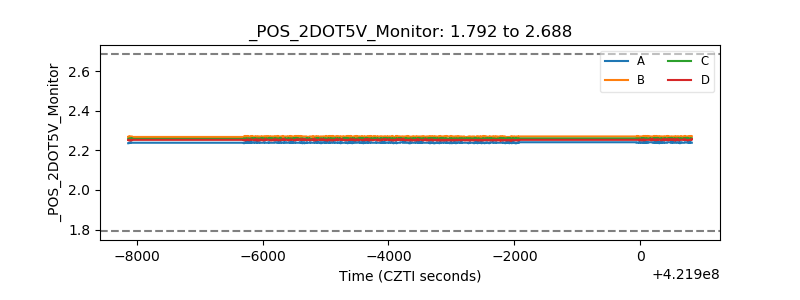 |
| +5 Volts monitor | 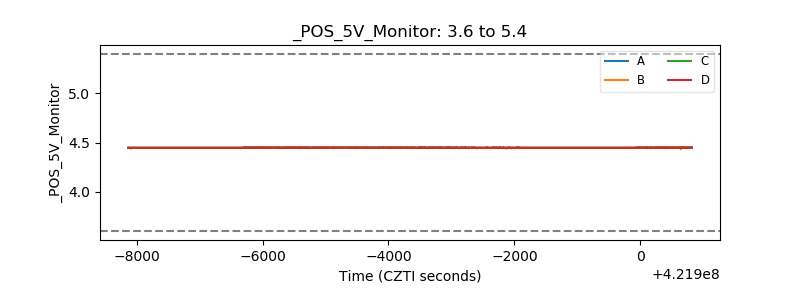 |
| _ROLL_ROT | 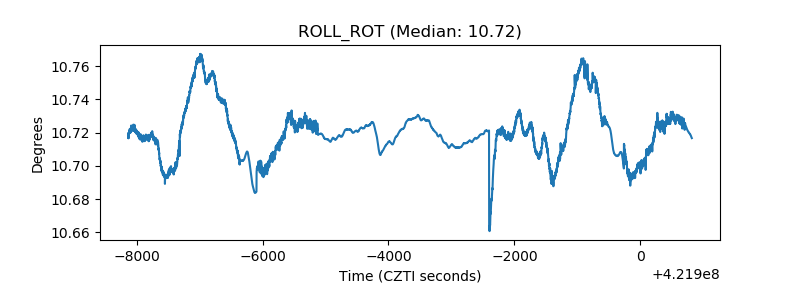 |
| _Roll_DEC | 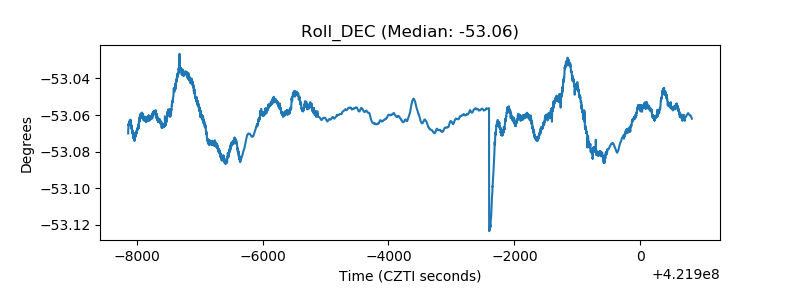 |
| _Roll_RA | 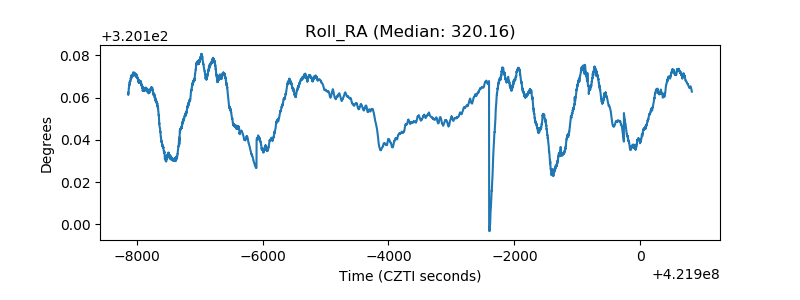 |
| Veto Counter | 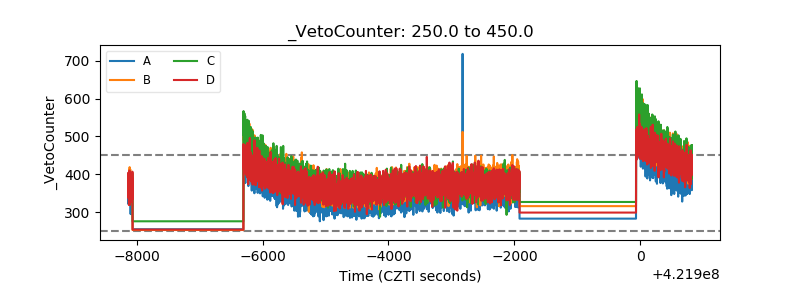 |