| Param | Original file | Final file |
|---|---|---|
| Filename | modeM0/AS1A12_052T04_9000005638_41257cztM0_level2.fits | modeM0/AS1A12_052T04_9000005638_41257cztM0_level2_quad_clean.evt |
| Size (bytes) | 386,634,240 | 88,064,640 |
| Size | 368.7 MB | 84.0 MB |
| Events in quadrant A | 2,752,731 | 611,059 |
| Events in quadrant B | 2,768,557 | 621,478 |
| Events in quadrant C | 3,977,595 | 582,740 |
| Events in quadrant D | 4,425,057 | 501,448 |
| Mode M9 | |||
|---|---|---|---|
| Quadrant | BADHDUFLAG | Total packets | Discarded packets |
| A | 0 | 28 | 0 |
| B | 0 | 28 | 0 |
| C | 0 | 28 | 0 |
| D | 0 | 29 | 0 |
| Mode SS | |||
|---|---|---|---|
| Quadrant | BADHDUFLAG | Total packets | Discarded packets |
| A | 0 | 102 | 0 |
| B | 0 | 102 | 0 |
| C | 0 | 102 | 0 |
| D | 0 | 102 | 0 |
| Mode M0 | |||
|---|---|---|---|
| Quadrant | BADHDUFLAG | Total packets | Discarded packets |
| A | 0 | 11062 | 3 |
| B | 0 | 11536 | 2 |
| C | 0 | 15043 | 2 |
| D | 0 | 16474 | 2 |
| Quadrant | Total seconds | Saturated seconds | Saturation percentage |
|---|---|---|---|
| A | 4989 | 11 | 0.220485% |
| B | 4989 | 65 | 1.302866% |
| C | 4989 | 287 | 5.752656% |
| D | 4989 | 639 | 12.808178% |
Noise dominated data is calculated using 1-second bins in cleaned event files. If a bin has >2000 counts, and if more than 50% of those come from <1% of pixels, then it is considered to be noise-dominated and hence unusable.
| Quadrant | # 1 sec bins | Bins with >0 counts | Bins with >2000 counts | High rate bins dominated by noise | Noise dominated (total time) | Noise dominated (detector-on time) | Marked lightcurve |
|---|---|---|---|---|---|---|---|
| A | 7083 | 4990 | 2 | 2 | 0.03% | 0.04% | 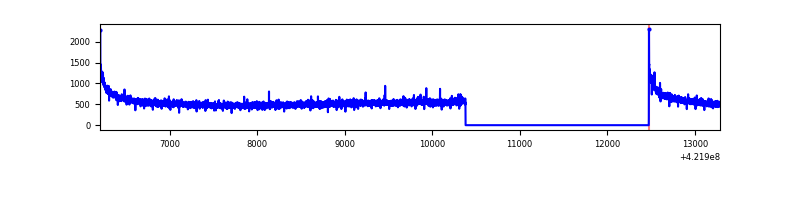 |
| B | 7083 | 4990 | 40 | 40 | 0.56% | 0.80% | 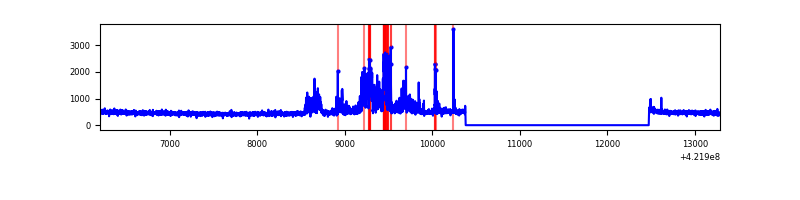 |
| C | 7083 | 4990 | 273 | 273 | 3.85% | 5.47% | 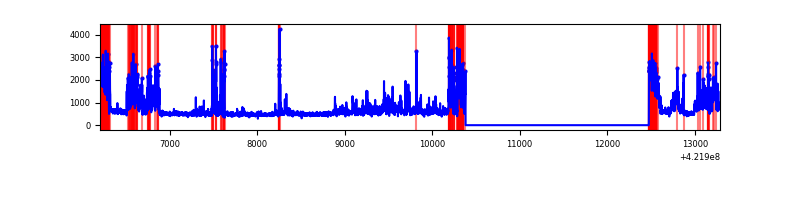 |
| D | 7083 | 4990 | 583 | 583 | 8.23% | 11.68% | 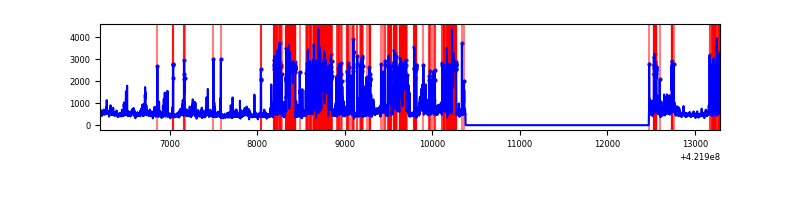 |
Top three noisy pixels from each quadrant. If the there are fewer than three noisy pixels in the level2.evt file, extra rows are filled as -1
| Pixel properties | Quadrant properties | ||||||
|---|---|---|---|---|---|---|---|
| Quadrant | DetID | PixID | Counts | Sigma | Mean | Median | Sigma |
| A | 10 | 83 | 497008 | 4220.86 | 579 | 568 | 117.6 |
| A | 13 | 6 | 13665 | 111.35 | 579 | 568 | 117.6 |
| A | 13 | 254 | 8271 | 65.49 | 579 | 568 | 117.6 |
| B | 0 | 186 | 461906 | 4292.96 | 570 | 555 | 107.5 |
| B | 5 | 255 | 27980 | 255.19 | 570 | 555 | 107.5 |
| B | 0 | 245 | 16239 | 145.94 | 570 | 555 | 107.5 |
| C | 9 | 54 | 1266685 | 9773.75 | 561 | 565 | 129.5 |
| C | 0 | 10 | 296183 | 2282.01 | 561 | 565 | 129.5 |
| C | 15 | 214 | 216697 | 1668.42 | 561 | 565 | 129.5 |
| D | 1 | 52 | 1252388 | 9620.43 | 535 | 521 | 130.1 |
| D | 13 | 249 | 724298 | 5562.13 | 535 | 521 | 130.1 |
| D | 5 | 222 | 165381 | 1266.93 | 535 | 521 | 130.1 |
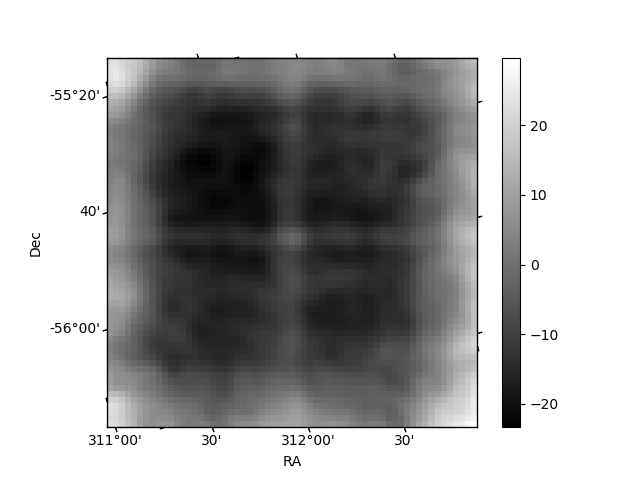
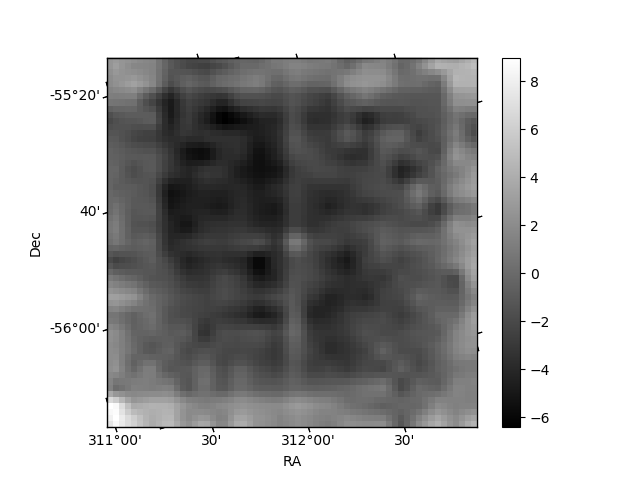
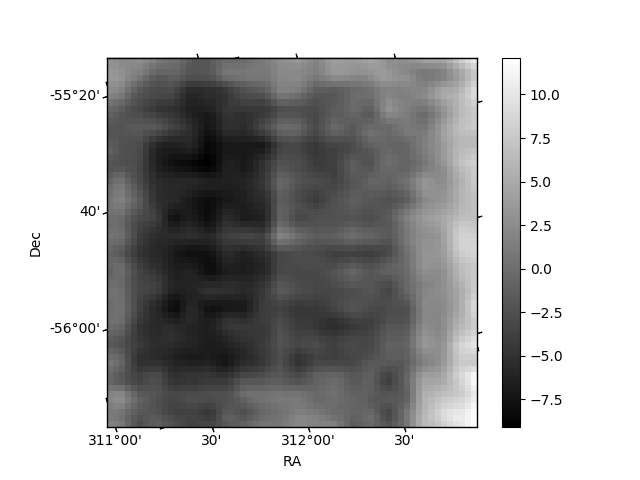
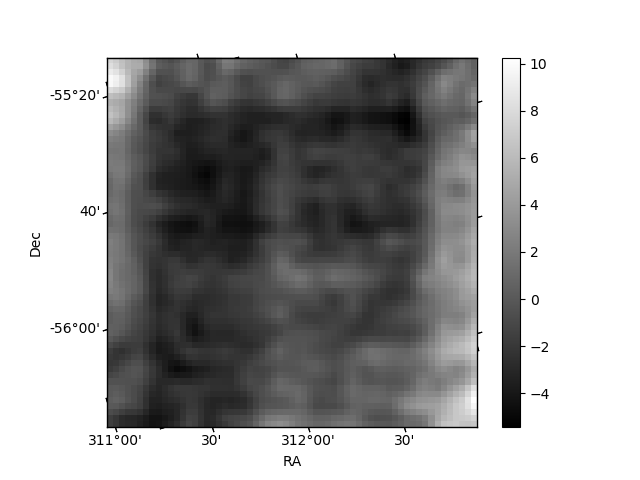
Histogram calculated using DETX and DETY for each event in the final _common_clean file
| Quadrant A | 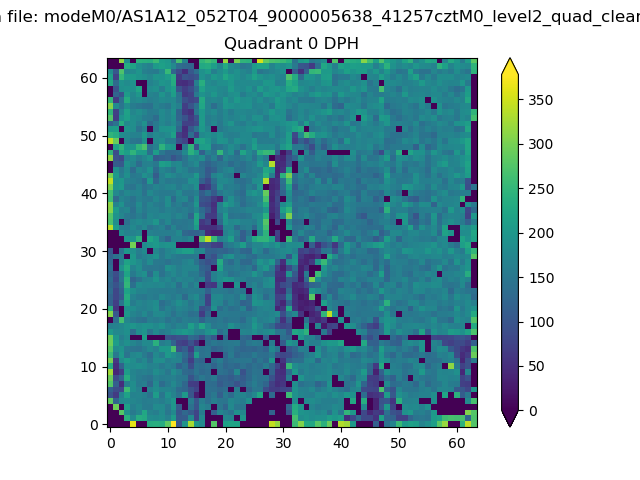 |
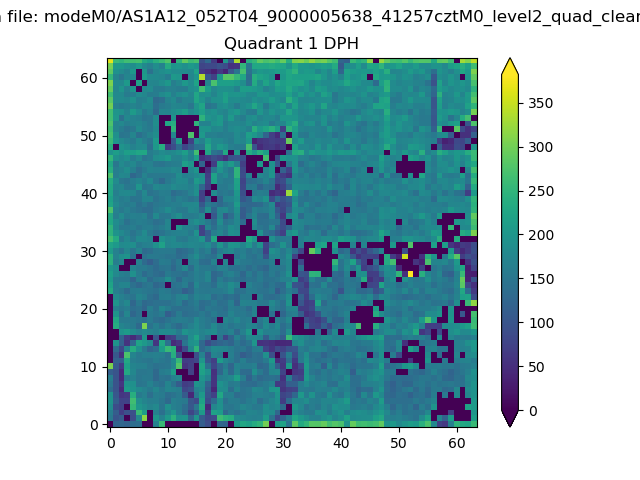 |
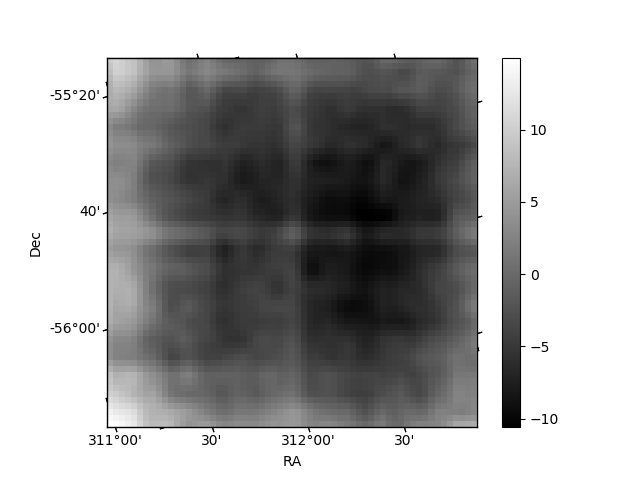
Quadrant B |
|---|---|---|---|
| Quadrant D | 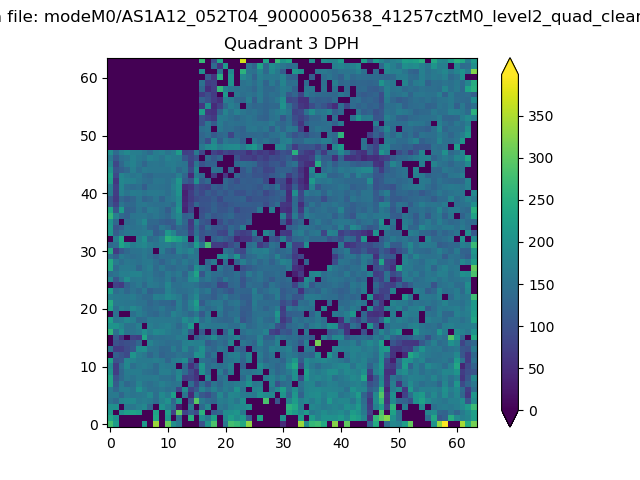 |
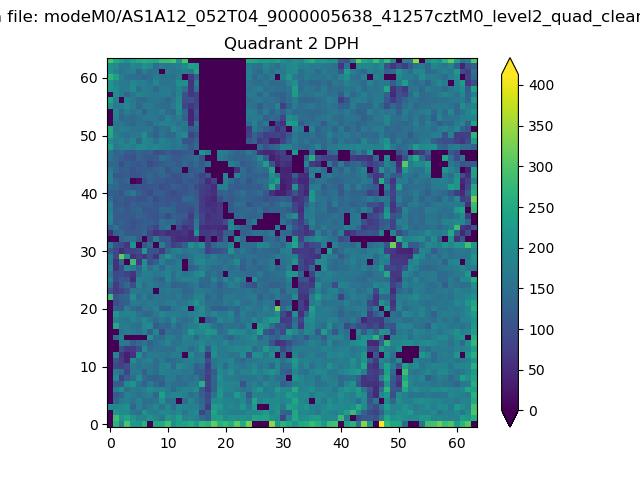 |
Quadrant C |
| Plot type | Count rate plots | Images |
|---|---|---|
| Comparison with Poisson distribution Blue bars denote a histogram of data divided into 1 sec bins. Red curve is a Poisson curve with rate = median count rate of data. |
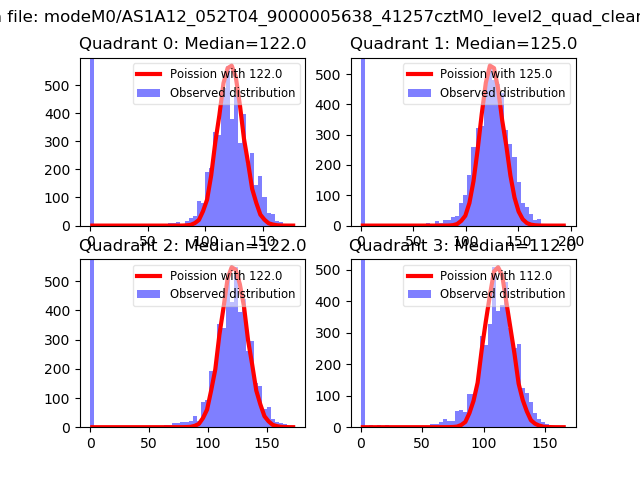 |
 |
| Quadrant-wise count rates Data is divided into 100 sec bins |
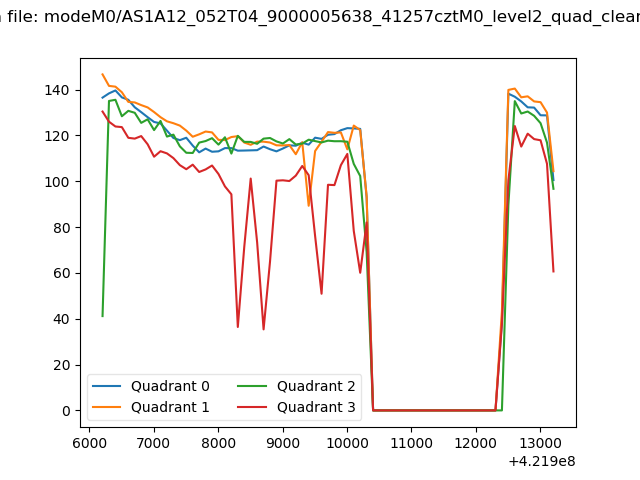 |
|
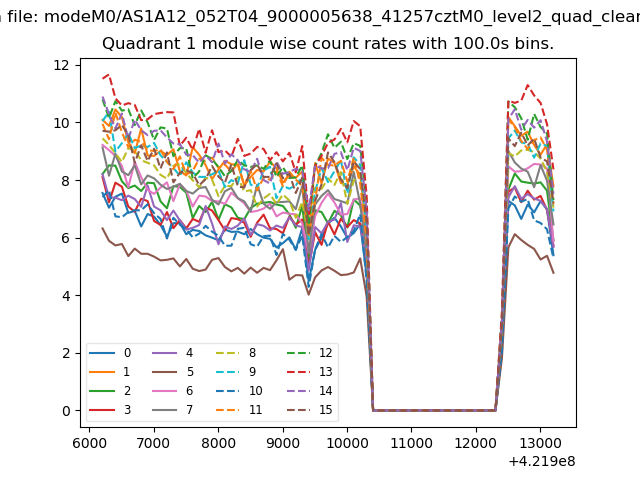
| Module-wise count rates for Quadrant A Data is divided into 100 sec bins |
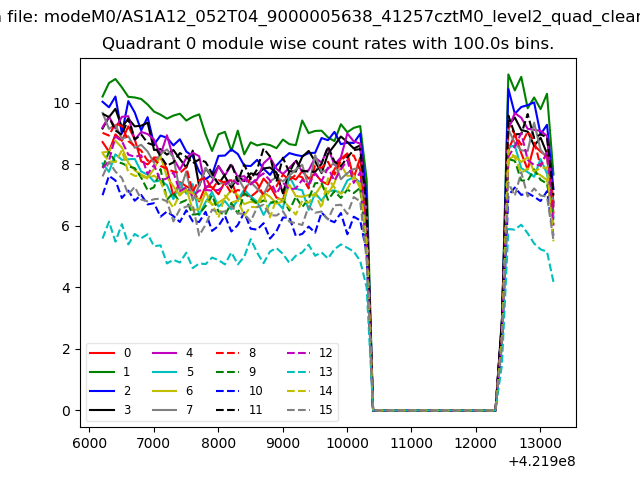 |
 |
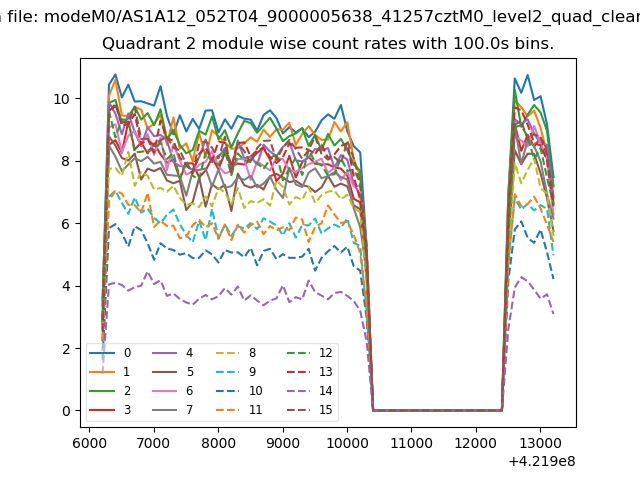
| Module-wise count rates for Quadrant B Data is divided into 100 sec bins |
 |
 |
| Module-wise count rates for Quadrant C Data is divided into 100 sec bins |
 |
 |
| Module-wise count rates for Quadrant D Data is divided into 100 sec bins |
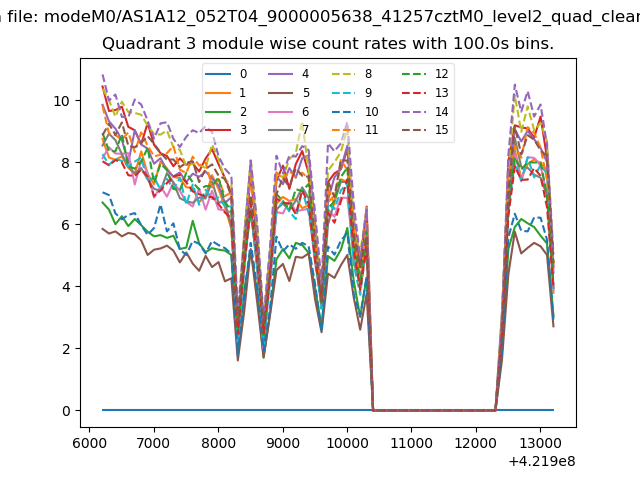 |
 |
| Parameter | Plot |
|---|---|
| CZT HV Monitor | 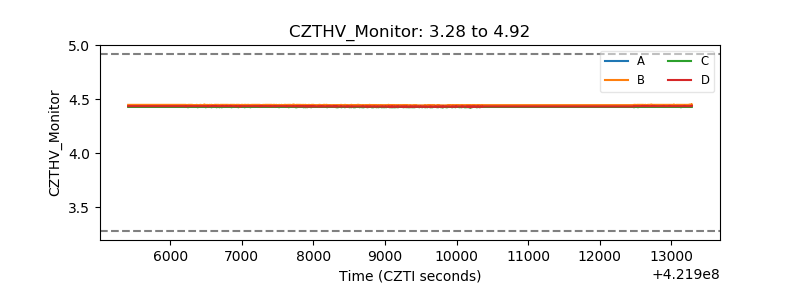 |
| D_VDD | 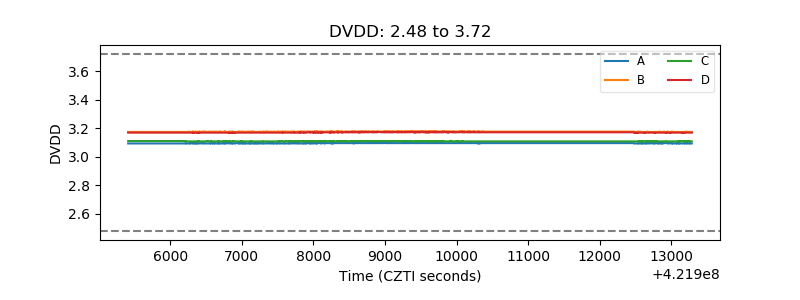 |
| Temperature 1 | 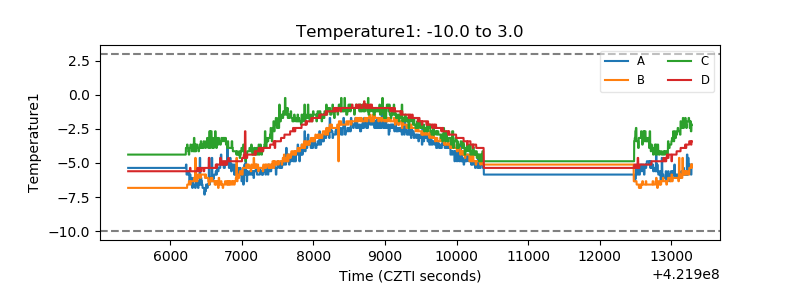 |
| Veto HV Monitor | 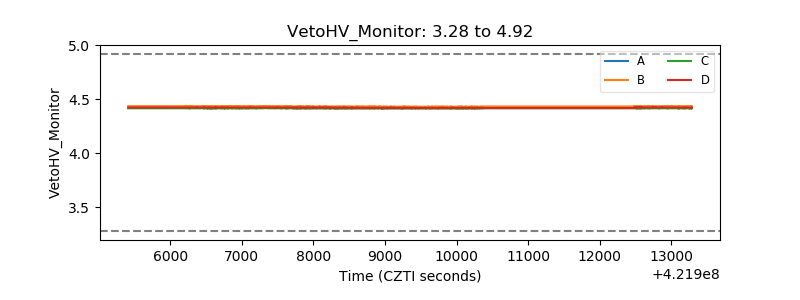 |
| Veto LLD | 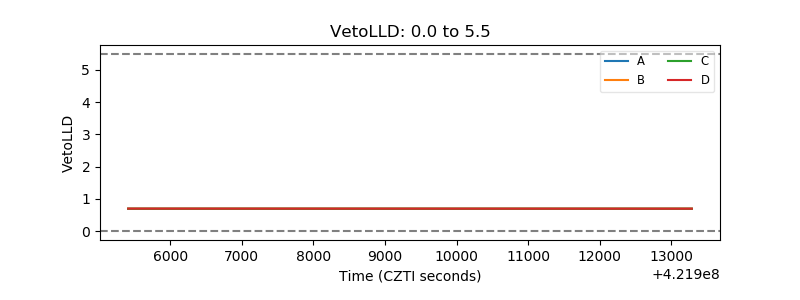 |
| Alpha Counter | 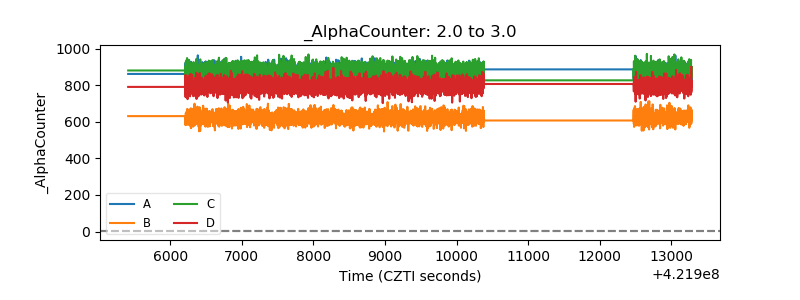 |
| _CPM_Rate | 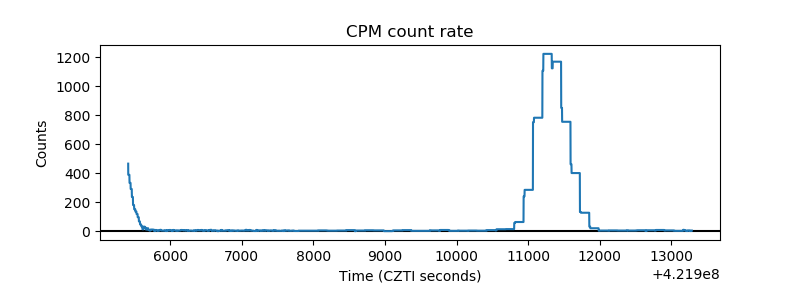 |
| CZT Counter | 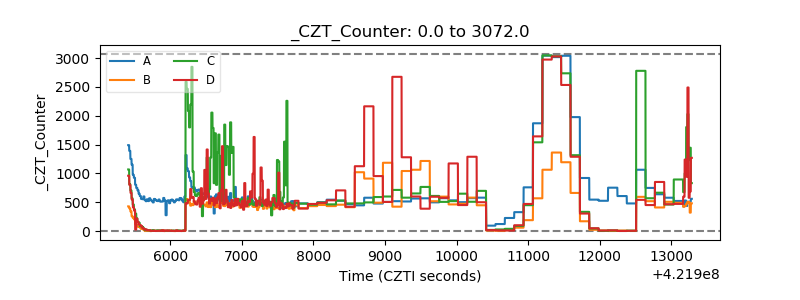 |
| +2.5 Volts monitor | 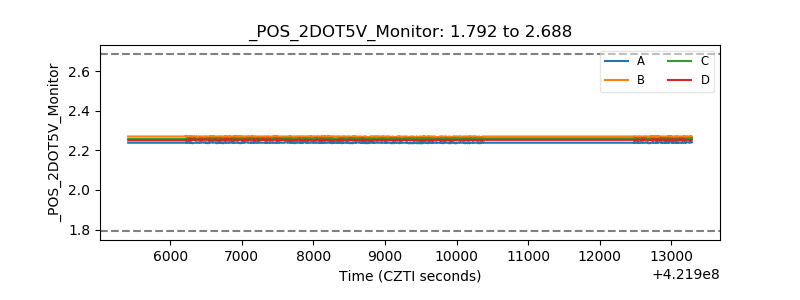 |
| +5 Volts monitor | 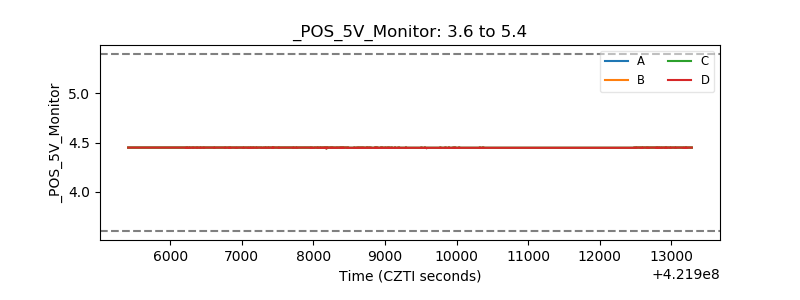 |
| _ROLL_ROT | 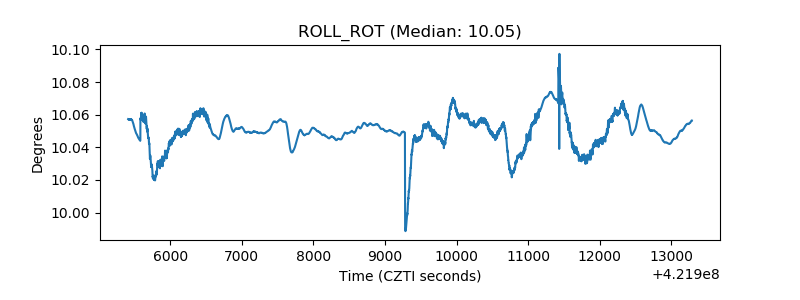 |
| _Roll_DEC | 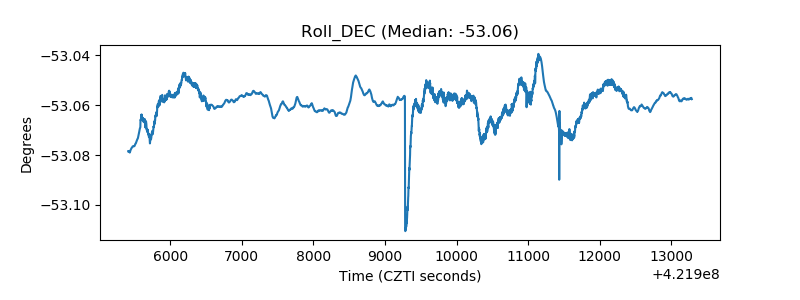 |
| _Roll_RA | 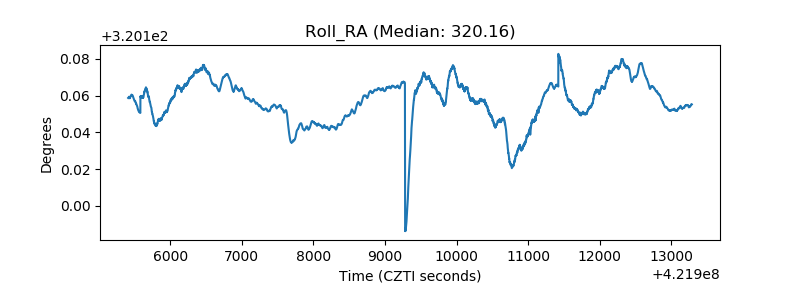 |
| Veto Counter | 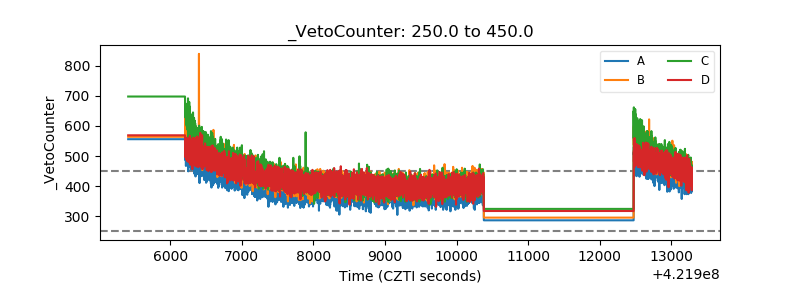 |