| Param | Original file | Final file |
|---|---|---|
| Filename | modeM0/AS1A12_052T04_9000005638_41258cztM0_level2.fits | modeM0/AS1A12_052T04_9000005638_41258cztM0_level2_quad_clean.evt |
| Size (bytes) | 497,692,800 | 79,320,960 |
| Size | 474.6 MB | 75.6 MB |
| Events in quadrant A | 2,709,748 | 594,672 |
| Events in quadrant B | 2,346,981 | 607,135 |
| Events in quadrant C | 4,309,750 | 565,052 |
| Events in quadrant D | 8,673,444 | 289,527 |
| Mode M9 | |||
|---|---|---|---|
| Quadrant | BADHDUFLAG | Total packets | Discarded packets |
| A | 0 | 23 | 0 |
| B | 0 | 23 | 0 |
| C | 0 | 23 | 0 |
| D | 0 | 24 | 0 |
| Mode SS | |||
|---|---|---|---|
| Quadrant | BADHDUFLAG | Total packets | Discarded packets |
| A | 0 | 100 | 0 |
| B | 0 | 100 | 0 |
| C | 0 | 100 | 0 |
| D | 0 | 100 | 0 |
| Mode M0 | |||
|---|---|---|---|
| Quadrant | BADHDUFLAG | Total packets | Discarded packets |
| A | 0 | 10870 | 3 |
| B | 0 | 10183 | 2 |
| C | 0 | 16100 | 2 |
| D | 0 | 29104 | 2 |
| Quadrant | Total seconds | Saturated seconds | Saturation percentage |
|---|---|---|---|
| A | 4927 | 10 | 0.202963% |
| B | 4927 | 5 | 0.101482% |
| C | 4927 | 267 | 5.419119% |
| D | 4927 | 2552 | 51.796225% |
Noise dominated data is calculated using 1-second bins in cleaned event files. If a bin has >2000 counts, and if more than 50% of those come from <1% of pixels, then it is considered to be noise-dominated and hence unusable.
| Quadrant | # 1 sec bins | Bins with >0 counts | Bins with >2000 counts | High rate bins dominated by noise | Noise dominated (total time) | Noise dominated (detector-on time) | Marked lightcurve |
|---|---|---|---|---|---|---|---|
| A | 7080 | 4928 | 3 | 3 | 0.04% | 0.06% | 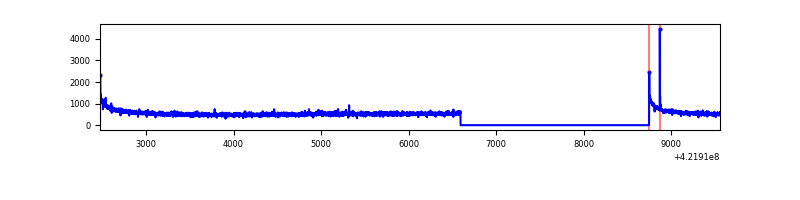 |
| B | 7080 | 4928 | 2 | 2 | 0.03% | 0.04% | 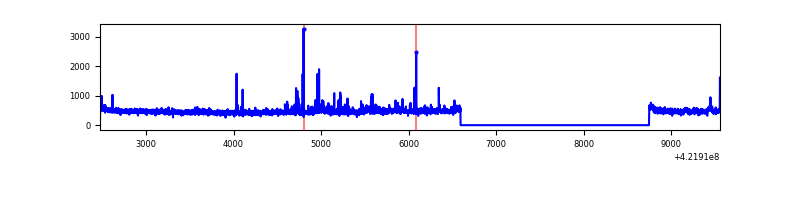 |
| C | 7080 | 4928 | 239 | 239 | 3.38% | 4.85% | 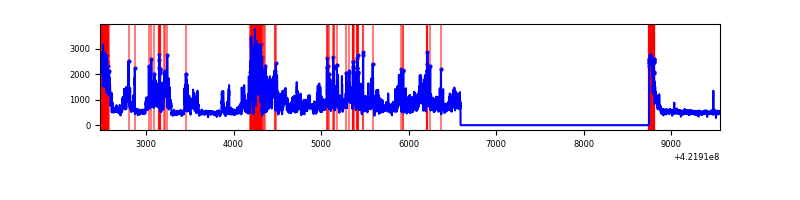 |
| D | 7080 | 4927 | 2474 | 2474 | 34.94% | 50.21% | 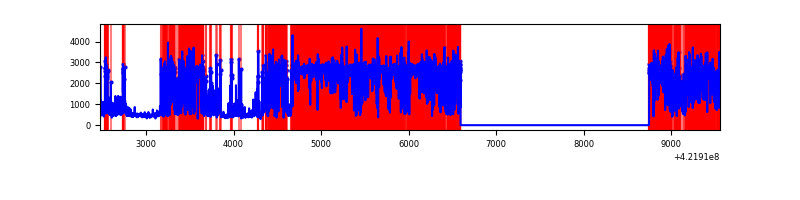 |
Top three noisy pixels from each quadrant. If the there are fewer than three noisy pixels in the level2.evt file, extra rows are filled as -1
| Pixel properties | Quadrant properties | ||||||
|---|---|---|---|---|---|---|---|
| Quadrant | DetID | PixID | Counts | Sigma | Mean | Median | Sigma |
| A | 10 | 83 | 494454 | 4302.83 | 567 | 555 | 114.8 |
| A | 13 | 6 | 7741 | 62.6 | 567 | 555 | 114.8 |
| A | 13 | 254 | 7573 | 61.14 | 567 | 555 | 114.8 |
| B | 0 | 245 | 48119 | 447.65 | 557 | 542 | 106.3 |
| B | 4 | 249 | 38809 | 360.05 | 557 | 542 | 106.3 |
| B | 0 | 186 | 32265 | 298.48 | 557 | 542 | 106.3 |
| C | 9 | 54 | 1625721 | 12878.21 | 546 | 550 | 126.2 |
| C | 0 | 10 | 336935 | 2665.58 | 546 | 550 | 126.2 |
| C | 15 | 214 | 213348 | 1686.25 | 546 | 550 | 126.2 |
| D | 1 | 52 | 6697417 | 67423.75 | 406 | 395 | 99.3 |
| D | 5 | 222 | 250574 | 2518.73 | 406 | 395 | 99.3 |
| D | 13 | 249 | 79237 | 793.76 | 406 | 395 | 99.3 |
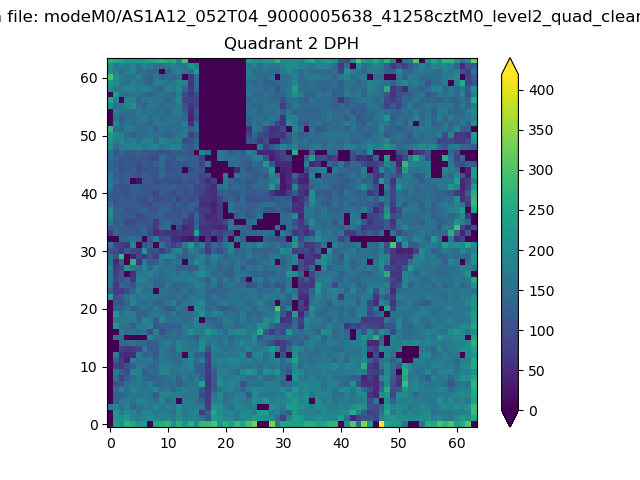
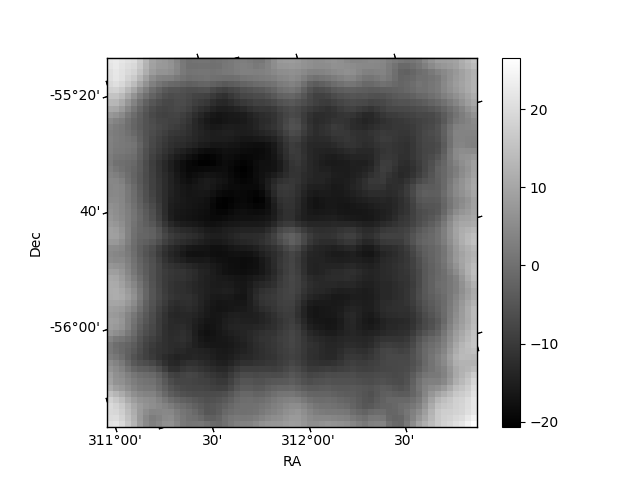
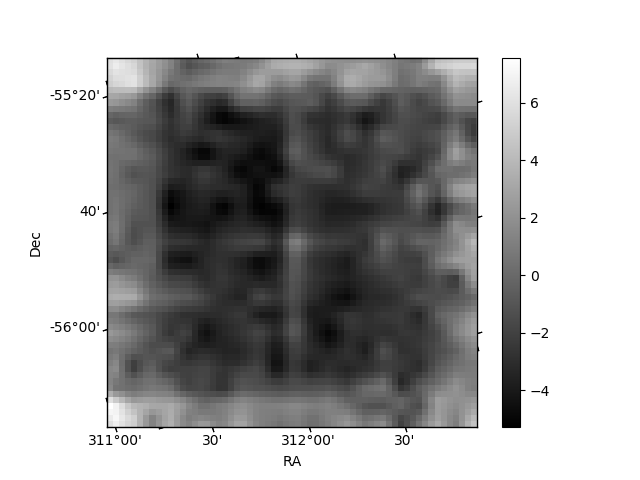
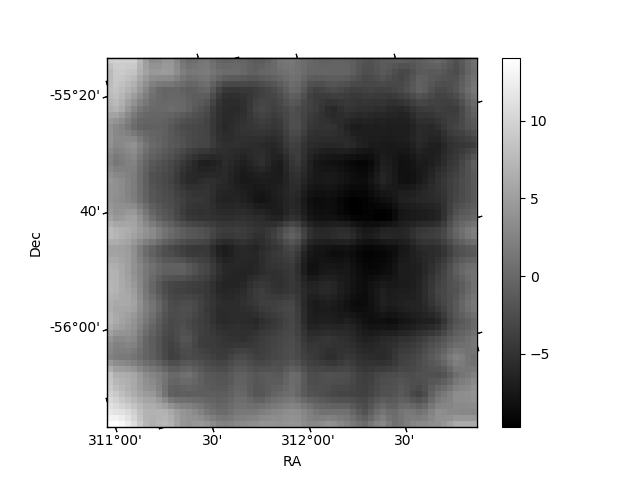
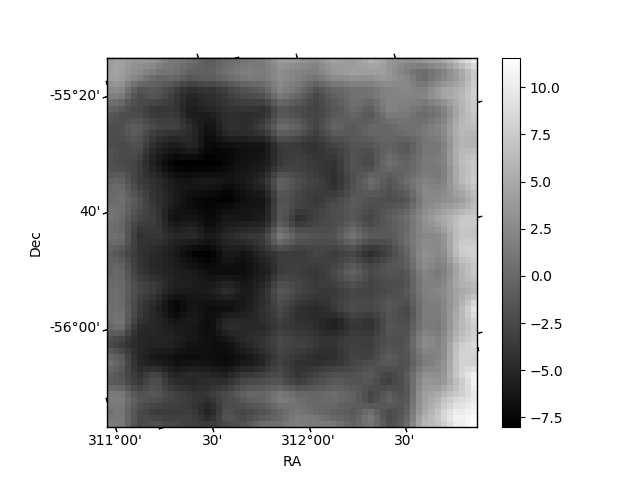
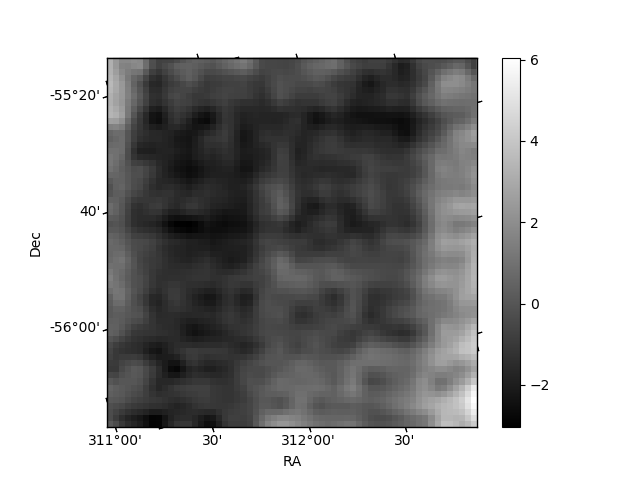
Histogram calculated using DETX and DETY for each event in the final _common_clean file
| Quadrant A | 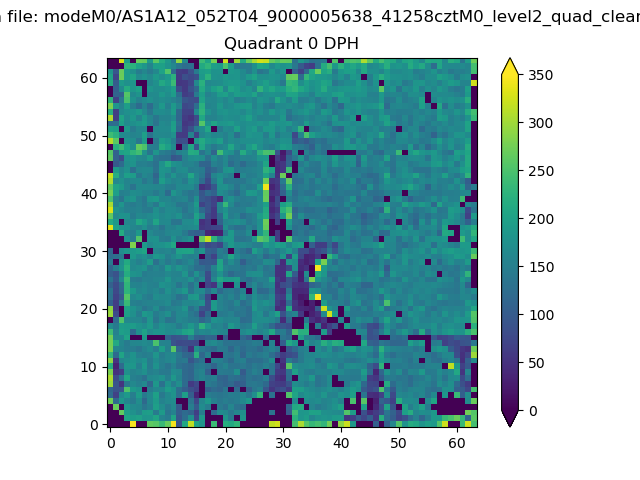 |
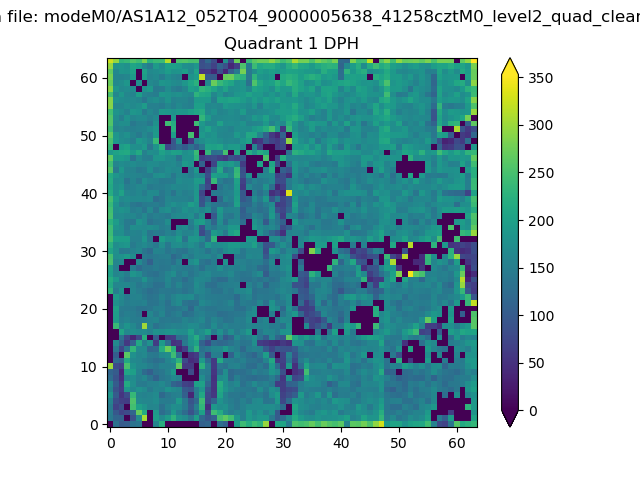 |
Quadrant B |
|---|---|---|---|
| Quadrant D | 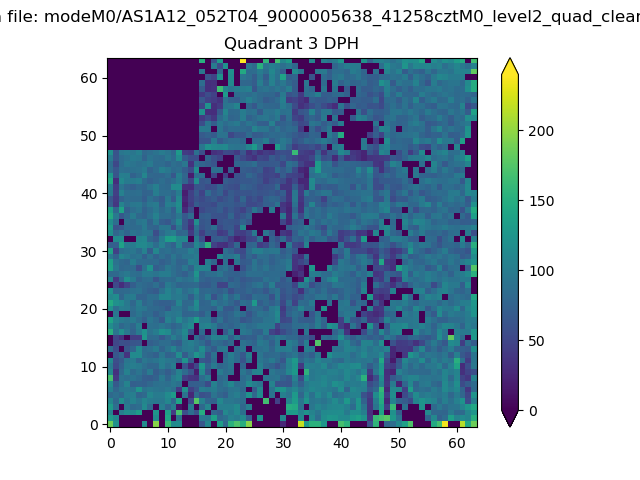 |
 |
Quadrant C |
| Plot type | Count rate plots | Images |
|---|---|---|
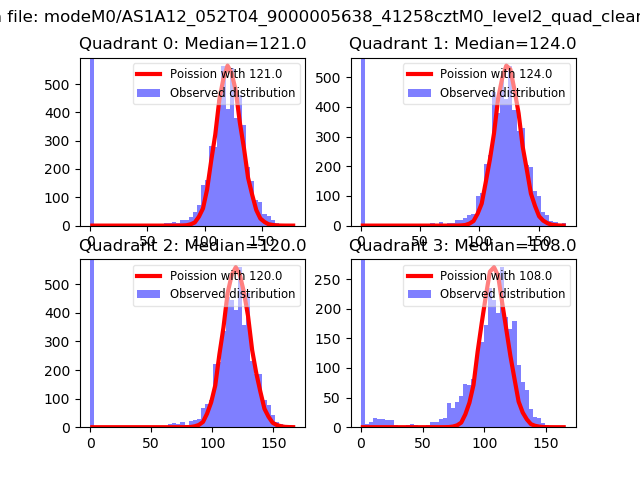
| Comparison with Poisson distribution Blue bars denote a histogram of data divided into 1 sec bins. Red curve is a Poisson curve with rate = median count rate of data. |
 |
 |
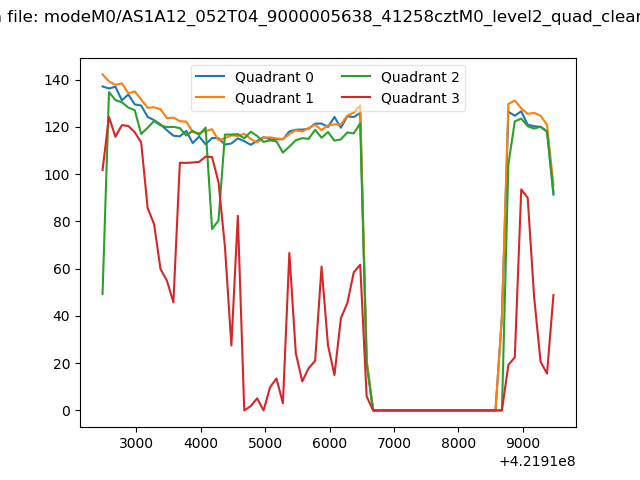
| Quadrant-wise count rates Data is divided into 100 sec bins |
 |
|
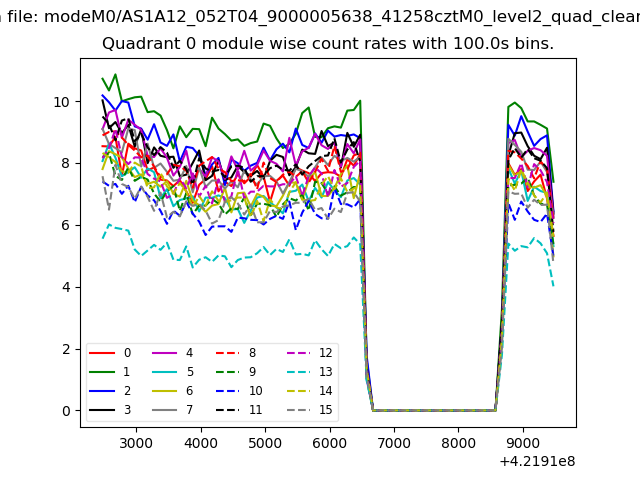
| Module-wise count rates for Quadrant A Data is divided into 100 sec bins |
 |
 |
| Module-wise count rates for Quadrant B Data is divided into 100 sec bins |
 |
 |
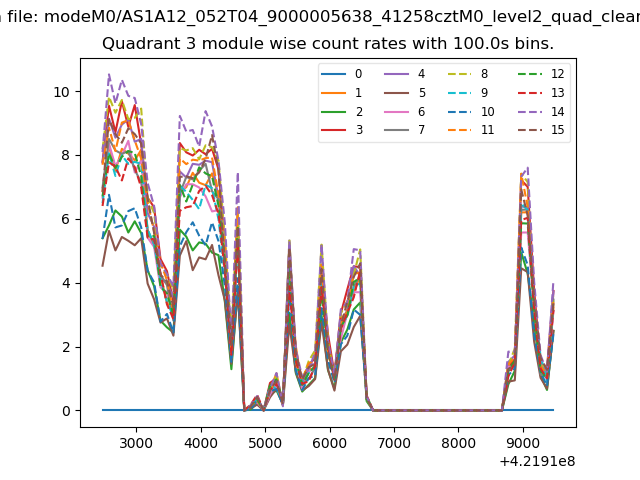
| Module-wise count rates for Quadrant C Data is divided into 100 sec bins |
 |
 |
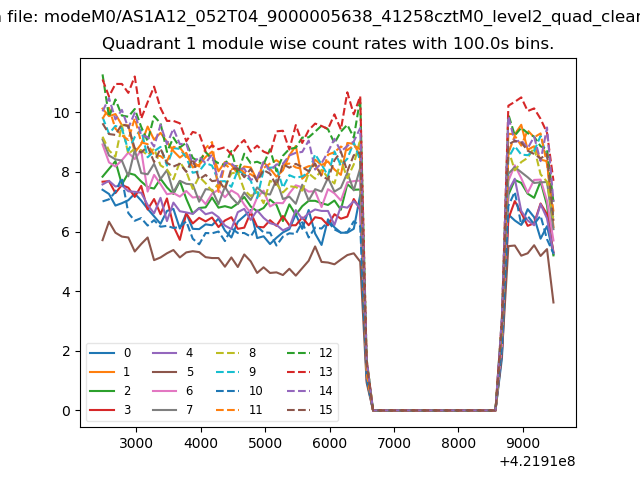
| Module-wise count rates for Quadrant D Data is divided into 100 sec bins |
 |
 |
| Parameter | Plot |
|---|---|
| CZT HV Monitor |  |
| D_VDD | 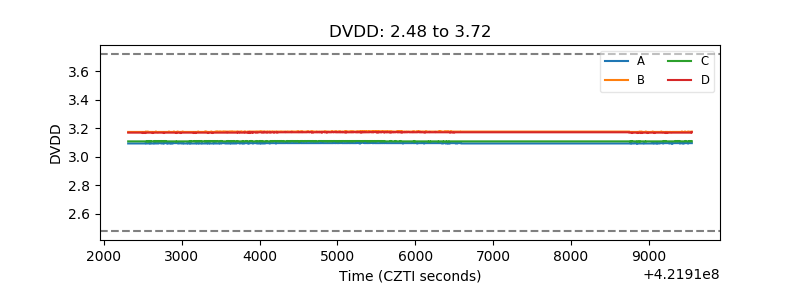 |
| Temperature 1 | 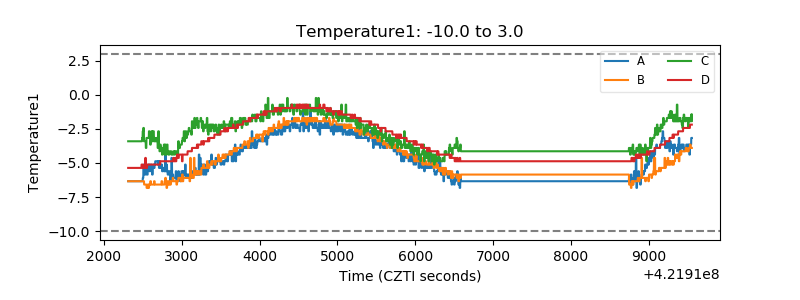 |
| Veto HV Monitor | 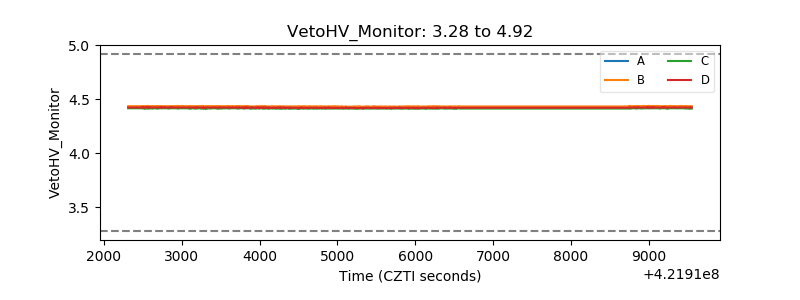 |
| Veto LLD | 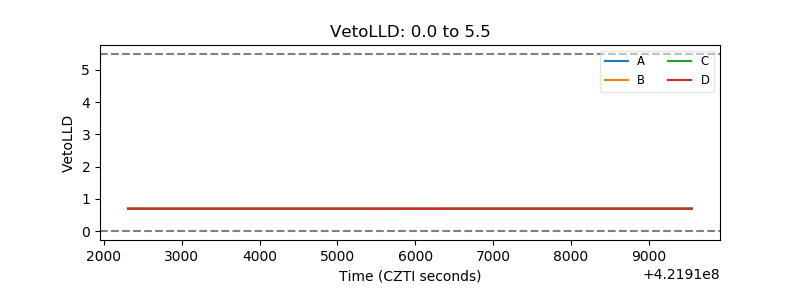 |
| Alpha Counter | 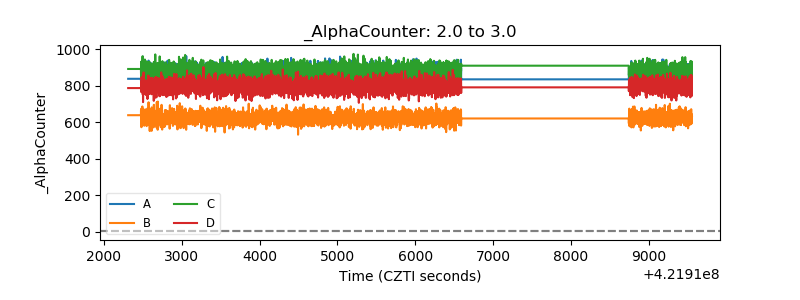 |
| _CPM_Rate |  |
| CZT Counter | 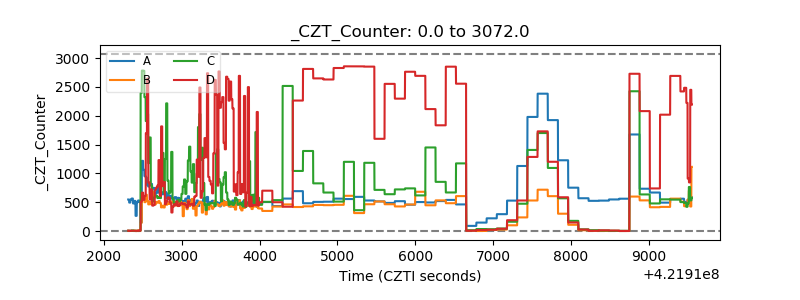 |
| +2.5 Volts monitor |  |
| +5 Volts monitor |  |
| _ROLL_ROT | 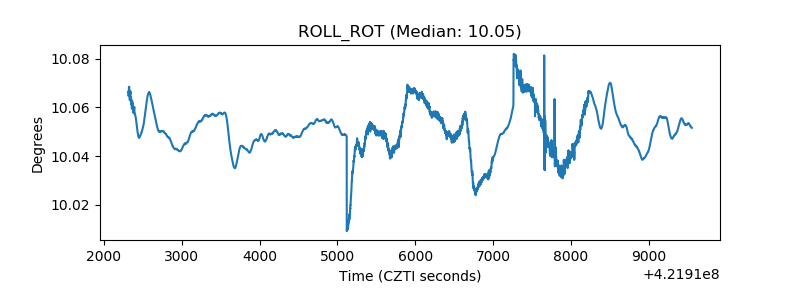 |
| _Roll_DEC | 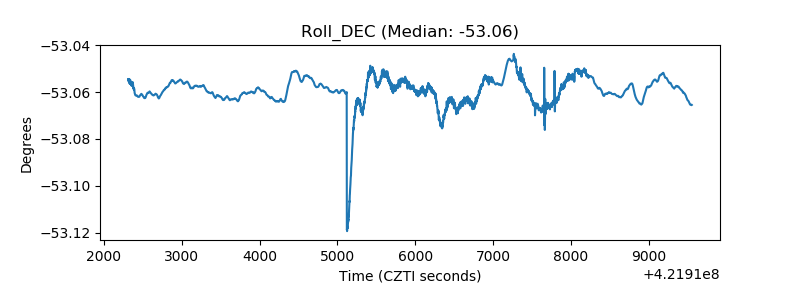 |
| _Roll_RA | 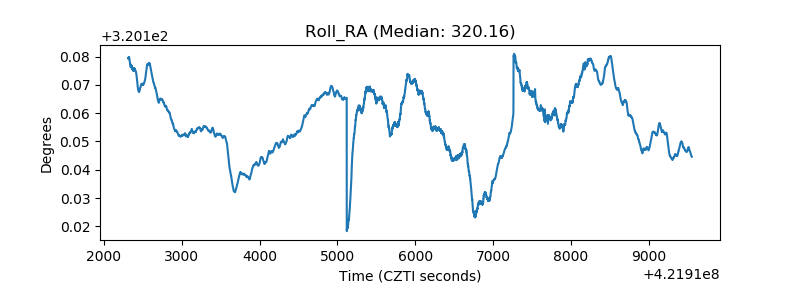 |
| Veto Counter | 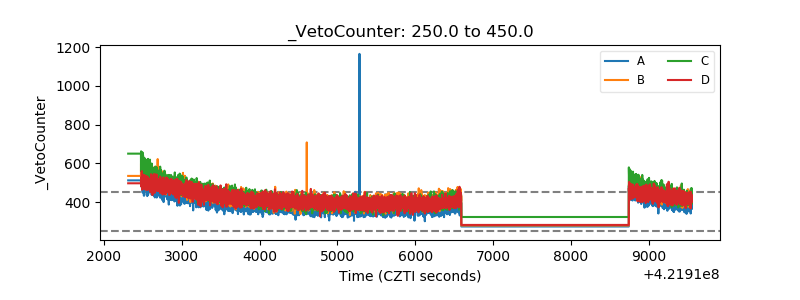 |