| Param | Original file | Final file |
|---|---|---|
| Filename | modeM0/AS1A12_052T04_9000005638_41259cztM0_level2.fits | modeM0/AS1A12_052T04_9000005638_41259cztM0_level2_quad_clean.evt |
| Size (bytes) | 455,621,760 | 82,137,600 |
| Size | 434.5 MB | 78.3 MB |
| Events in quadrant A | 2,994,640 | 599,327 |
| Events in quadrant B | 2,619,345 | 613,853 |
| Events in quadrant C | 2,845,162 | 586,907 |
| Events in quadrant D | 7,997,714 | 319,606 |
| Mode M9 | |||
|---|---|---|---|
| Quadrant | BADHDUFLAG | Total packets | Discarded packets |
| A | 0 | 26 | 0 |
| B | 0 | 26 | 0 |
| C | 0 | 26 | 0 |
| D | 0 | 27 | 0 |
| Mode SS | |||
|---|---|---|---|
| Quadrant | BADHDUFLAG | Total packets | Discarded packets |
| A | 0 | 106 | 0 |
| B | 0 | 106 | 0 |
| C | 0 | 106 | 0 |
| D | 0 | 106 | 0 |
| Mode M0 | |||
|---|---|---|---|
| Quadrant | BADHDUFLAG | Total packets | Discarded packets |
| A | 0 | 11877 | 3 |
| B | 0 | 11266 | 2 |
| C | 0 | 11675 | 2 |
| D | 0 | 27286 | 2 |
| Quadrant | Total seconds | Saturated seconds | Saturation percentage |
|---|---|---|---|
| A | 5247 | 60 | 1.143511% |
| B | 5247 | 15 | 0.285878% |
| C | 5247 | 126 | 2.401372% |
| D | 5247 | 2349 | 44.768439% |
Noise dominated data is calculated using 1-second bins in cleaned event files. If a bin has >2000 counts, and if more than 50% of those come from <1% of pixels, then it is considered to be noise-dominated and hence unusable.
| Quadrant | # 1 sec bins | Bins with >0 counts | Bins with >2000 counts | High rate bins dominated by noise | Noise dominated (total time) | Noise dominated (detector-on time) | Marked lightcurve |
|---|---|---|---|---|---|---|---|
| A | 7369 | 5248 | 45 | 45 | 0.61% | 0.86% | 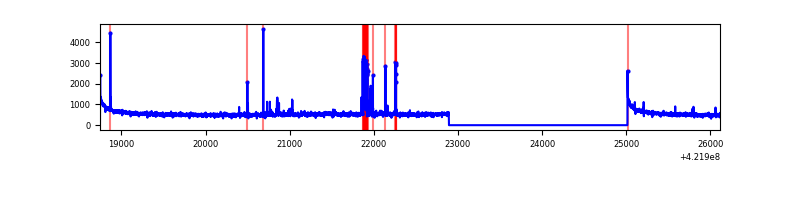 |
| B | 7369 | 5248 | 6 | 6 | 0.08% | 0.11% | 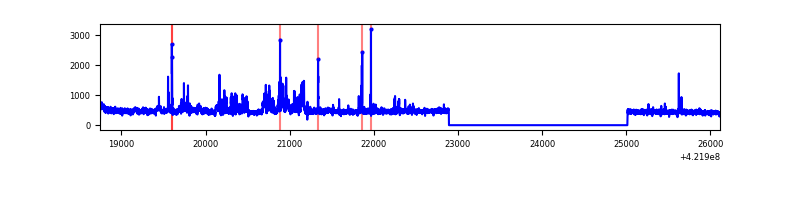 |
| C | 7369 | 5248 | 124 | 124 | 1.68% | 2.36% | 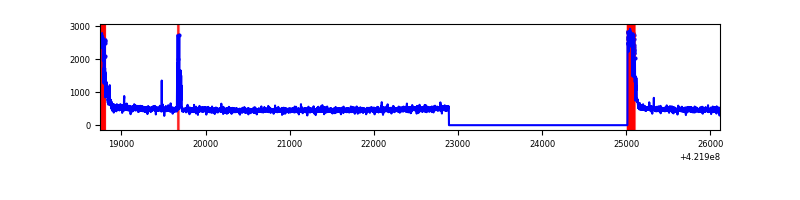 |
| D | 7369 | 5247 | 2070 | 2070 | 28.09% | 39.45% | 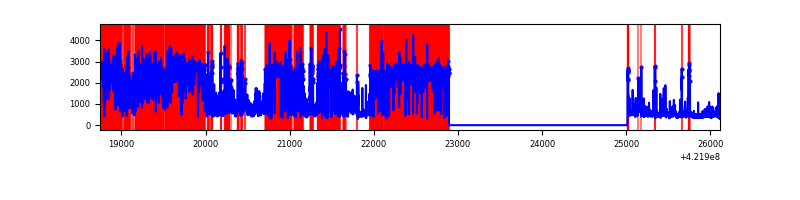 |
Top three noisy pixels from each quadrant. If the there are fewer than three noisy pixels in the level2.evt file, extra rows are filled as -1
| Pixel properties | Quadrant properties | ||||||
|---|---|---|---|---|---|---|---|
| Quadrant | DetID | PixID | Counts | Sigma | Mean | Median | Sigma |
| A | 10 | 83 | 527922 | 4443.05 | 586 | 574 | 118.7 |
| A | 13 | 248 | 162695 | 1365.91 | 586 | 574 | 118.7 |
| A | 12 | 189 | 22996 | 188.91 | 586 | 574 | 118.7 |
| B | 4 | 249 | 85761 | 754.92 | 579 | 564 | 112.9 |
| B | 0 | 186 | 57395 | 503.57 | 579 | 564 | 112.9 |
| B | 4 | 248 | 57226 | 502.08 | 579 | 564 | 112.9 |
| C | 0 | 10 | 364571 | 2739.93 | 569 | 572 | 132.8 |
| C | 15 | 214 | 227299 | 1706.64 | 569 | 572 | 132.8 |
| C | 9 | 54 | 33945 | 251.21 | 569 | 572 | 132.8 |
| D | 1 | 52 | 6133092 | 60571.59 | 412 | 400 | 101.2 |
| D | 13 | 249 | 105148 | 1034.57 | 412 | 400 | 101.2 |
| D | 5 | 222 | 96826 | 952.38 | 412 | 400 | 101.2 |
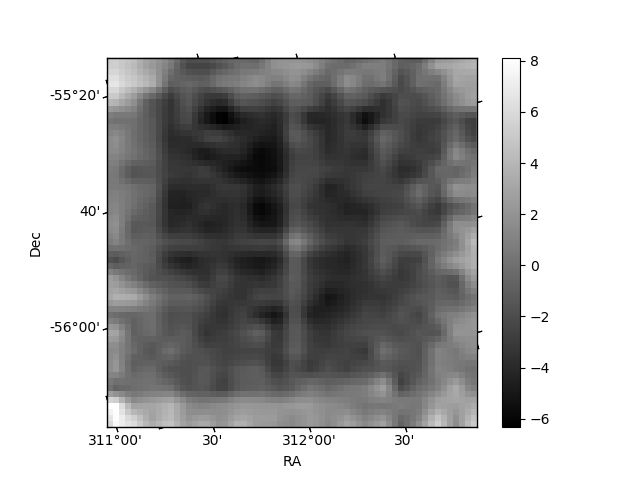
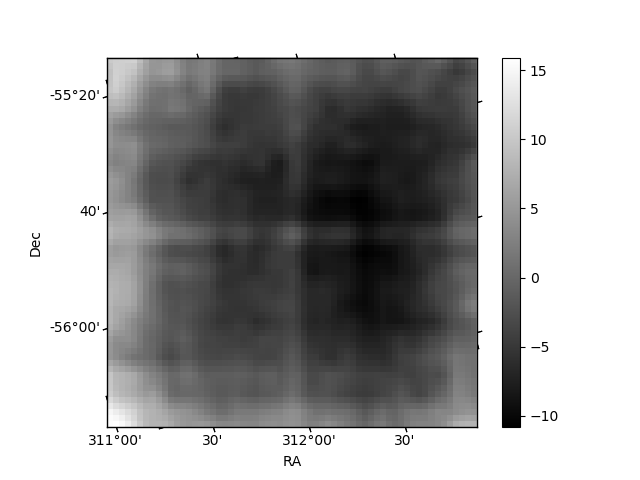
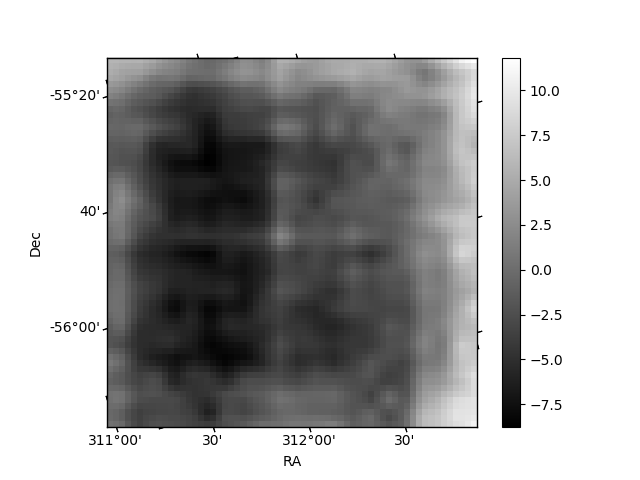
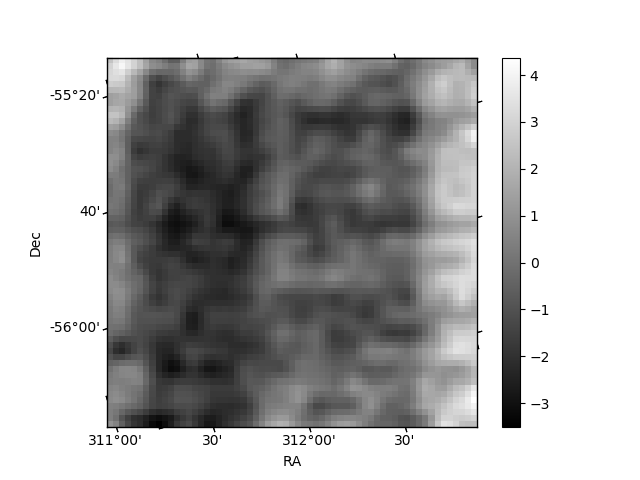
Histogram calculated using DETX and DETY for each event in the final _common_clean file
| Quadrant A | 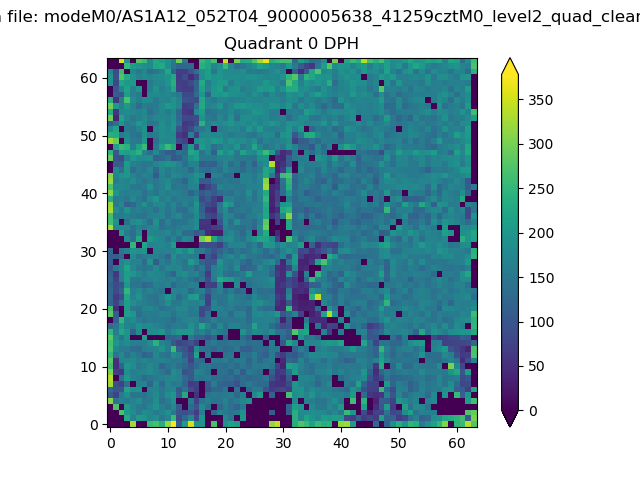 |
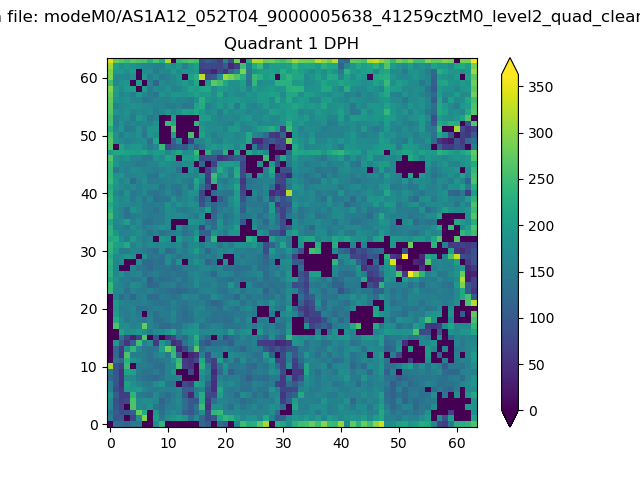 |
Quadrant B |
|---|---|---|---|
| Quadrant D | 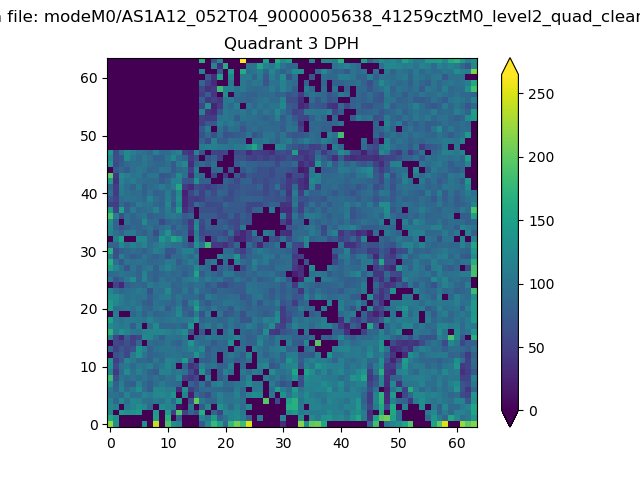 |
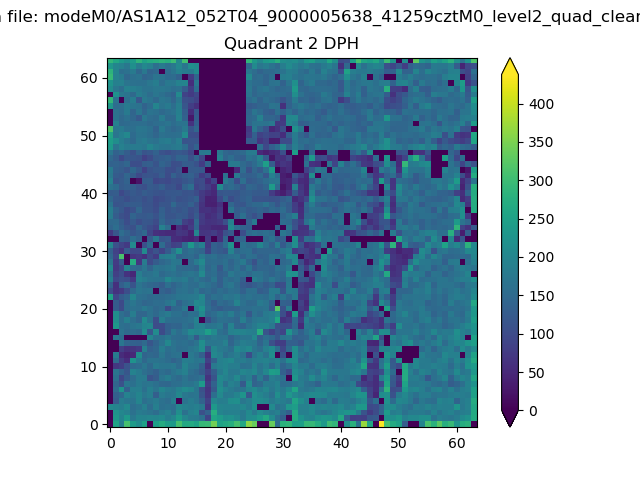 |
Quadrant C |
| Plot type | Count rate plots | Images |
|---|---|---|
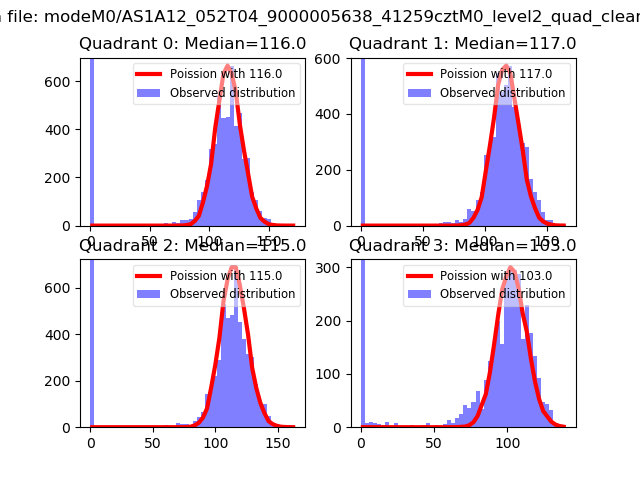
| Comparison with Poisson distribution Blue bars denote a histogram of data divided into 1 sec bins. Red curve is a Poisson curve with rate = median count rate of data. |
 |
 |
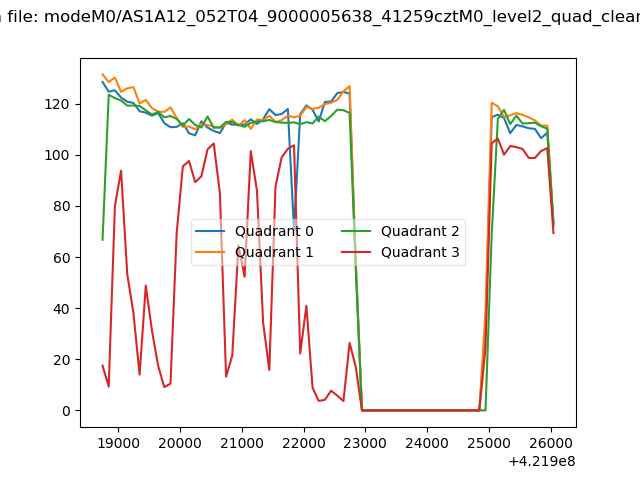
| Quadrant-wise count rates Data is divided into 100 sec bins |
 |
|
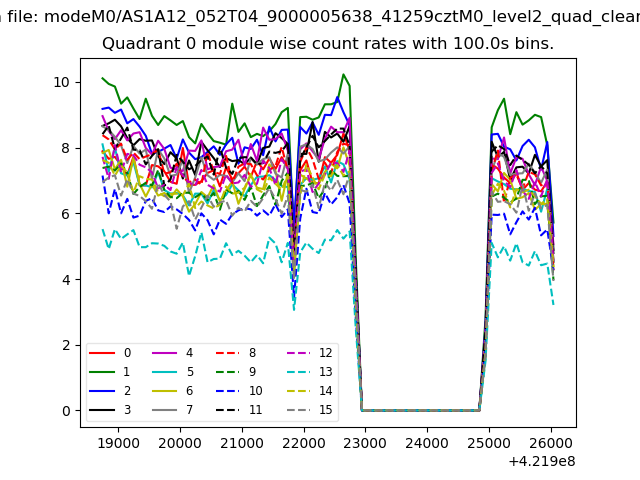
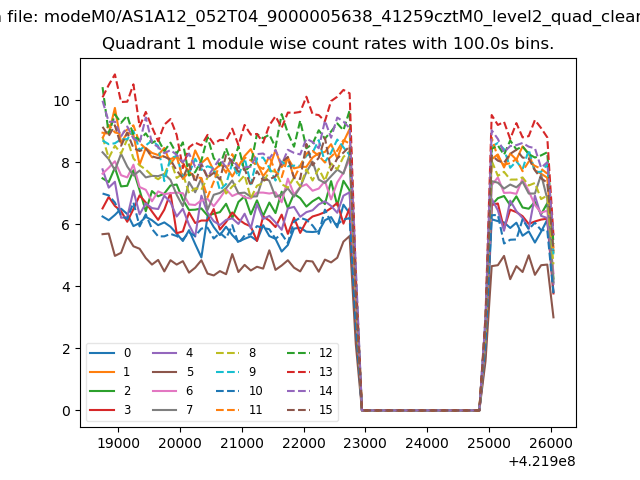
| Module-wise count rates for Quadrant A Data is divided into 100 sec bins |
 |
 |
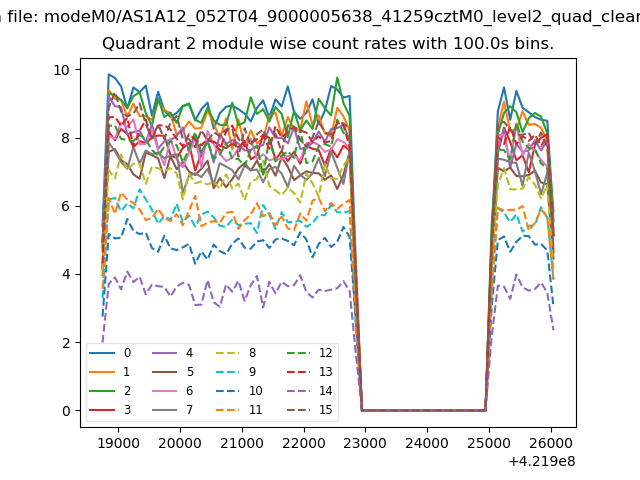
| Module-wise count rates for Quadrant B Data is divided into 100 sec bins |
 |
 |
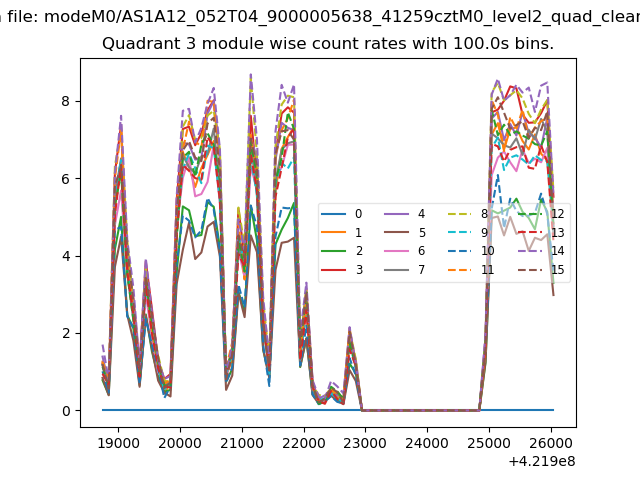
| Module-wise count rates for Quadrant C Data is divided into 100 sec bins |
 |
 |
| Module-wise count rates for Quadrant D Data is divided into 100 sec bins |
 |
 |
| Parameter | Plot |
|---|