| Param | Original file | Final file |
|---|---|---|
| Filename | modeM0/AS1A12_052T04_9000005638_41260cztM0_level2.fits | modeM0/AS1A12_052T04_9000005638_41260cztM0_level2_quad_clean.evt |
| Size (bytes) | 359,714,880 | 86,852,160 |
| Size | 343.1 MB | 82.8 MB |
| Events in quadrant A | 2,906,264 | 590,238 |
| Events in quadrant B | 3,382,873 | 579,269 |
| Events in quadrant C | 2,856,437 | 571,608 |
| Events in quadrant D | 3,753,541 | 514,972 |
| Mode M9 | |||
|---|---|---|---|
| Quadrant | BADHDUFLAG | Total packets | Discarded packets |
| A | 0 | 21 | 0 |
| B | 0 | 21 | 0 |
| C | 0 | 21 | 0 |
| D | 0 | 22 | 0 |
| Mode SS | |||
|---|---|---|---|
| Quadrant | BADHDUFLAG | Total packets | Discarded packets |
| A | 0 | 108 | 0 |
| B | 0 | 108 | 0 |
| C | 0 | 108 | 0 |
| D | 0 | 108 | 0 |
| Mode M0 | |||
|---|---|---|---|
| Quadrant | BADHDUFLAG | Total packets | Discarded packets |
| A | 0 | 11762 | 3 |
| B | 0 | 13842 | 2 |
| C | 0 | 11880 | 2 |
| D | 0 | 14766 | 2 |
| Quadrant | Total seconds | Saturated seconds | Saturation percentage |
|---|---|---|---|
| A | 5342 | 14 | 0.262074% |
| B | 5342 | 311 | 5.821790% |
| C | 5342 | 140 | 2.620741% |
| D | 5342 | 339 | 6.345938% |
Noise dominated data is calculated using 1-second bins in cleaned event files. If a bin has >2000 counts, and if more than 50% of those come from <1% of pixels, then it is considered to be noise-dominated and hence unusable.
| Quadrant | # 1 sec bins | Bins with >0 counts | Bins with >2000 counts | High rate bins dominated by noise | Noise dominated (total time) | Noise dominated (detector-on time) | Marked lightcurve |
|---|---|---|---|---|---|---|---|
| A | 7285 | 5343 | 7 | 7 | 0.10% | 0.13% | 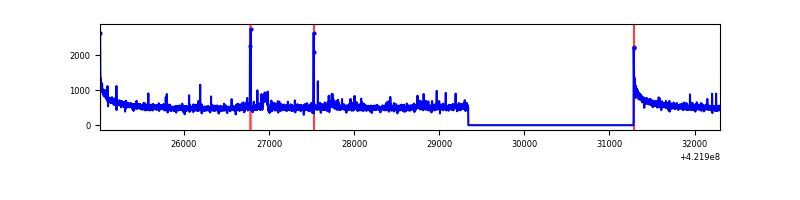 |
| B | 7285 | 5343 | 249 | 249 | 3.42% | 4.66% | 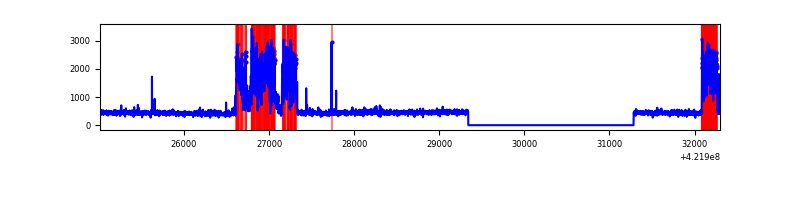 |
| C | 7285 | 5343 | 137 | 137 | 1.88% | 2.56% | 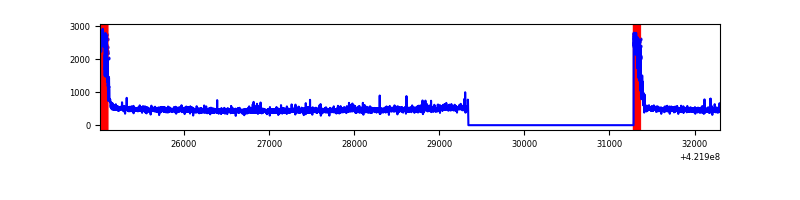 |
| D | 7285 | 5343 | 326 | 326 | 4.47% | 6.10% | 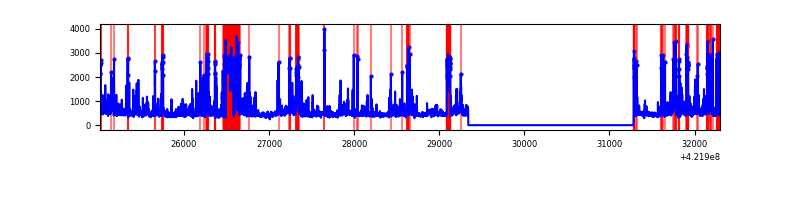 |
Top three noisy pixels from each quadrant. If the there are fewer than three noisy pixels in the level2.evt file, extra rows are filled as -1
| Pixel properties | Quadrant properties | ||||||
|---|---|---|---|---|---|---|---|
| Quadrant | DetID | PixID | Counts | Sigma | Mean | Median | Sigma |
| A | 10 | 83 | 522899 | 4344.81 | 584 | 571 | 120.2 |
| A | 12 | 189 | 68407 | 564.27 | 584 | 571 | 120.2 |
| A | 6 | 10 | 29163 | 237.83 | 584 | 571 | 120.2 |
| B | 0 | 186 | 1071275 | 9605.83 | 572 | 555 | 111.5 |
| B | 0 | 245 | 42099 | 372.71 | 572 | 555 | 111.5 |
| B | 12 | 111 | 13785 | 118.69 | 572 | 555 | 111.5 |
| C | 0 | 10 | 394342 | 2993.62 | 564 | 567 | 131.5 |
| C | 15 | 214 | 228479 | 1732.67 | 564 | 567 | 131.5 |
| C | 9 | 54 | 32742 | 244.6 | 564 | 567 | 131.5 |
| D | 1 | 52 | 976331 | 7137.53 | 556 | 541 | 136.7 |
| D | 13 | 249 | 301151 | 2198.85 | 556 | 541 | 136.7 |
| D | 5 | 222 | 188386 | 1374.01 | 556 | 541 | 136.7 |
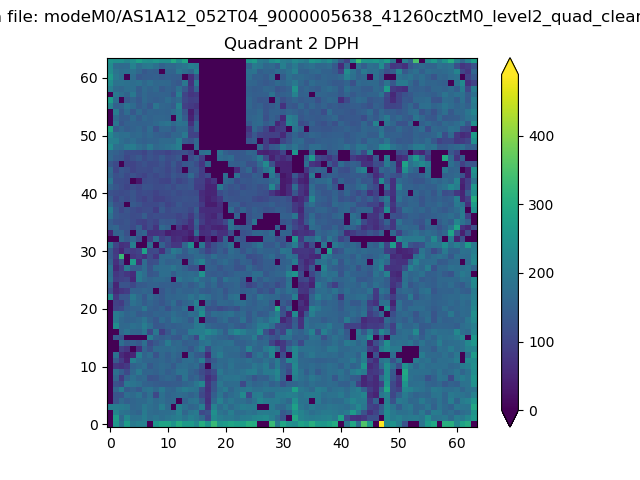
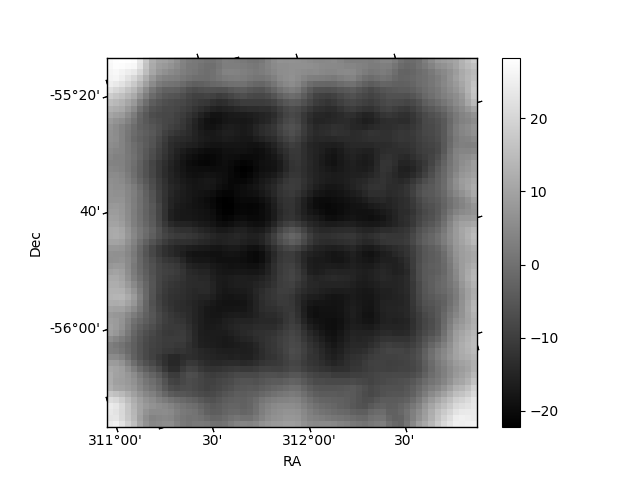
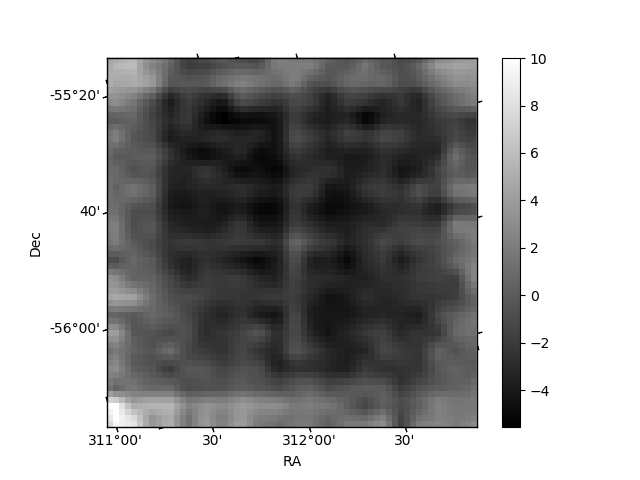
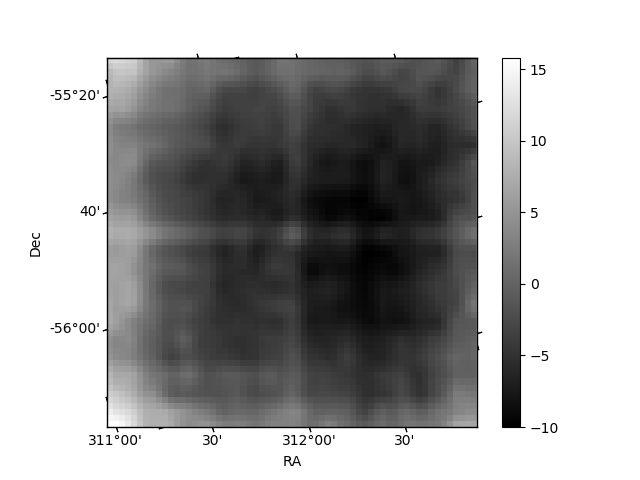
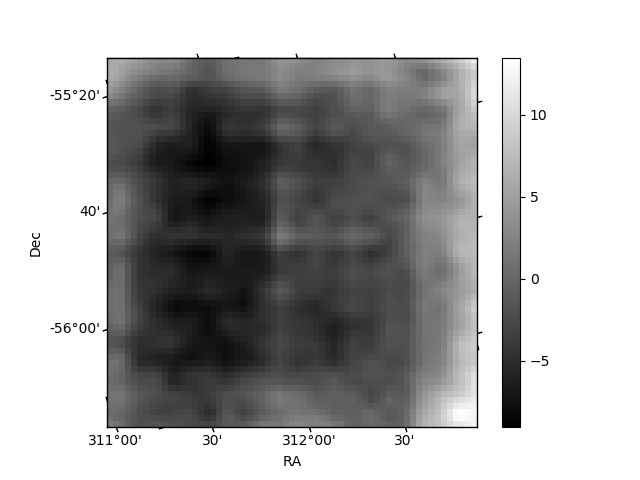
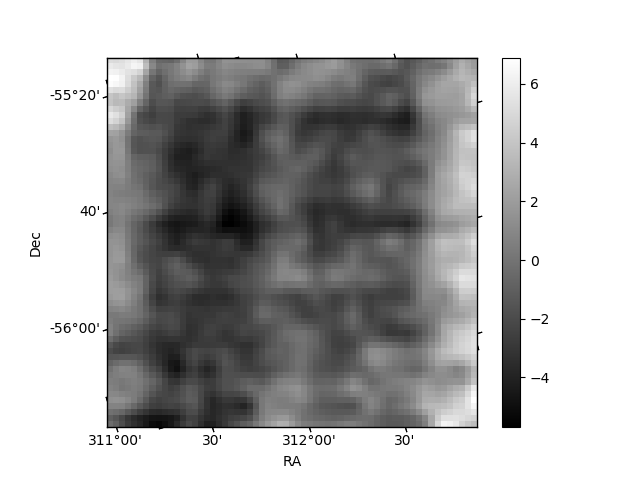
Histogram calculated using DETX and DETY for each event in the final _common_clean file
| Quadrant A | 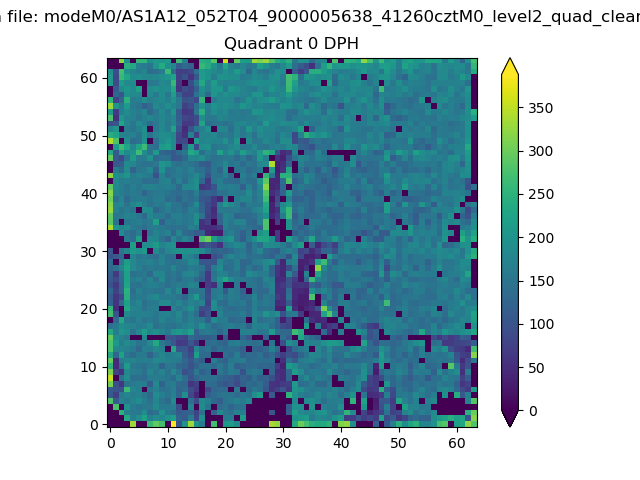 |
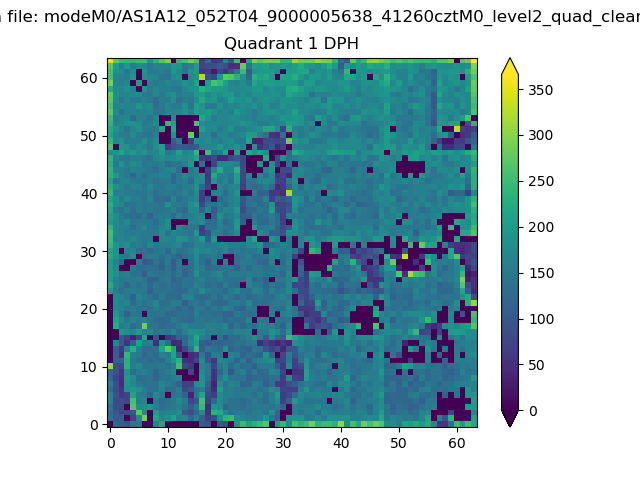 |
Quadrant B |
|---|---|---|---|
| Quadrant D | 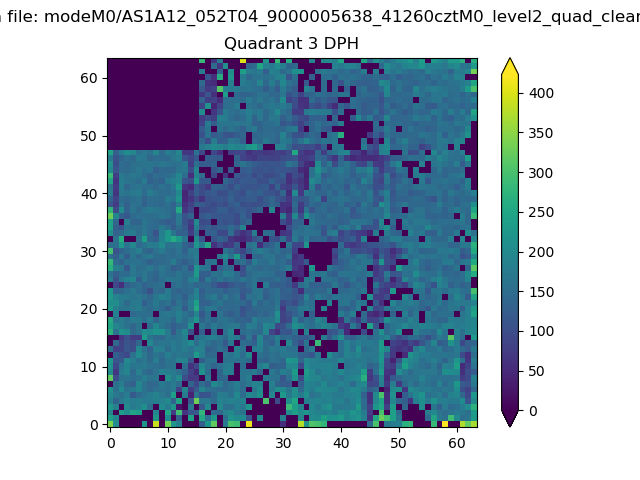 |
 |
Quadrant C |
| Plot type | Count rate plots | Images |
|---|---|---|
| Comparison with Poisson distribution Blue bars denote a histogram of data divided into 1 sec bins. Red curve is a Poisson curve with rate = median count rate of data. |
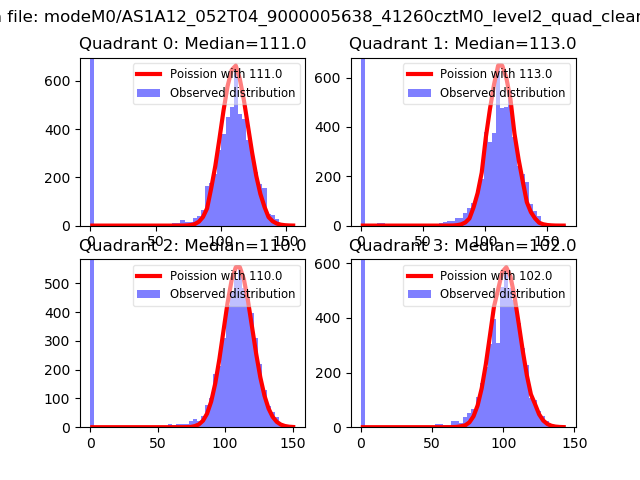 |
 |
| Quadrant-wise count rates Data is divided into 100 sec bins |
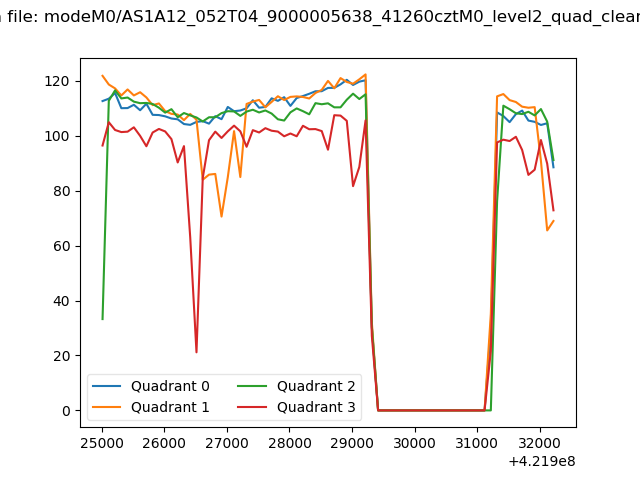 |
|
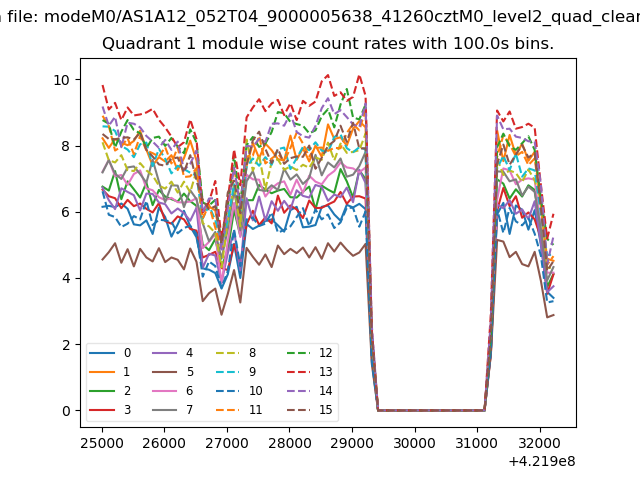
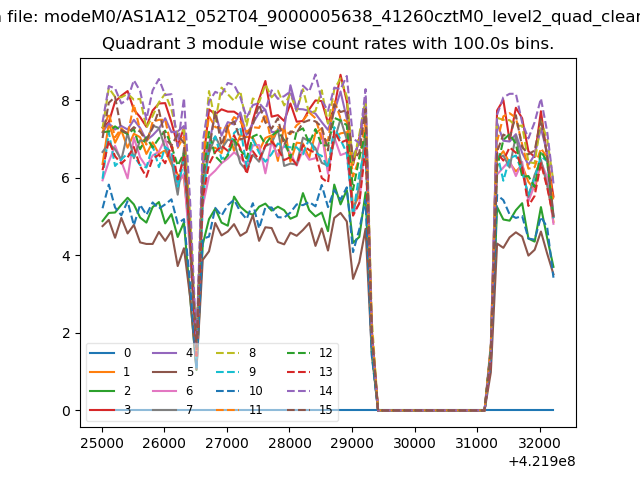
| Module-wise count rates for Quadrant A Data is divided into 100 sec bins |
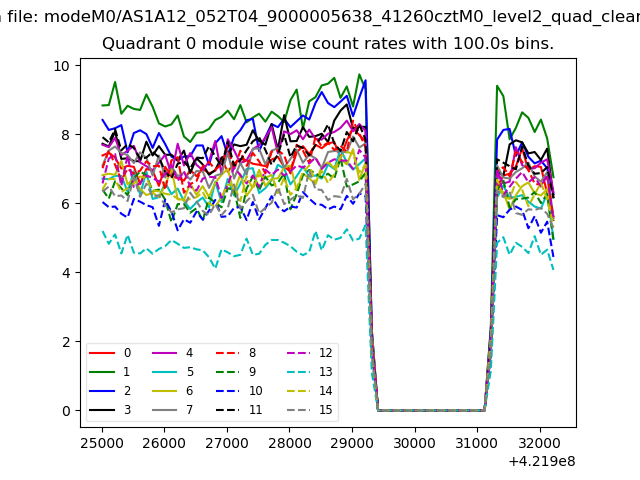 |
 |
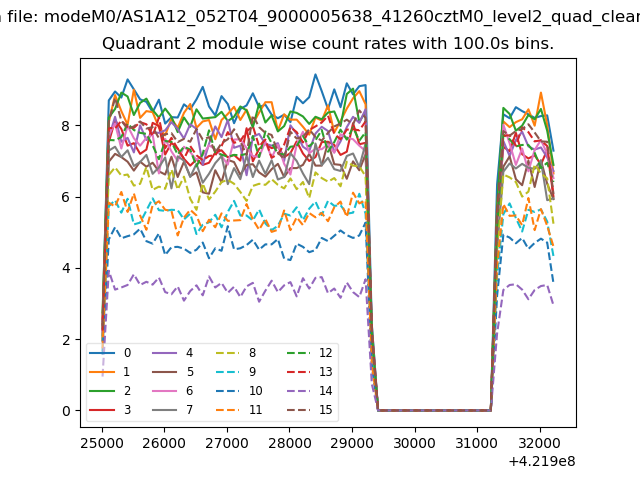
| Module-wise count rates for Quadrant B Data is divided into 100 sec bins |
 |
 |
| Module-wise count rates for Quadrant C Data is divided into 100 sec bins |
 |
 |
| Module-wise count rates for Quadrant D Data is divided into 100 sec bins |
 |
 |
| Parameter | Plot |
|---|---|
| CZT HV Monitor | 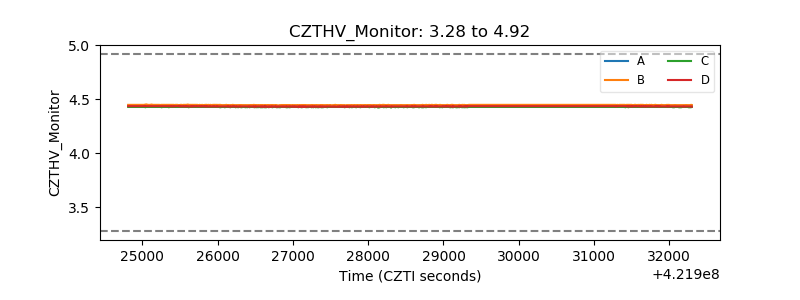 |
| D_VDD | 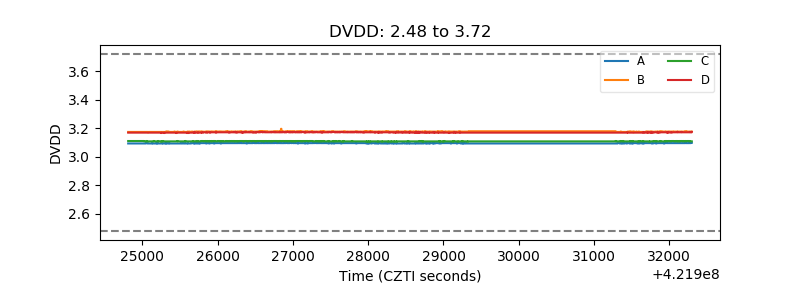 |
| Temperature 1 | 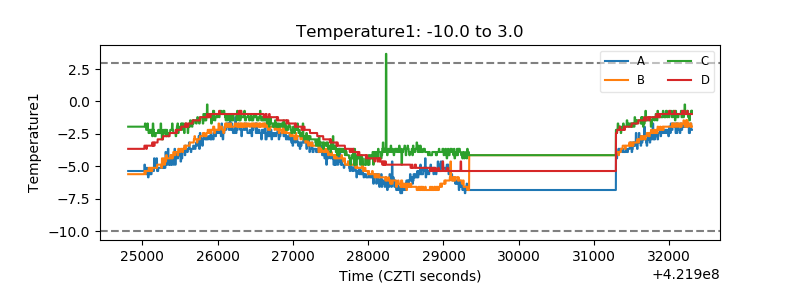 |
| Veto HV Monitor | 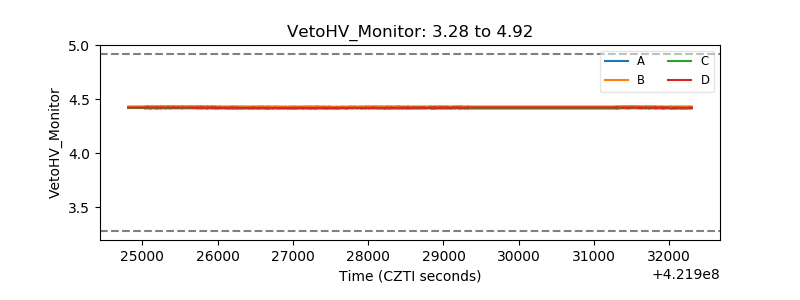 |
| Veto LLD | 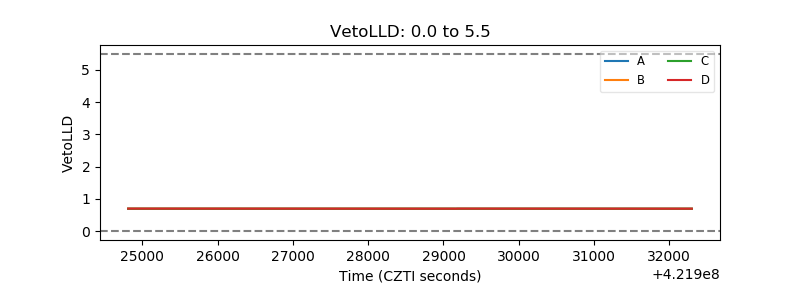 |
| Alpha Counter | 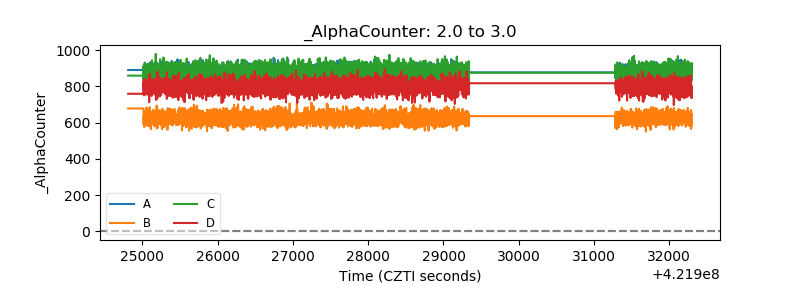 |
| _CPM_Rate | 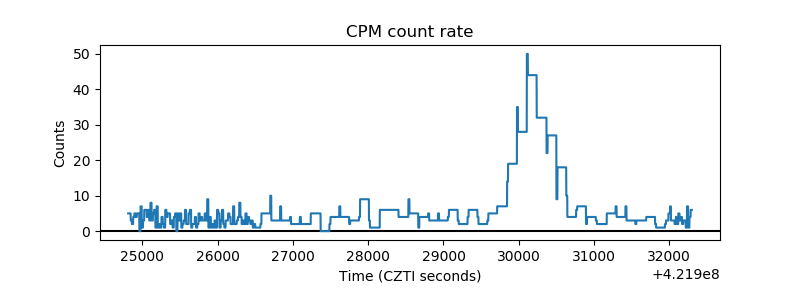 |
| CZT Counter | 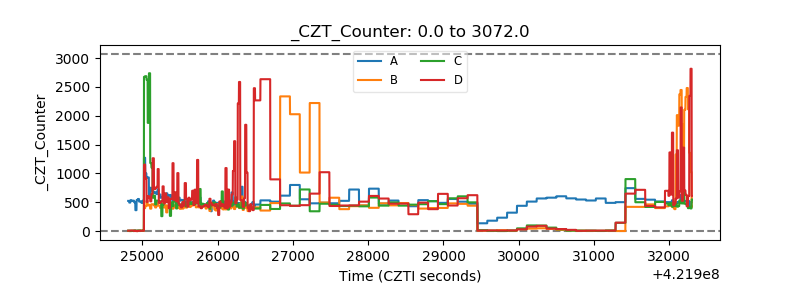 |
| +2.5 Volts monitor | 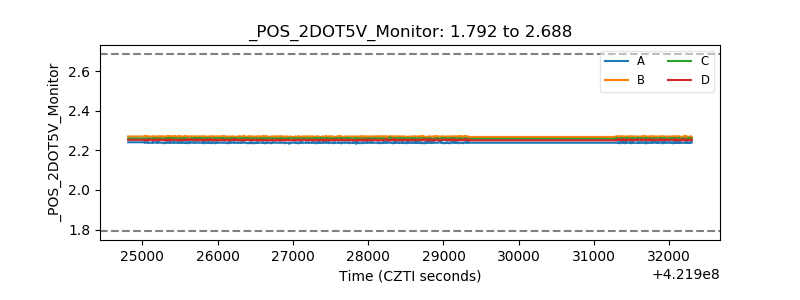 |
| +5 Volts monitor | 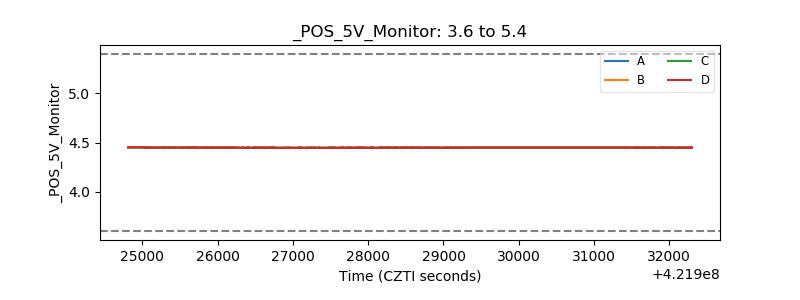 |
| _ROLL_ROT | 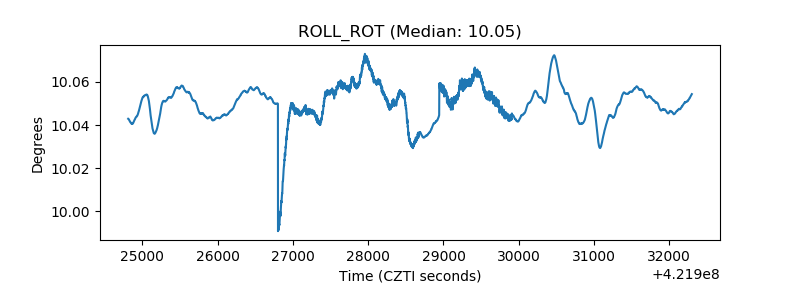 |
| _Roll_DEC |  |
| _Roll_RA | 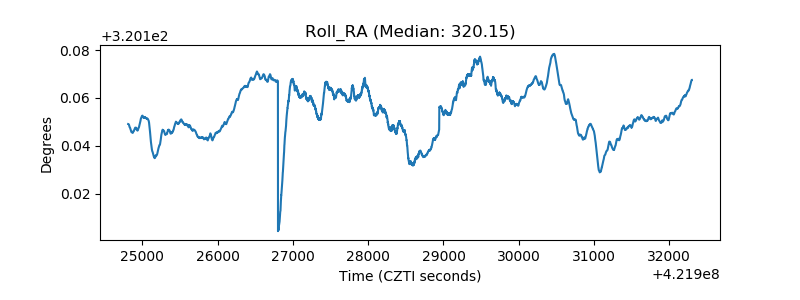 |
| Veto Counter | 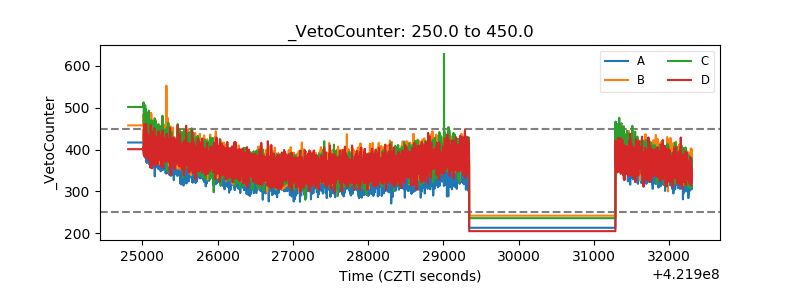 |