| Param | Original file | Final file |
|---|---|---|
| Filename | modeM0/AS1A12_052T04_9000005638_41262cztM0_level2.fits | modeM0/AS1A12_052T04_9000005638_41262cztM0_level2_quad_clean.evt |
| Size (bytes) | 477,731,520 | 89,452,800 |
| Size | 455.6 MB | 85.3 MB |
| Events in quadrant A | 3,091,599 | 640,096 |
| Events in quadrant B | 3,497,329 | 624,580 |
| Events in quadrant C | 3,156,627 | 620,898 |
| Events in quadrant D | 7,479,479 | 410,666 |
| Mode M9 | |||
|---|---|---|---|
| Quadrant | BADHDUFLAG | Total packets | Discarded packets |
| A | 0 | 15 | 0 |
| B | 0 | 15 | 0 |
| C | 0 | 15 | 0 |
| D | 0 | 16 | 0 |
| Mode SS | |||
|---|---|---|---|
| Quadrant | BADHDUFLAG | Total packets | Discarded packets |
| A | 0 | 120 | 0 |
| B | 0 | 120 | 0 |
| C | 0 | 120 | 0 |
| D | 0 | 120 | 0 |
| Mode M0 | |||
|---|---|---|---|
| Quadrant | BADHDUFLAG | Total packets | Discarded packets |
| A | 0 | 12743 | 3 |
| B | 0 | 14452 | 2 |
| C | 0 | 13184 | 2 |
| D | 0 | 26358 | 2 |
| Quadrant | Total seconds | Saturated seconds | Saturation percentage |
|---|---|---|---|
| A | 5899 | 12 | 0.203424% |
| B | 5899 | 239 | 4.051534% |
| C | 5899 | 92 | 1.559586% |
| D | 5899 | 1889 | 32.022377% |
Noise dominated data is calculated using 1-second bins in cleaned event files. If a bin has >2000 counts, and if more than 50% of those come from <1% of pixels, then it is considered to be noise-dominated and hence unusable.
| Quadrant | # 1 sec bins | Bins with >0 counts | Bins with >2000 counts | High rate bins dominated by noise | Noise dominated (total time) | Noise dominated (detector-on time) | Marked lightcurve |
|---|---|---|---|---|---|---|---|
| A | 7242 | 5900 | 4 | 4 | 0.06% | 0.07% | 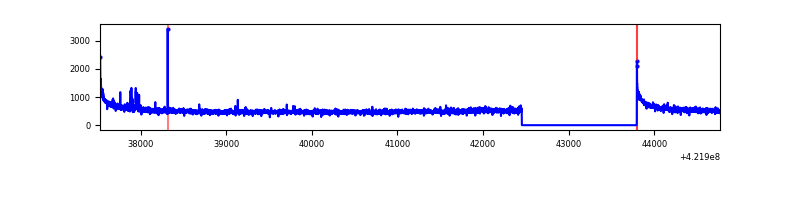 |
| B | 7242 | 5900 | 196 | 196 | 2.71% | 3.32% | 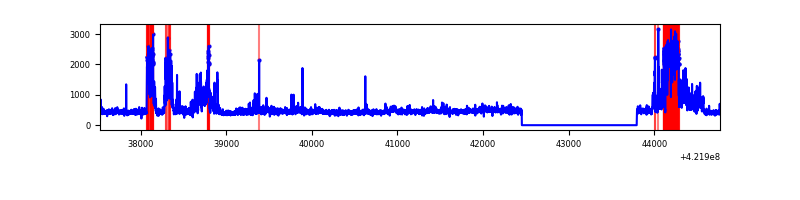 |
| C | 7242 | 5900 | 82 | 82 | 1.13% | 1.39% | 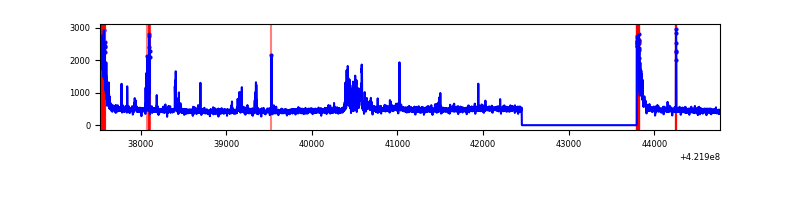 |
| D | 7242 | 5900 | 1817 | 1817 | 25.09% | 30.80% | 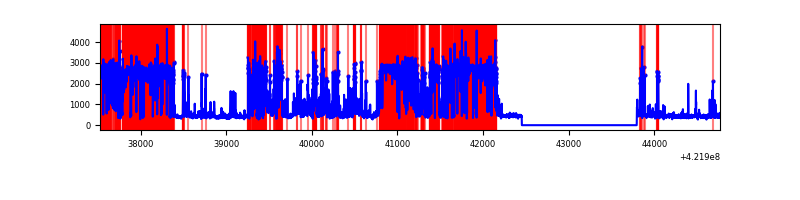 |
Top three noisy pixels from each quadrant. If the there are fewer than three noisy pixels in the level2.evt file, extra rows are filled as -1
| Pixel properties | Quadrant properties | ||||||
|---|---|---|---|---|---|---|---|
| Quadrant | DetID | PixID | Counts | Sigma | Mean | Median | Sigma |
| A | 10 | 83 | 561916 | 4309.85 | 638 | 624 | 130.2 |
| A | 6 | 10 | 27564 | 206.86 | 638 | 624 | 130.2 |
| A | 12 | 189 | 18649 | 138.4 | 638 | 624 | 130.2 |
| B | 0 | 186 | 855127 | 6972.11 | 624 | 607 | 122.6 |
| B | 0 | 229 | 78338 | 634.21 | 624 | 607 | 122.6 |
| B | 0 | 245 | 64107 | 518.1 | 624 | 607 | 122.6 |
| C | 15 | 214 | 253430 | 1756.83 | 617 | 619 | 143.9 |
| C | 0 | 10 | 246951 | 1711.81 | 617 | 619 | 143.9 |
| C | 9 | 54 | 215453 | 1492.92 | 617 | 619 | 143.9 |
| D | 1 | 52 | 5259241 | 42809.71 | 498 | 484 | 122.8 |
| D | 13 | 249 | 149314 | 1211.57 | 498 | 484 | 122.8 |
| D | 5 | 222 | 64685 | 522.64 | 498 | 484 | 122.8 |
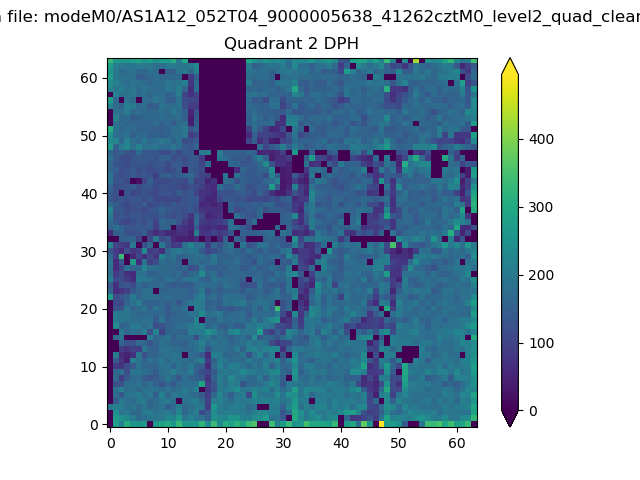
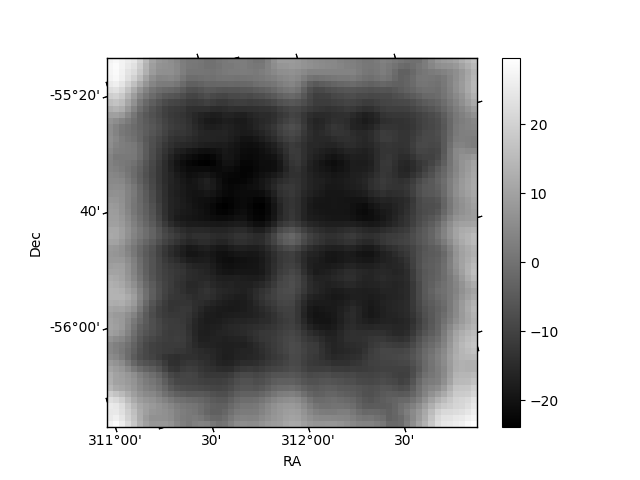
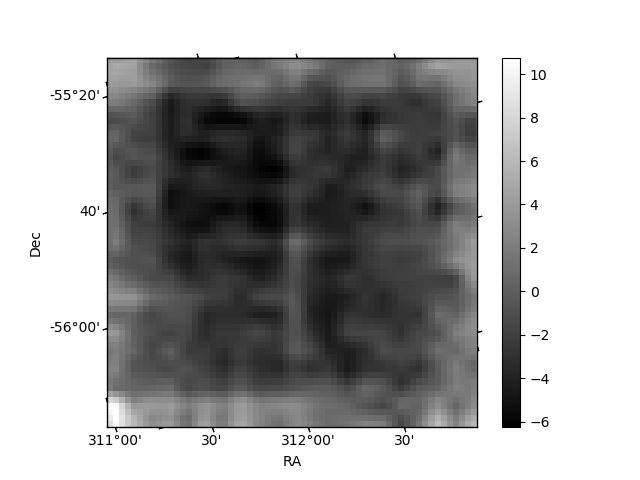
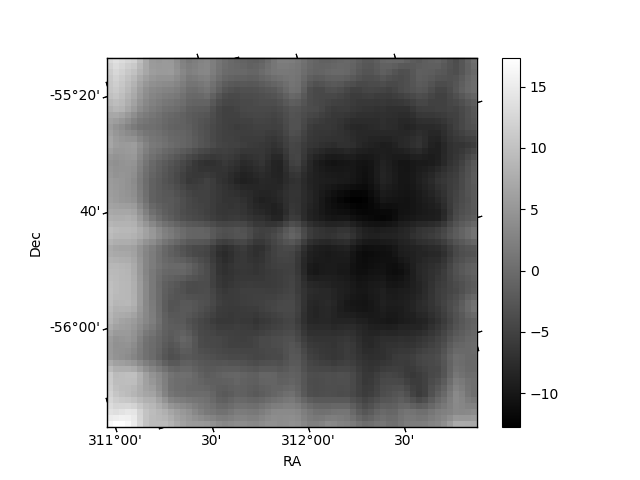
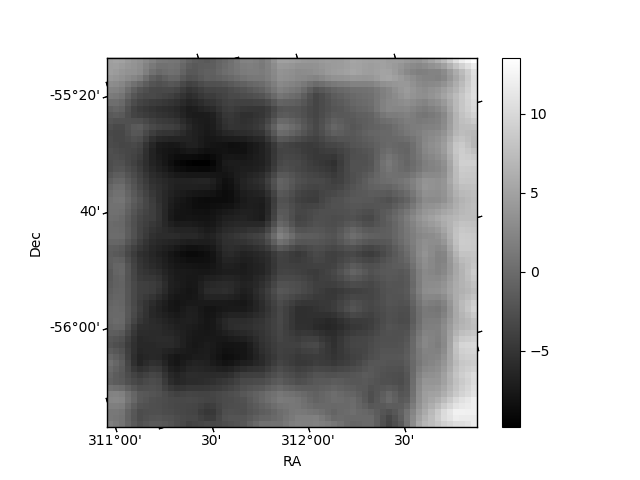
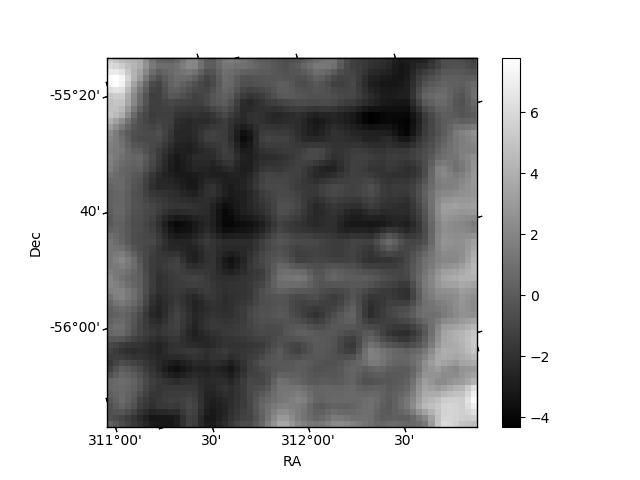
Histogram calculated using DETX and DETY for each event in the final _common_clean file
| Quadrant A | 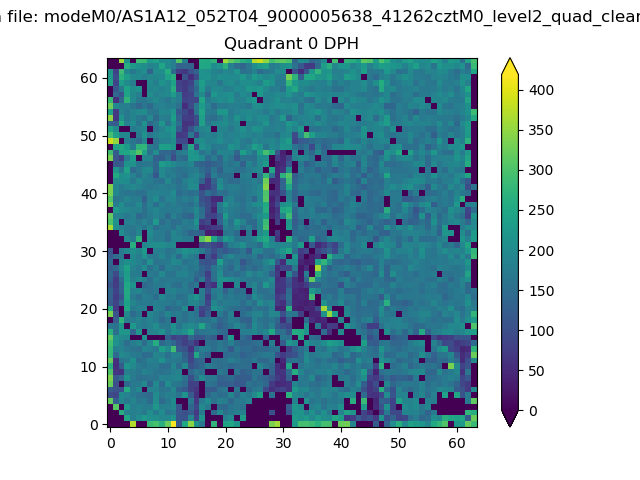 |
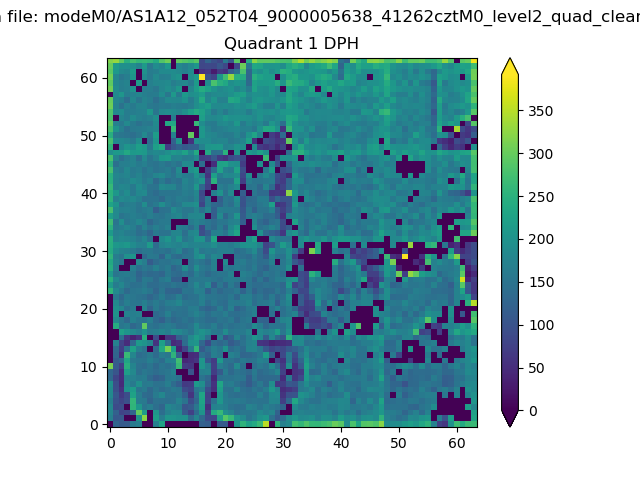 |
Quadrant B |
|---|---|---|---|
| Quadrant D | 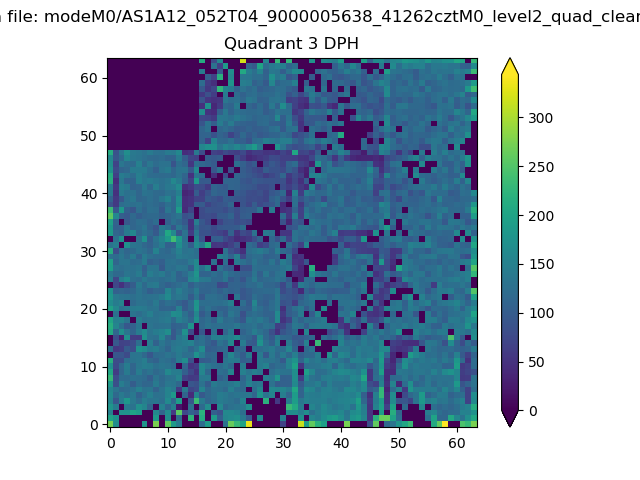 |
 |
Quadrant C |
| Plot type | Count rate plots | Images |
|---|---|---|
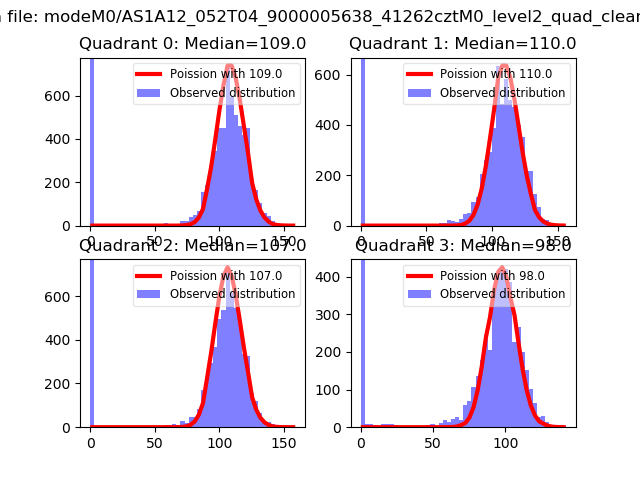
| Comparison with Poisson distribution Blue bars denote a histogram of data divided into 1 sec bins. Red curve is a Poisson curve with rate = median count rate of data. |
 |
 |
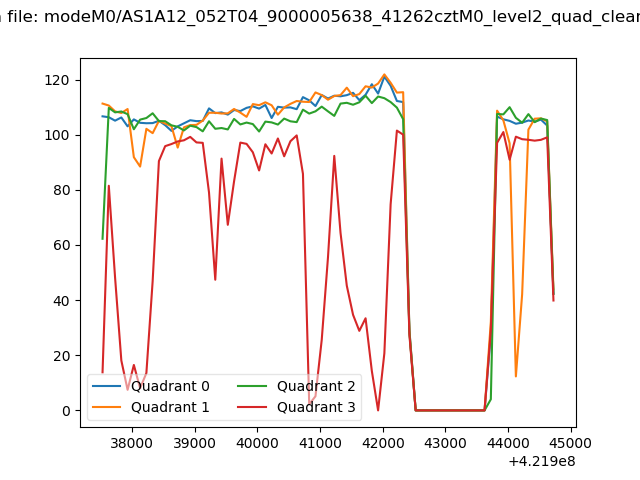
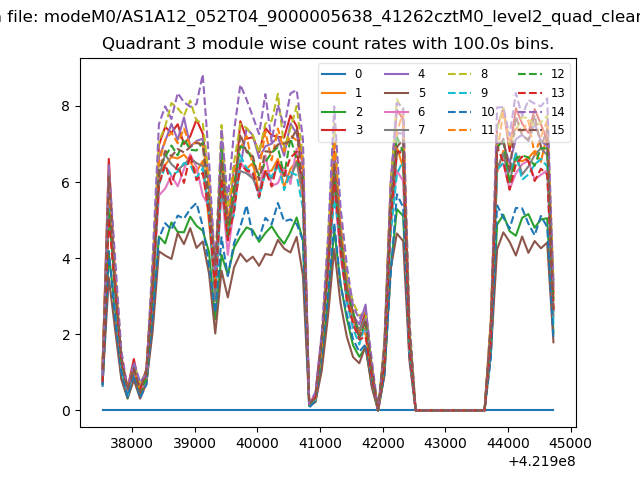
| Quadrant-wise count rates Data is divided into 100 sec bins |
 |
|
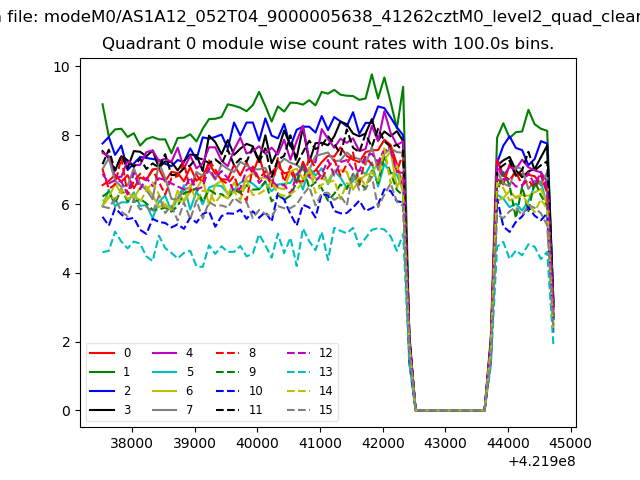
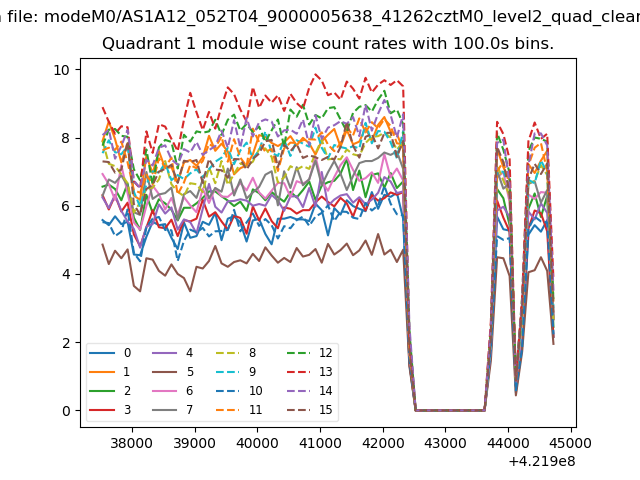
| Module-wise count rates for Quadrant A Data is divided into 100 sec bins |
 |
 |
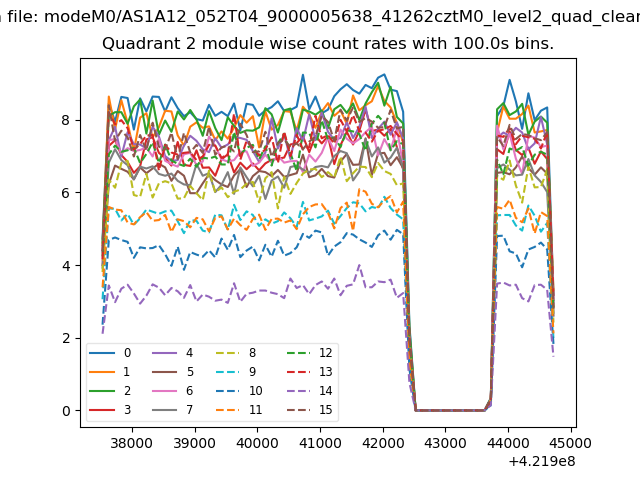
| Module-wise count rates for Quadrant B Data is divided into 100 sec bins |
 |
 |
| Module-wise count rates for Quadrant C Data is divided into 100 sec bins |
 |
 |
| Module-wise count rates for Quadrant D Data is divided into 100 sec bins |
 |
 |
| Parameter | Plot |
|---|---|
| CZT HV Monitor | 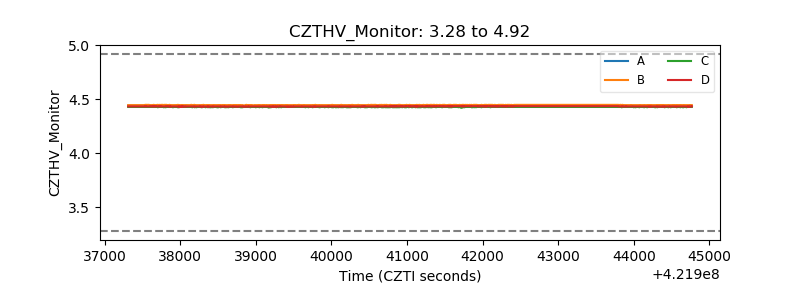 |
| D_VDD | 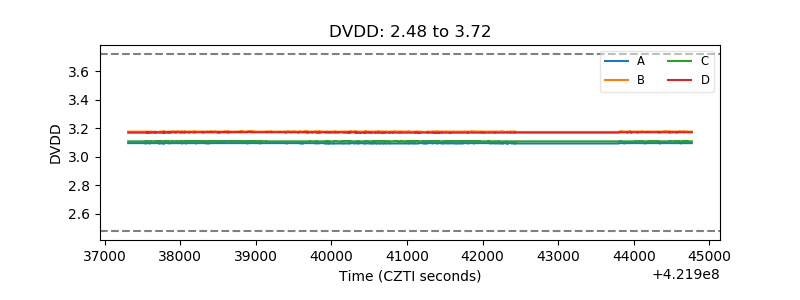 |
| Temperature 1 | 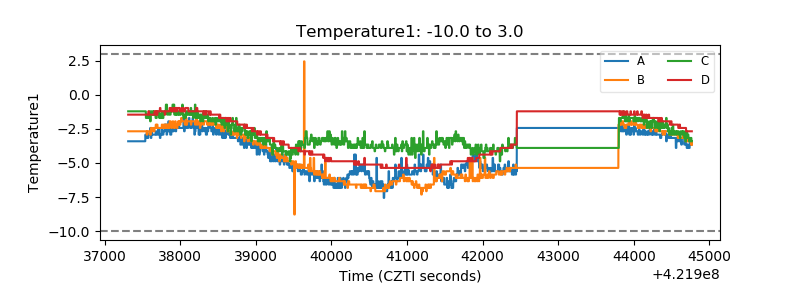 |
| Veto HV Monitor | 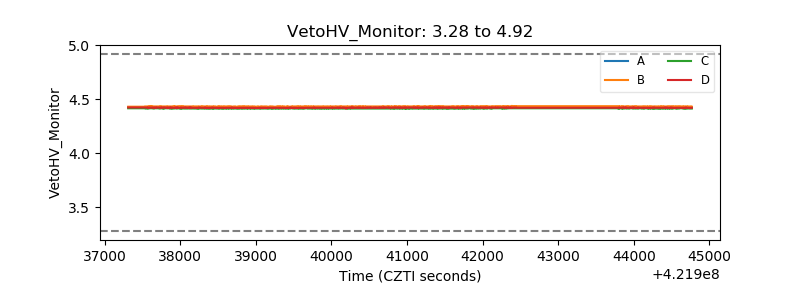 |
| Veto LLD | 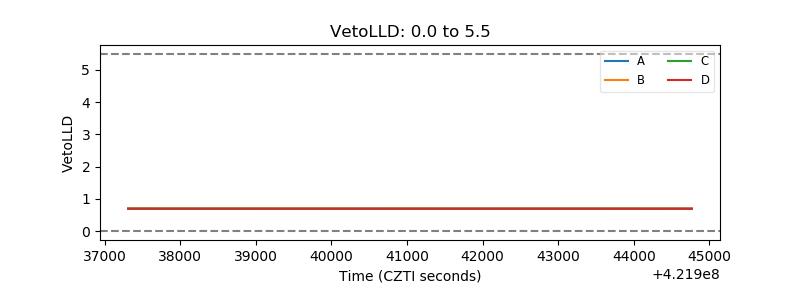 |
| Alpha Counter | 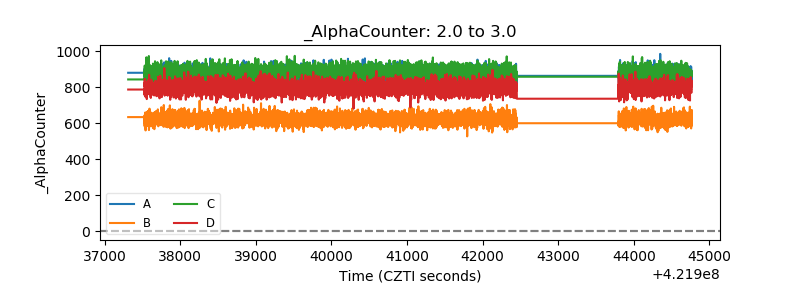 |
| _CPM_Rate | 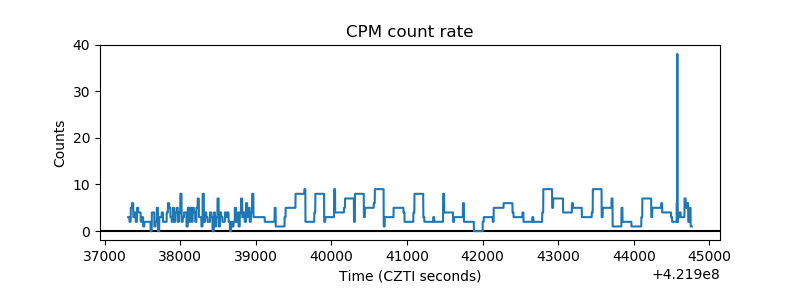 |
| CZT Counter | 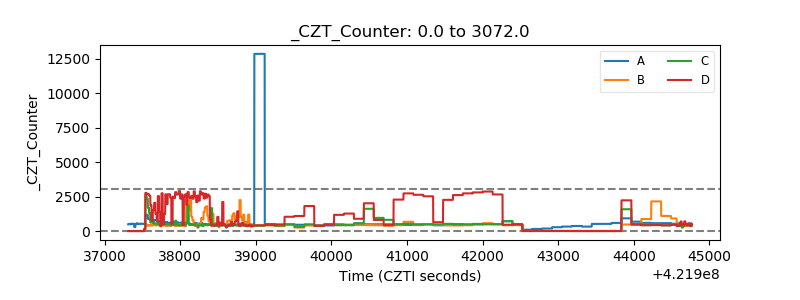 |
| +2.5 Volts monitor |  |
| +5 Volts monitor |  |
| _ROLL_ROT | 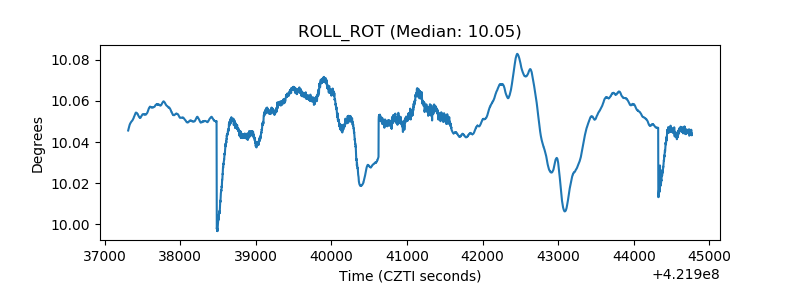 |
| _Roll_DEC | 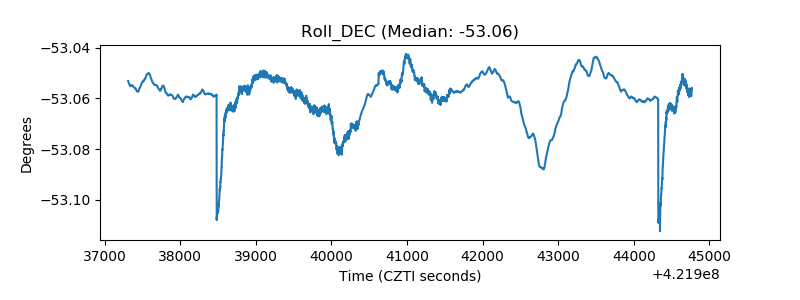 |
| _Roll_RA | 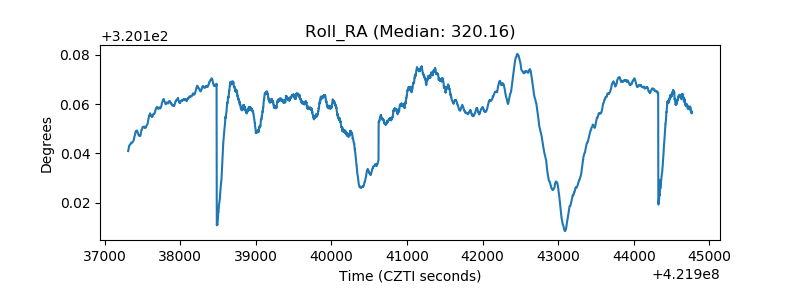 |
| Veto Counter | 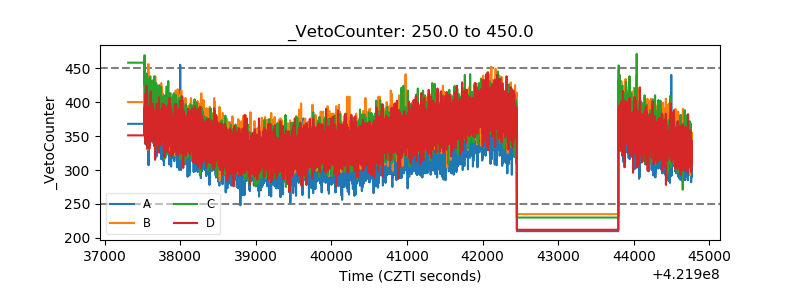 |