| Param | Original file | Final file |
|---|---|---|
| Filename | modeM0/AS1A12_052T04_9000005638_41263cztM0_level2.fits | modeM0/AS1A12_052T04_9000005638_41263cztM0_level2_quad_clean.evt |
| Size (bytes) | 375,240,960 | 95,967,360 |
| Size | 357.9 MB | 91.5 MB |
| Events in quadrant A | 3,147,508 | 650,480 |
| Events in quadrant B | 3,338,505 | 633,503 |
| Events in quadrant C | 3,365,138 | 620,856 |
| Events in quadrant D | 3,574,330 | 583,816 |
| Mode M9 | |||
|---|---|---|---|
| Quadrant | BADHDUFLAG | Total packets | Discarded packets |
| A | 0 | 24 | 0 |
| B | 0 | 24 | 0 |
| C | 0 | 24 | 0 |
| D | 0 | 25 | 0 |
| Mode SS | |||
|---|---|---|---|
| Quadrant | BADHDUFLAG | Total packets | Discarded packets |
| A | 0 | 122 | 0 |
| B | 0 | 122 | 0 |
| C | 0 | 122 | 0 |
| D | 0 | 122 | 0 |
| Mode M0 | |||
|---|---|---|---|
| Quadrant | BADHDUFLAG | Total packets | Discarded packets |
| A | 0 | 13021 | 3 |
| B | 0 | 14144 | 2 |
| C | 0 | 13804 | 2 |
| D | 0 | 14865 | 2 |
| Quadrant | Total seconds | Saturated seconds | Saturation percentage |
|---|---|---|---|
| A | 5969 | 21 | 0.351818% |
| B | 5969 | 242 | 4.054280% |
| C | 5969 | 142 | 2.378958% |
| D | 5969 | 133 | 2.228179% |
Noise dominated data is calculated using 1-second bins in cleaned event files. If a bin has >2000 counts, and if more than 50% of those come from <1% of pixels, then it is considered to be noise-dominated and hence unusable.
| Quadrant | # 1 sec bins | Bins with >0 counts | Bins with >2000 counts | High rate bins dominated by noise | Noise dominated (total time) | Noise dominated (detector-on time) | Marked lightcurve |
|---|---|---|---|---|---|---|---|
| A | 7252 | 5970 | 8 | 8 | 0.11% | 0.13% | 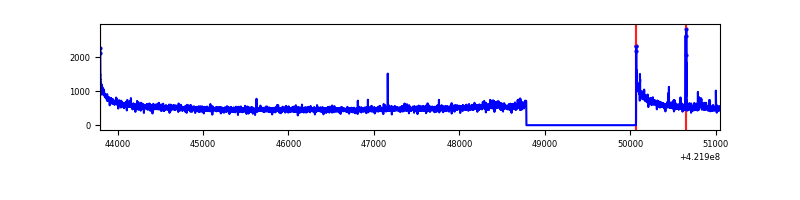 |
| B | 7252 | 5970 | 188 | 188 | 2.59% | 3.15% | 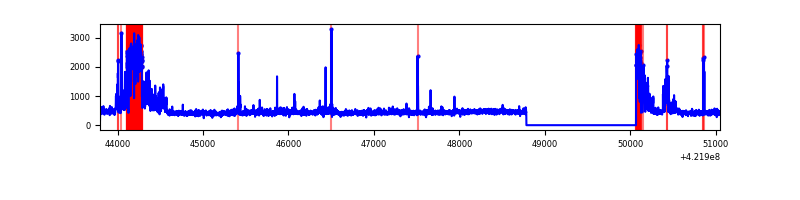 |
| C | 7252 | 5970 | 131 | 131 | 1.81% | 2.19% | 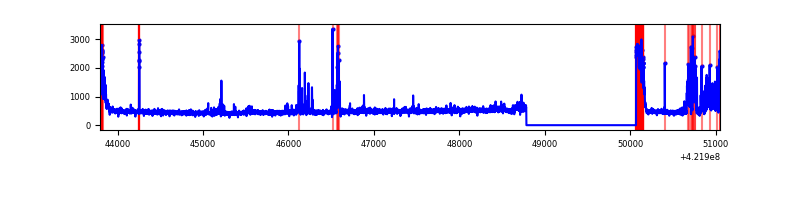 |
| D | 7252 | 5970 | 128 | 128 | 1.77% | 2.14% | 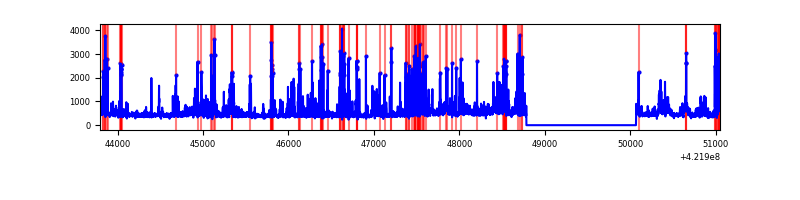 |
Top three noisy pixels from each quadrant. If the there are fewer than three noisy pixels in the level2.evt file, extra rows are filled as -1
| Pixel properties | Quadrant properties | ||||||
|---|---|---|---|---|---|---|---|
| Quadrant | DetID | PixID | Counts | Sigma | Mean | Median | Sigma |
| A | 10 | 83 | 567050 | 4297.46 | 646 | 632 | 131.8 |
| A | 12 | 189 | 40243 | 300.53 | 646 | 632 | 131.8 |
| A | 13 | 248 | 26307 | 194.8 | 646 | 632 | 131.8 |
| B | 0 | 186 | 701223 | 5682.31 | 631 | 613 | 123.3 |
| B | 0 | 190 | 65324 | 524.84 | 631 | 613 | 123.3 |
| B | 0 | 245 | 46559 | 372.65 | 631 | 613 | 123.3 |
| C | 9 | 54 | 357620 | 2442.97 | 622 | 626 | 146.1 |
| C | 0 | 10 | 308790 | 2108.82 | 622 | 626 | 146.1 |
| C | 15 | 214 | 252963 | 1726.78 | 622 | 626 | 146.1 |
| D | 1 | 52 | 457685 | 2987.3 | 625 | 606 | 153.0 |
| D | 12 | 233 | 257331 | 1677.86 | 625 | 606 | 153.0 |
| D | 13 | 249 | 211129 | 1375.9 | 625 | 606 | 153.0 |
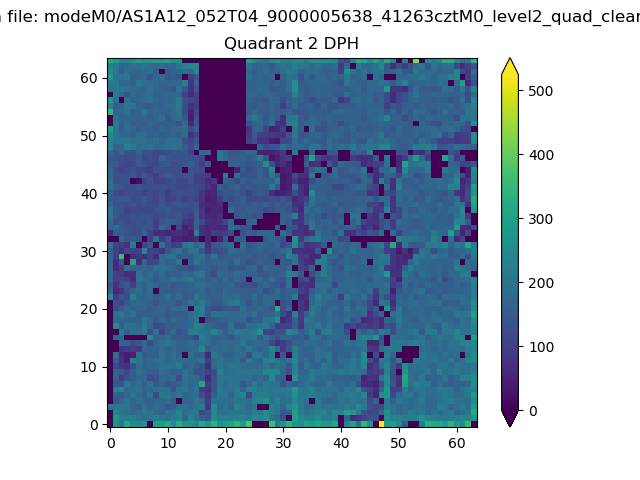
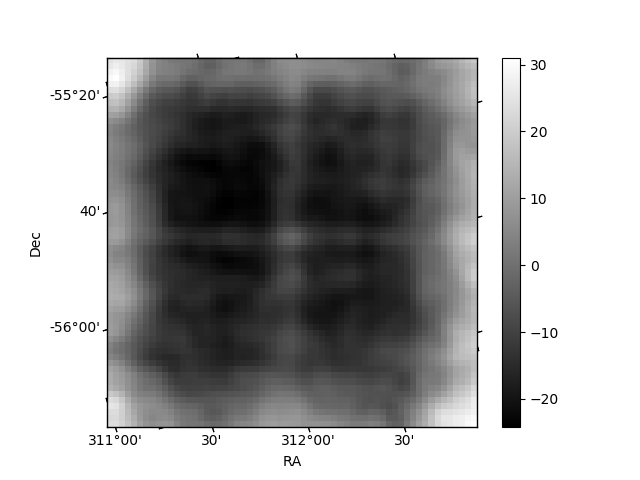
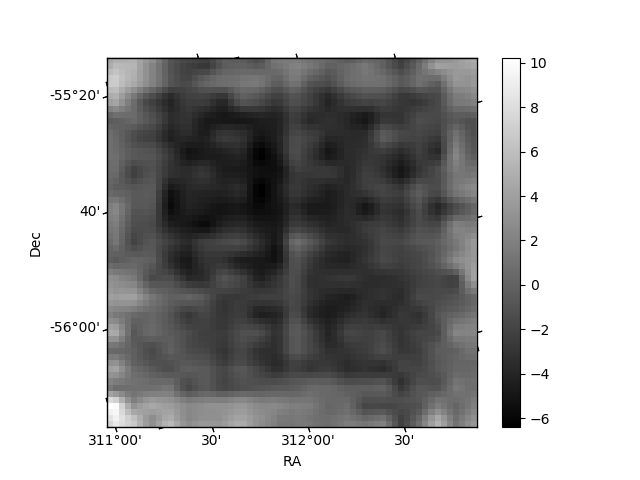
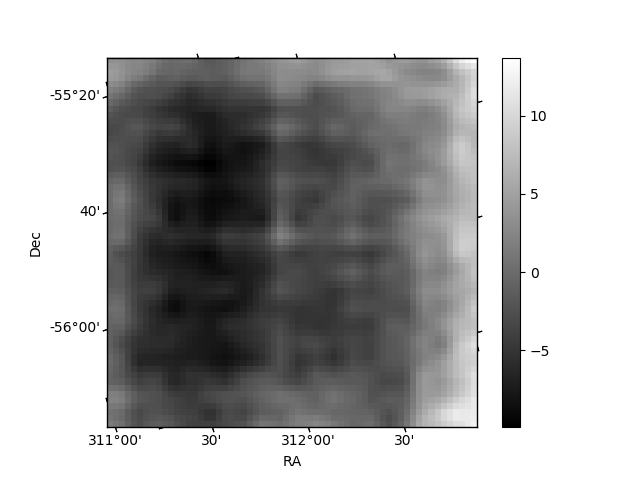
Histogram calculated using DETX and DETY for each event in the final _common_clean file
| Quadrant A | 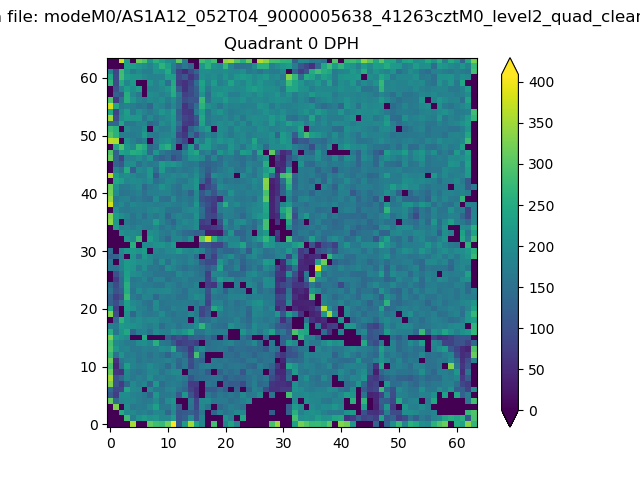 |
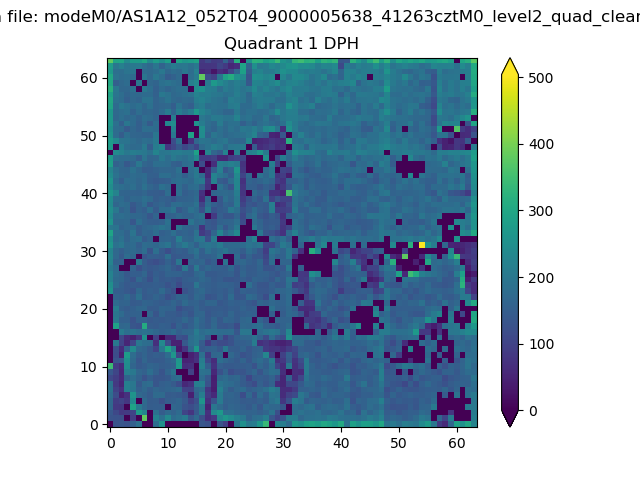 |
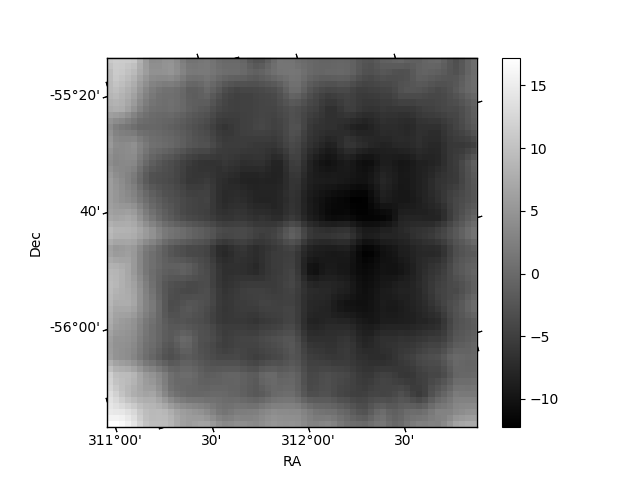
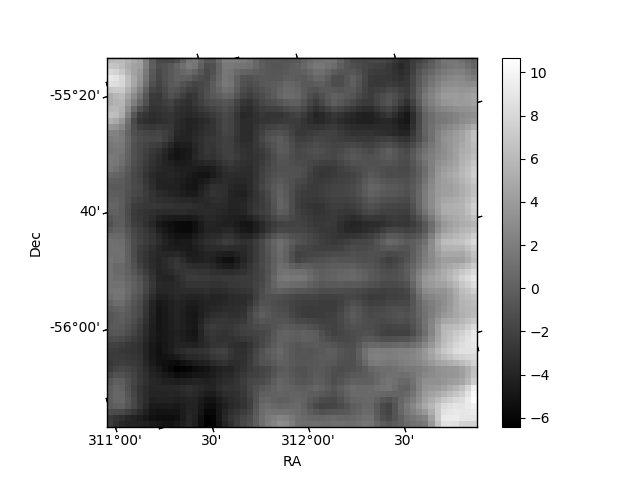
Quadrant B |
|---|---|---|---|
| Quadrant D | 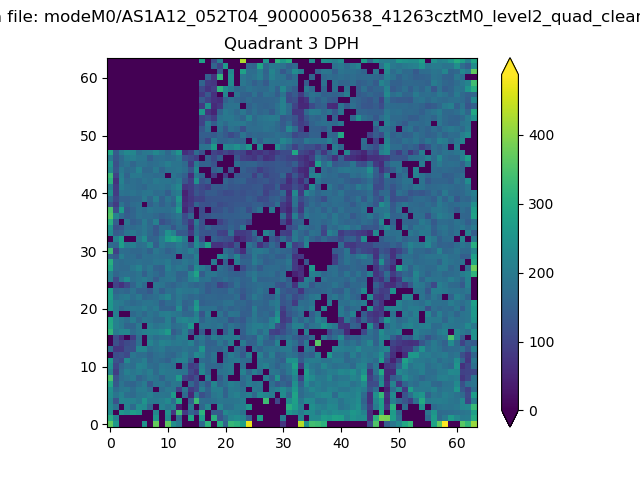 |
 |
Quadrant C |
| Plot type | Count rate plots | Images |
|---|---|---|
| Comparison with Poisson distribution Blue bars denote a histogram of data divided into 1 sec bins. Red curve is a Poisson curve with rate = median count rate of data. |
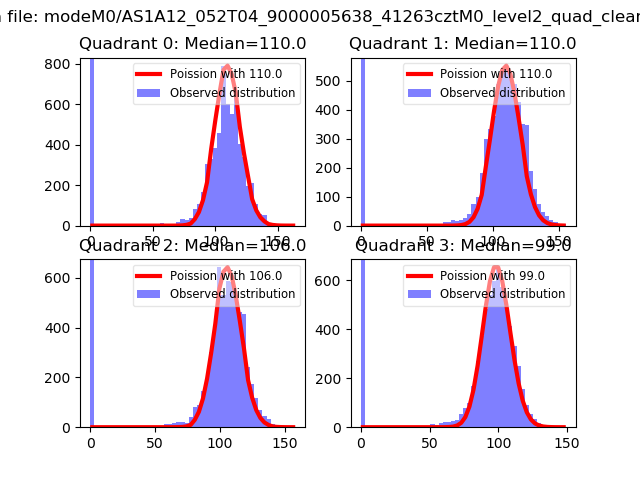 |
 |
| Quadrant-wise count rates Data is divided into 100 sec bins |
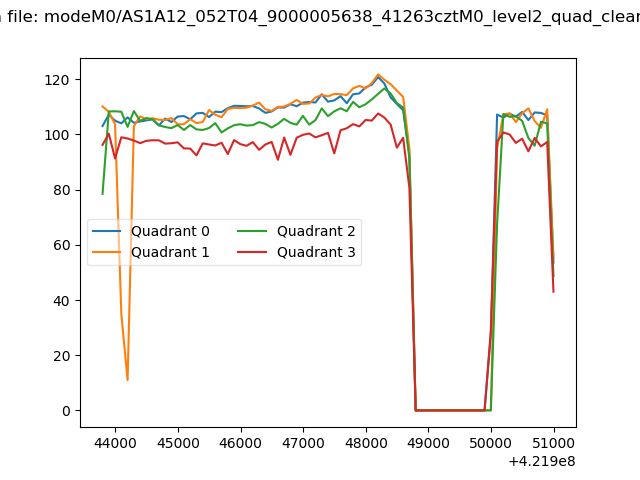 |
|
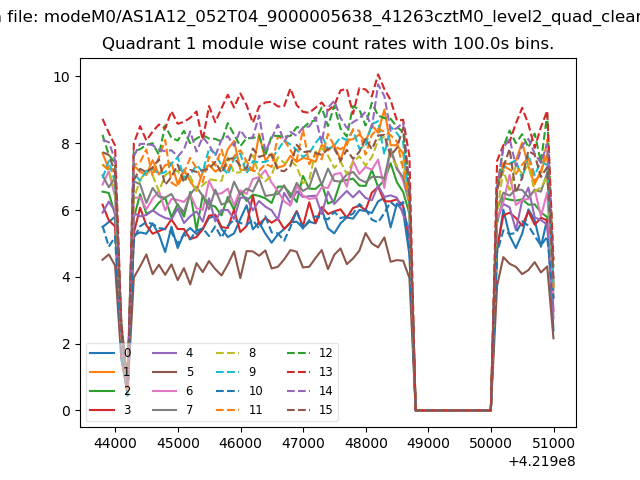
| Module-wise count rates for Quadrant A Data is divided into 100 sec bins |
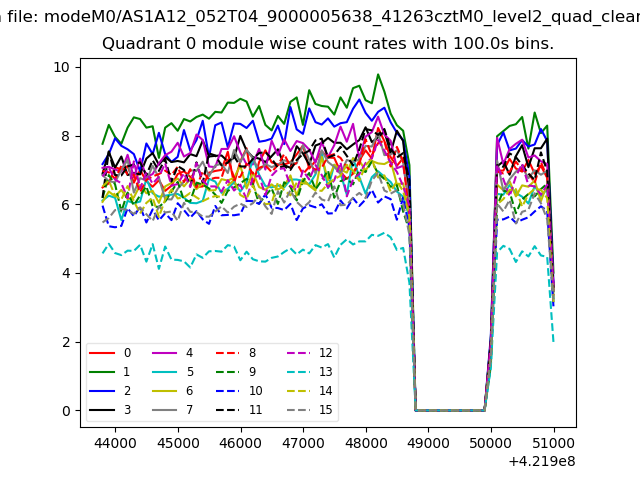 |
 |
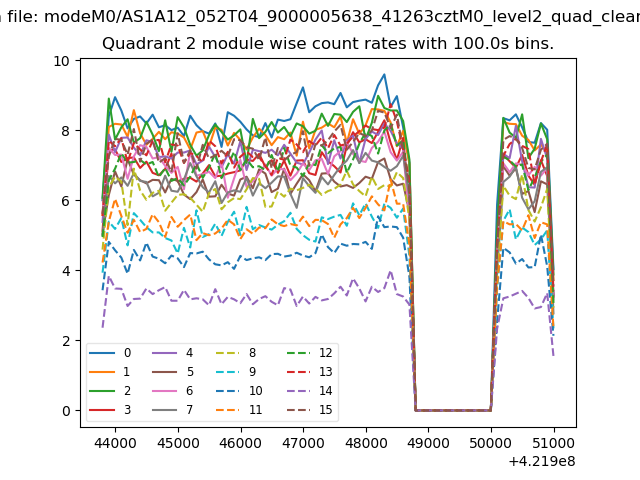
| Module-wise count rates for Quadrant B Data is divided into 100 sec bins |
 |
 |
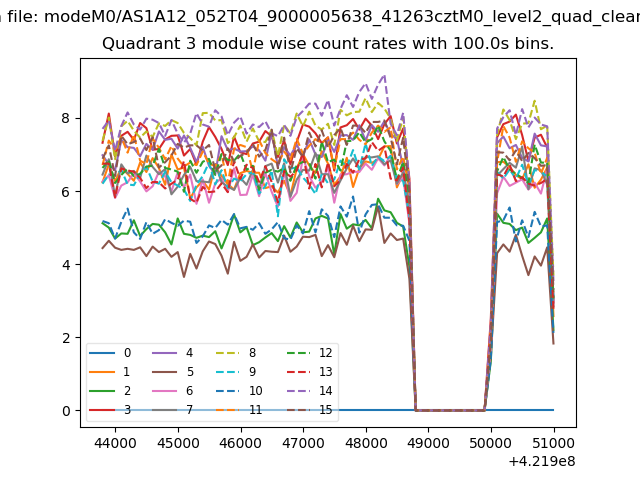
| Module-wise count rates for Quadrant C Data is divided into 100 sec bins |
 |
 |
| Module-wise count rates for Quadrant D Data is divided into 100 sec bins |
 |
 |
| Parameter | Plot |
|---|---|
| CZT HV Monitor | 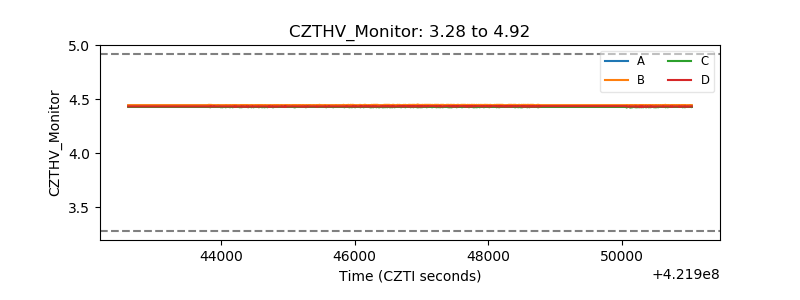 |
| D_VDD | 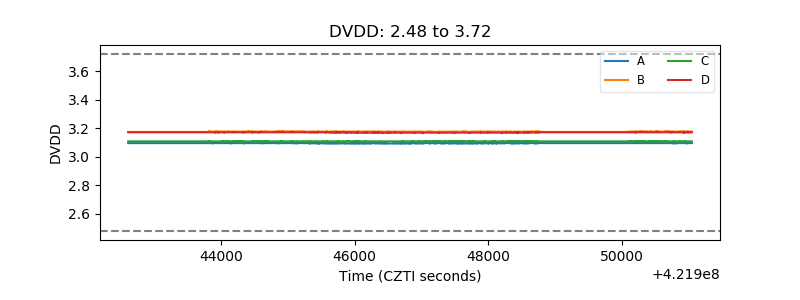 |
| Temperature 1 | 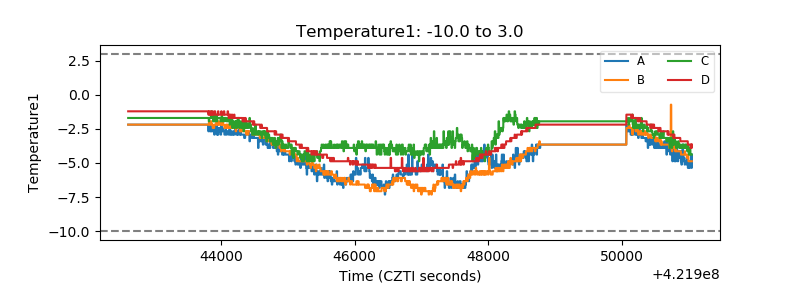 |
| Veto HV Monitor | 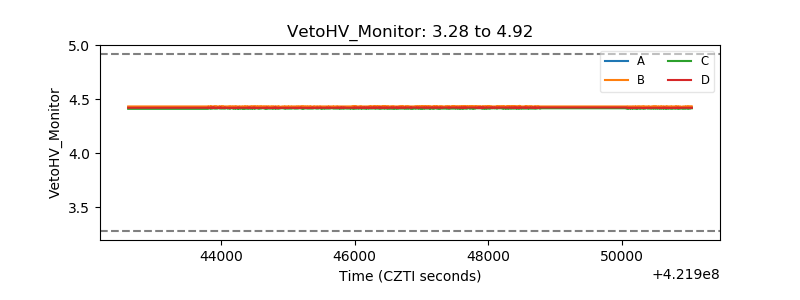 |
| Veto LLD | 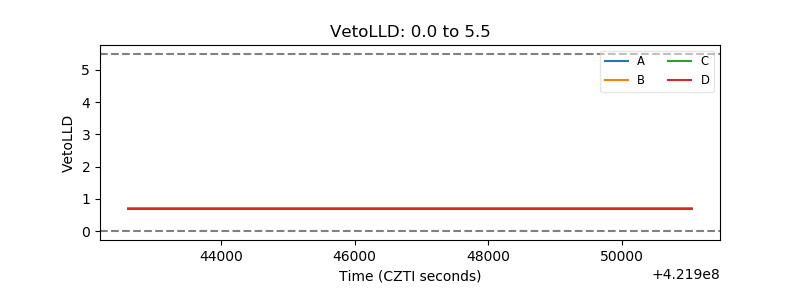 |
| Alpha Counter | 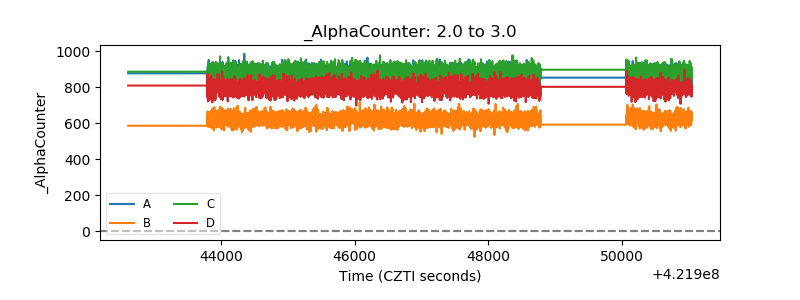 |
| _CPM_Rate | 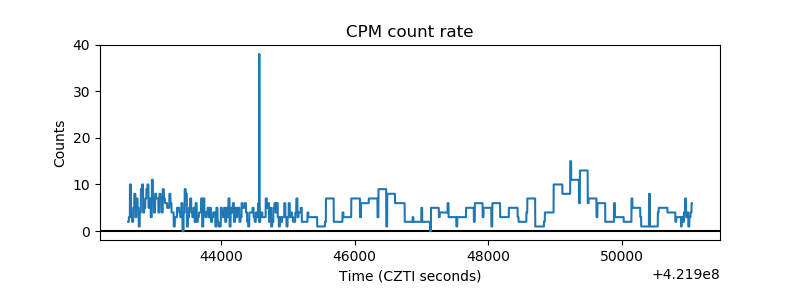 |
| CZT Counter | 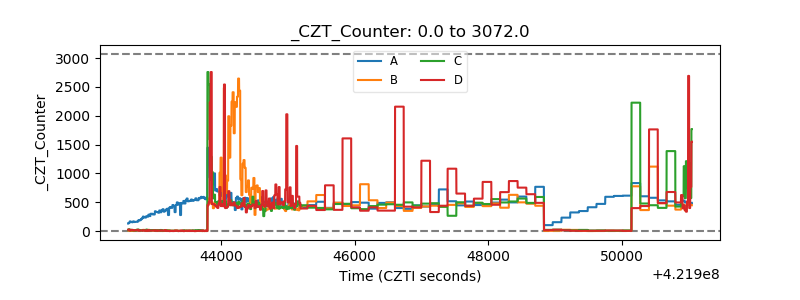 |
| +2.5 Volts monitor | 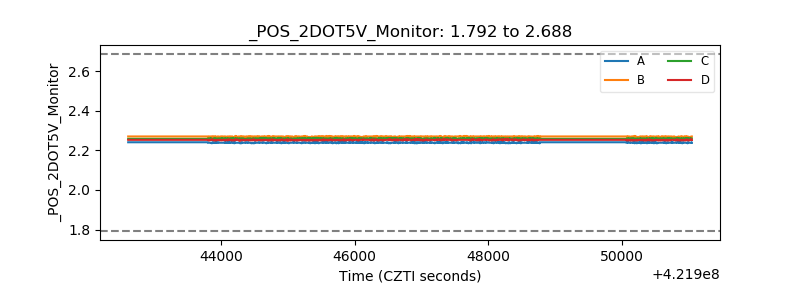 |
| +5 Volts monitor | 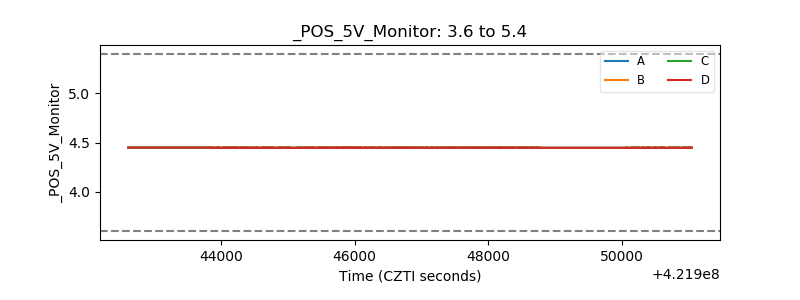 |
| _ROLL_ROT | 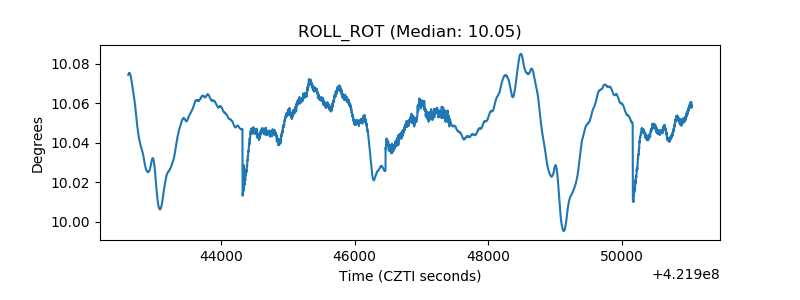 |
| _Roll_DEC |  |
| _Roll_RA | 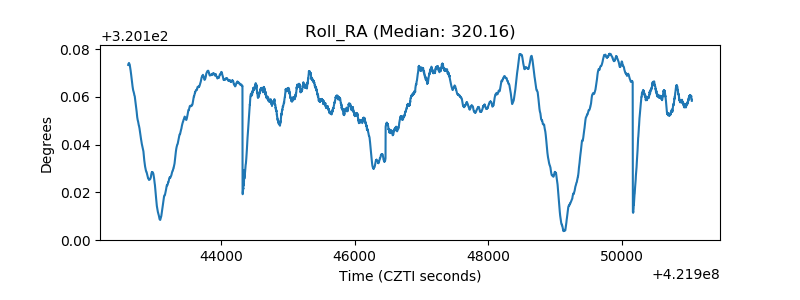 |
| Veto Counter | 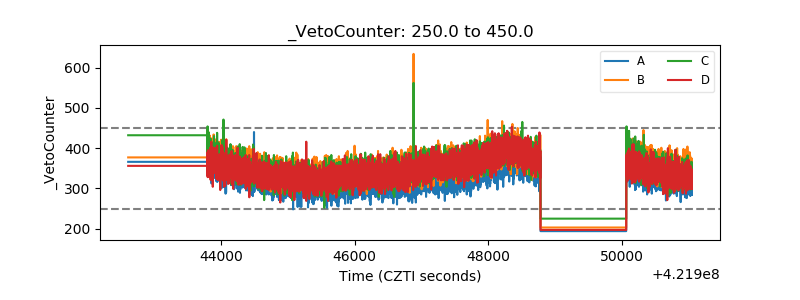 |