| Param | Original file | Final file |
|---|---|---|
| Filename | modeM0/AS1A12_052T04_9000005638_41265cztM0_level2.fits | modeM0/AS1A12_052T04_9000005638_41265cztM0_level2_quad_clean.evt |
| Size (bytes) | 524,151,360 | 126,584,640 |
| Size | 499.9 MB | 120.7 MB |
| Events in quadrant A | 4,080,773 | 873,725 |
| Events in quadrant B | 4,790,124 | 801,111 |
| Events in quadrant C | 4,673,908 | 815,177 |
| Events in quadrant D | 5,228,818 | 780,984 |
| Mode M9 | |||
|---|---|---|---|
| Quadrant | BADHDUFLAG | Total packets | Discarded packets |
| A | 0 | 22 | 0 |
| B | 0 | 22 | 0 |
| C | 0 | 22 | 0 |
| D | 0 | 23 | 0 |
| Mode SS | |||
|---|---|---|---|
| Quadrant | BADHDUFLAG | Total packets | Discarded packets |
| A | 0 | 162 | 0 |
| B | 0 | 162 | 0 |
| C | 0 | 162 | 0 |
| D | 0 | 162 | 0 |
| Mode M0 | |||
|---|---|---|---|
| Quadrant | BADHDUFLAG | Total packets | Discarded packets |
| A | 0 | 17208 | 3 |
| B | 0 | 19954 | 2 |
| C | 0 | 19282 | 2 |
| D | 0 | 21336 | 2 |
| Quadrant | Total seconds | Saturated seconds | Saturation percentage |
|---|---|---|---|
| A | 8090 | 27 | 0.333745% |
| B | 8090 | 767 | 9.480841% |
| C | 8090 | 325 | 4.017305% |
| D | 8090 | 111 | 1.372064% |
Noise dominated data is calculated using 1-second bins in cleaned event files. If a bin has >2000 counts, and if more than 50% of those come from <1% of pixels, then it is considered to be noise-dominated and hence unusable.
| Quadrant | # 1 sec bins | Bins with >0 counts | Bins with >2000 counts | High rate bins dominated by noise | Noise dominated (total time) | Noise dominated (detector-on time) | Marked lightcurve |
|---|---|---|---|---|---|---|---|
| A | 9433 | 8091 | 11 | 11 | 0.12% | 0.14% | 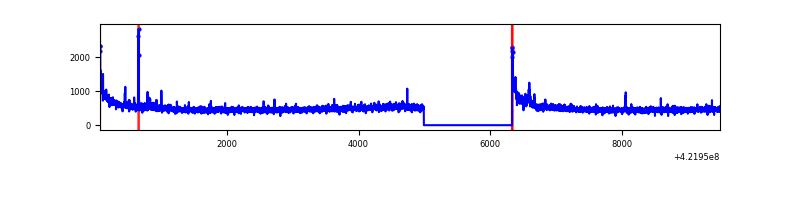 |
| B | 9433 | 8091 | 202 | 202 | 2.14% | 2.50% | 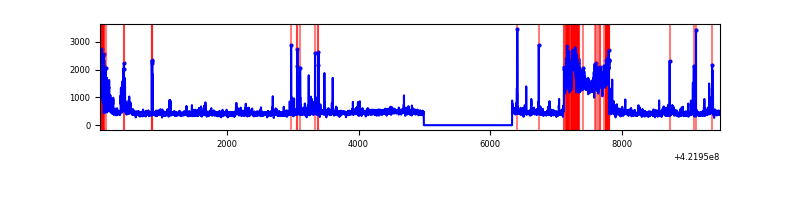 |
| C | 9433 | 8091 | 278 | 278 | 2.95% | 3.44% | 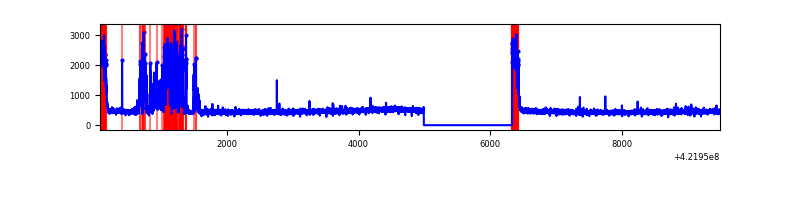 |
| D | 9433 | 8091 | 130 | 130 | 1.38% | 1.61% | 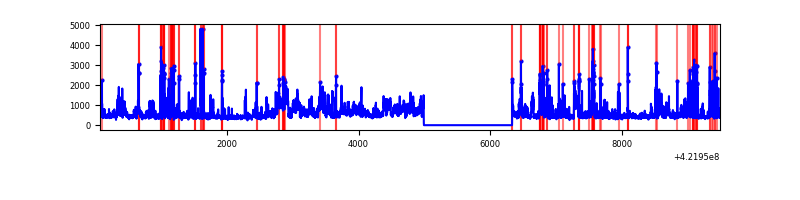 |
Top three noisy pixels from each quadrant. If the there are fewer than three noisy pixels in the level2.evt file, extra rows are filled as -1
| Pixel properties | Quadrant properties | ||||||
|---|---|---|---|---|---|---|---|
| Quadrant | DetID | PixID | Counts | Sigma | Mean | Median | Sigma |
| A | 10 | 83 | 678225 | 3867.55 | 860 | 841 | 175.1 |
| A | 13 | 248 | 37951 | 211.88 | 860 | 841 | 175.1 |
| A | 12 | 189 | 35057 | 195.36 | 860 | 841 | 175.1 |
| B | 0 | 229 | 1212909 | 7875.39 | 787 | 763 | 153.9 |
| B | 0 | 186 | 197058 | 1275.34 | 787 | 763 | 153.9 |
| B | 0 | 190 | 153351 | 991.37 | 787 | 763 | 153.9 |
| C | 9 | 54 | 674838 | 3446.09 | 832 | 837 | 195.6 |
| C | 0 | 10 | 410962 | 2096.92 | 832 | 837 | 195.6 |
| C | 15 | 214 | 337341 | 1720.51 | 832 | 837 | 195.6 |
| D | 2 | 120 | 876108 | 4278.43 | 836 | 812 | 204.6 |
| D | 1 | 52 | 457416 | 2231.87 | 836 | 812 | 204.6 |
| D | 13 | 249 | 174881 | 850.85 | 836 | 812 | 204.6 |
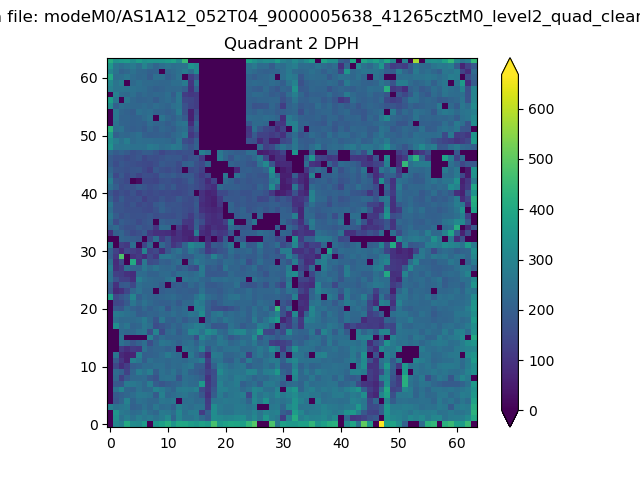
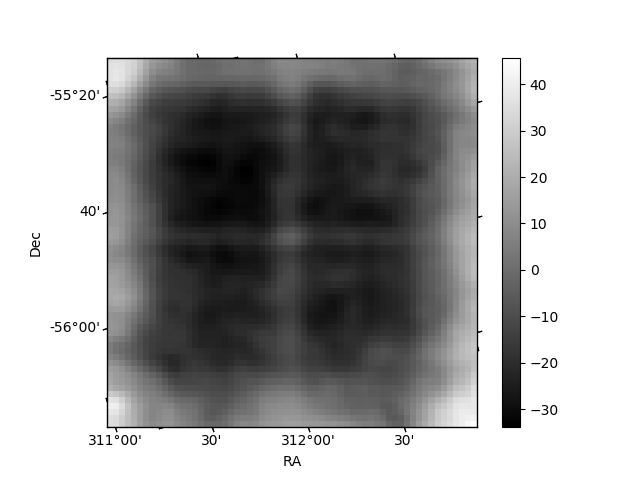
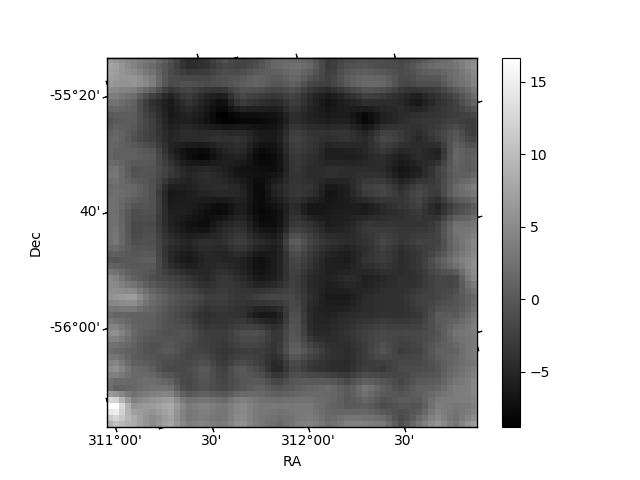
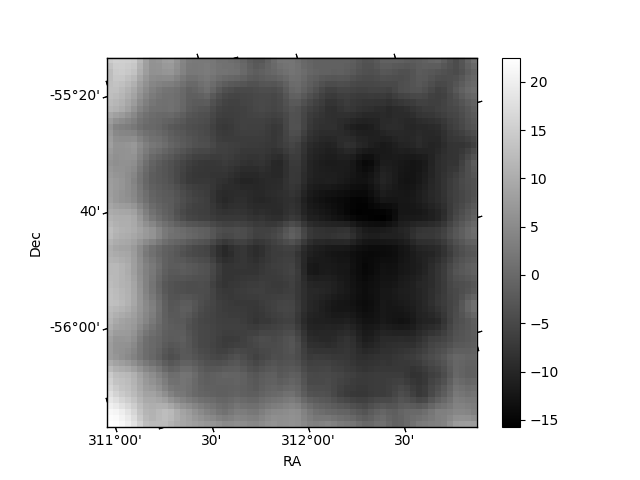
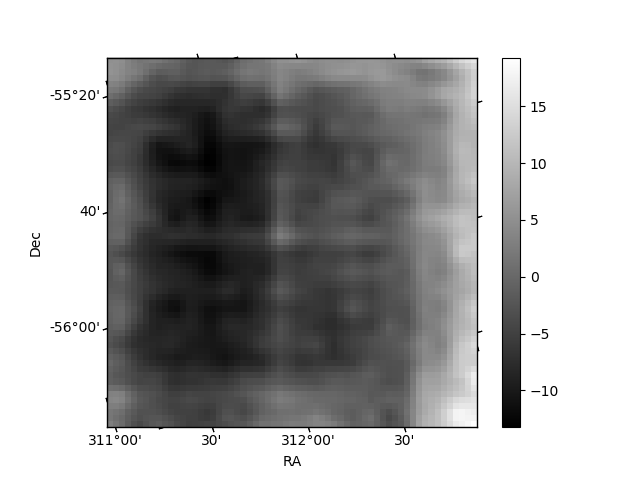
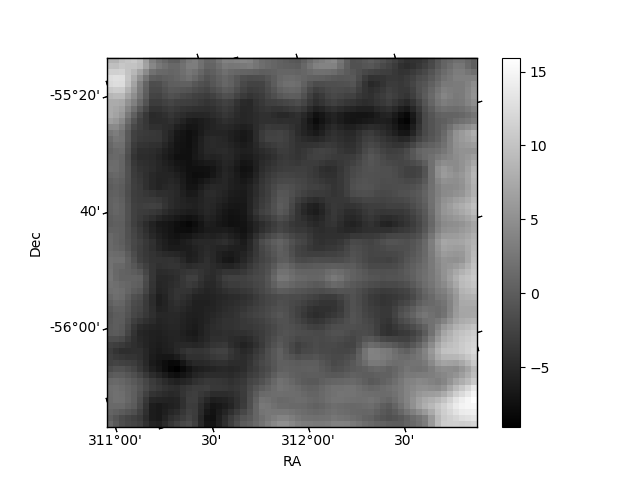
Histogram calculated using DETX and DETY for each event in the final _common_clean file
| Quadrant A | 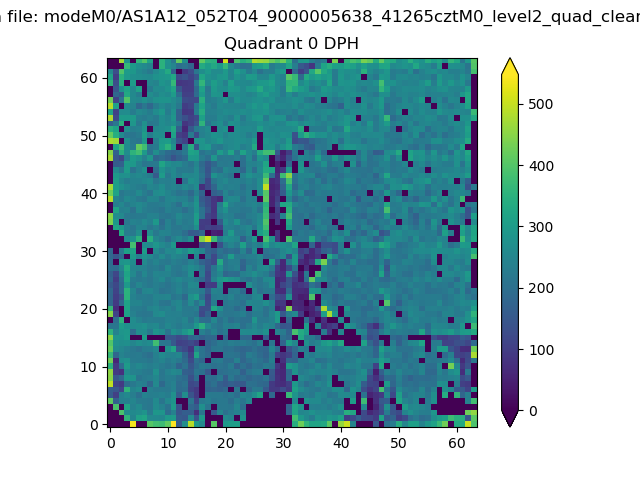 |
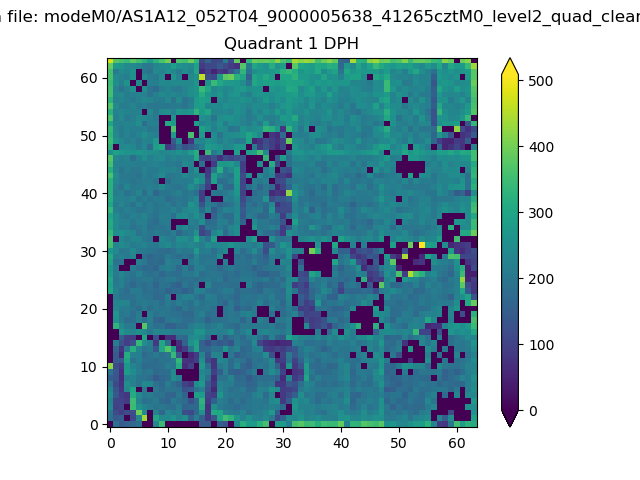 |
Quadrant B |
|---|---|---|---|
| Quadrant D | 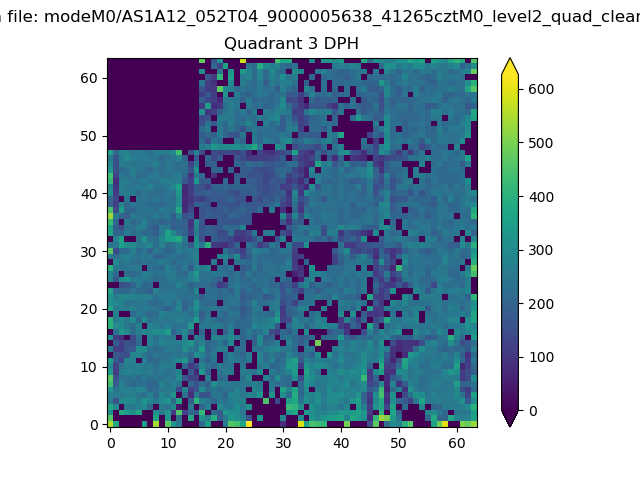 |
 |
Quadrant C |
| Plot type | Count rate plots | Images |
|---|---|---|
| Comparison with Poisson distribution Blue bars denote a histogram of data divided into 1 sec bins. Red curve is a Poisson curve with rate = median count rate of data. |
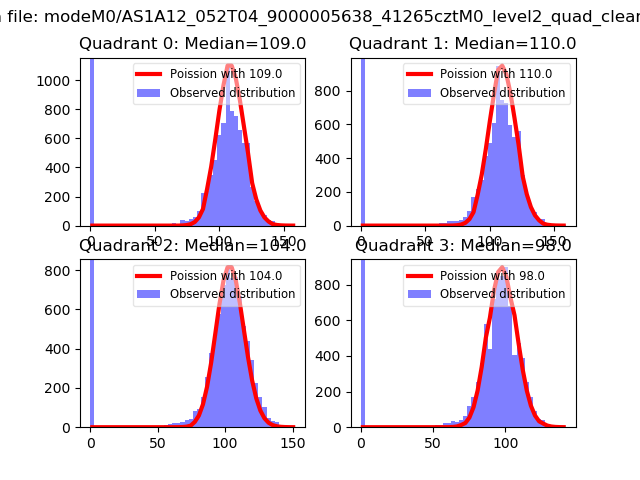 |
 |
| Quadrant-wise count rates Data is divided into 100 sec bins |
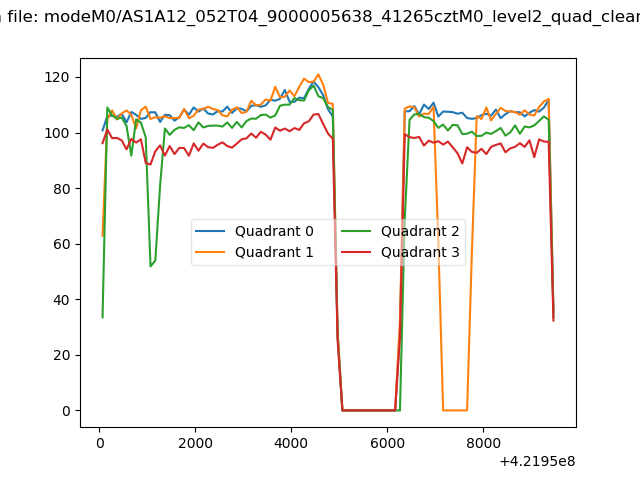 |
|
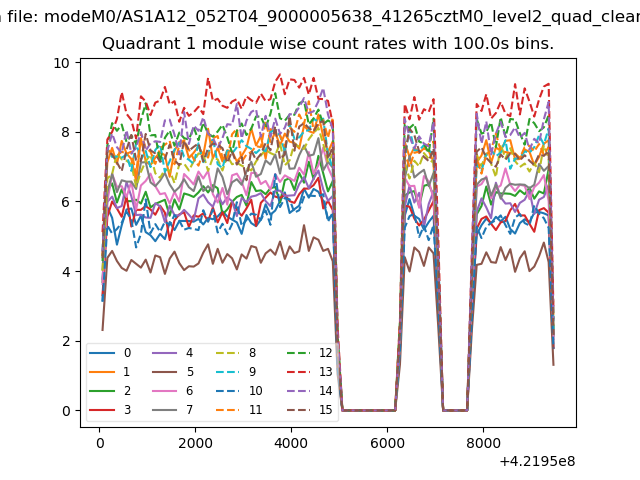
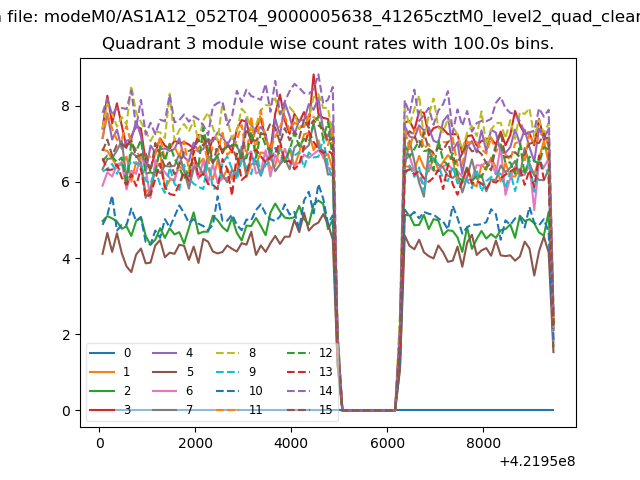
| Module-wise count rates for Quadrant A Data is divided into 100 sec bins |
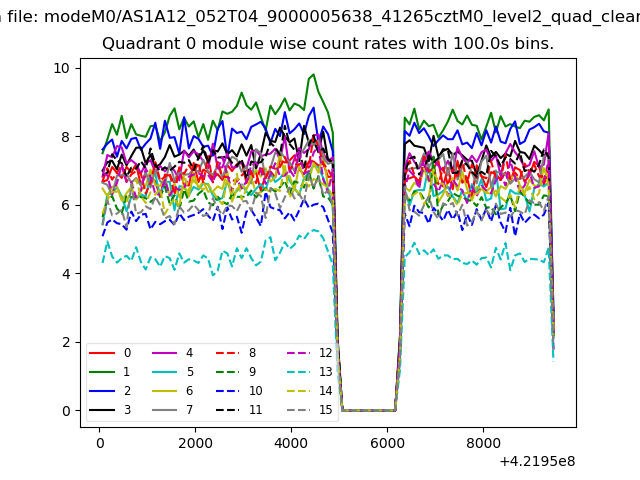 |
 |
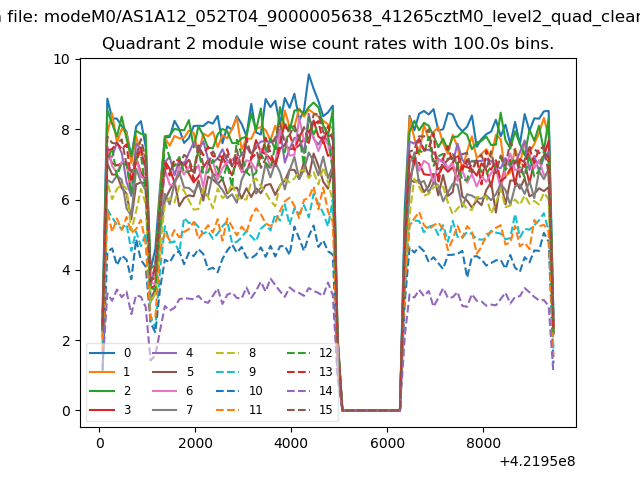
| Module-wise count rates for Quadrant B Data is divided into 100 sec bins |
 |
 |
| Module-wise count rates for Quadrant C Data is divided into 100 sec bins |
 |
 |
| Module-wise count rates for Quadrant D Data is divided into 100 sec bins |
 |
 |
| Parameter | Plot |
|---|---|
| CZT HV Monitor |  |
| D_VDD | 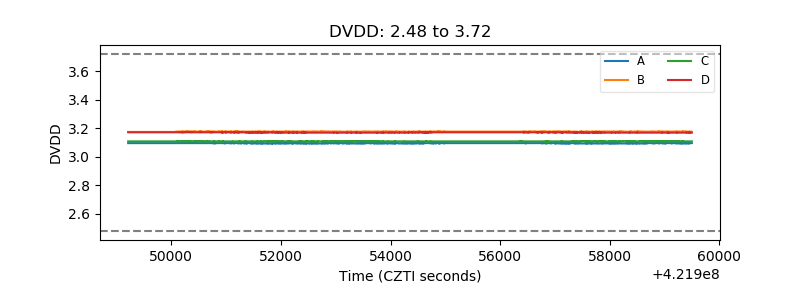 |
| Temperature 1 | 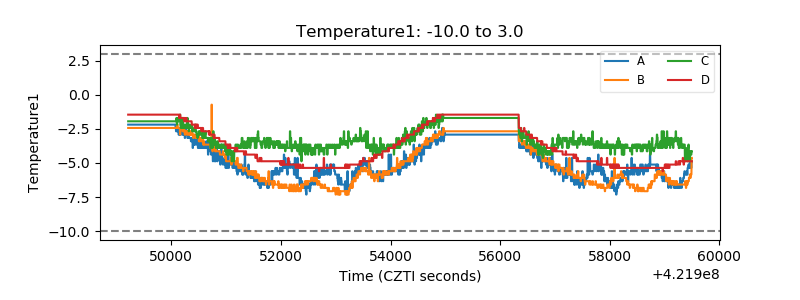 |
| Veto HV Monitor | 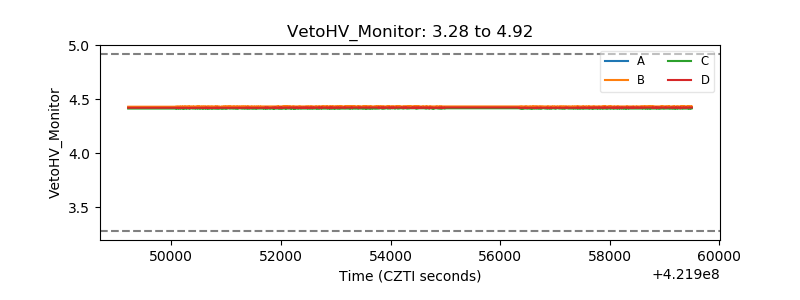 |
| Veto LLD | 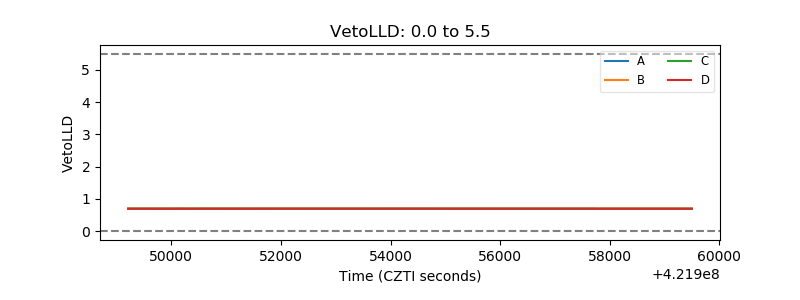 |
| Alpha Counter | 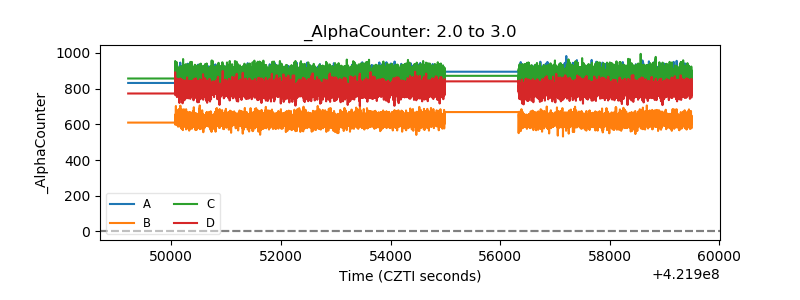 |
| _CPM_Rate | 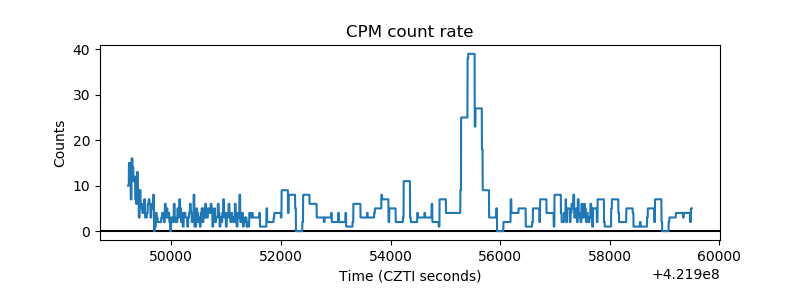 |
| CZT Counter | 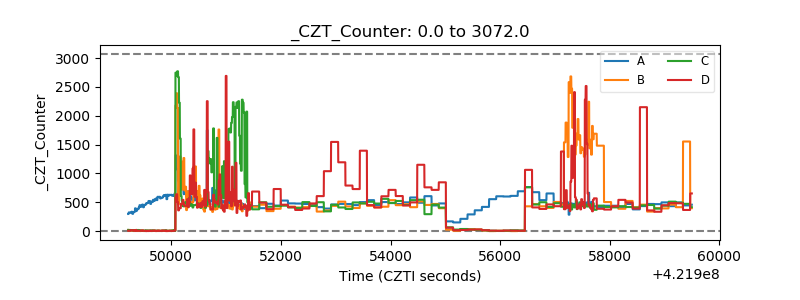 |
| +2.5 Volts monitor | 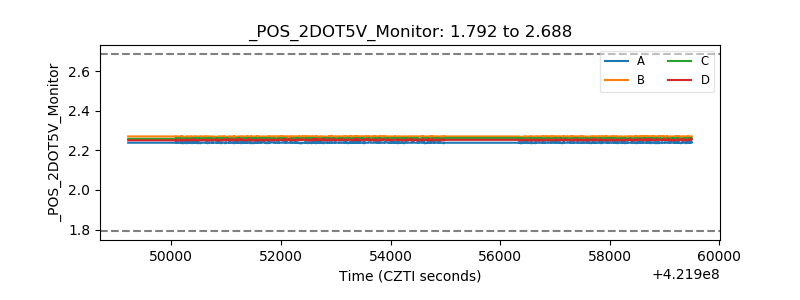 |
| +5 Volts monitor | 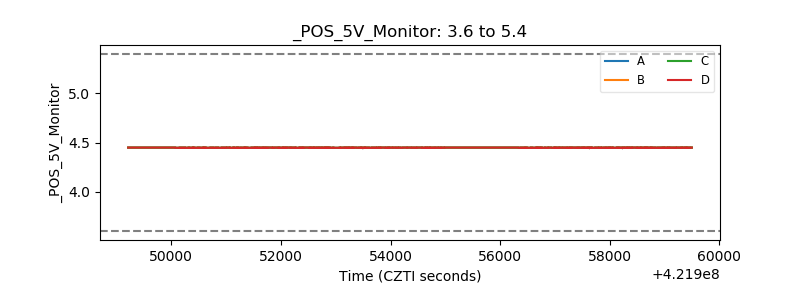 |
| _ROLL_ROT | 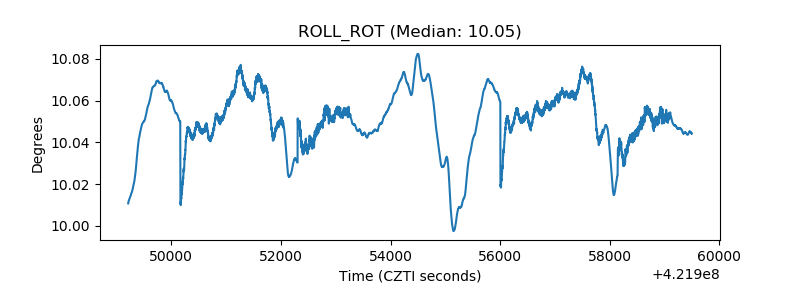 |
| _Roll_DEC |  |
| _Roll_RA | 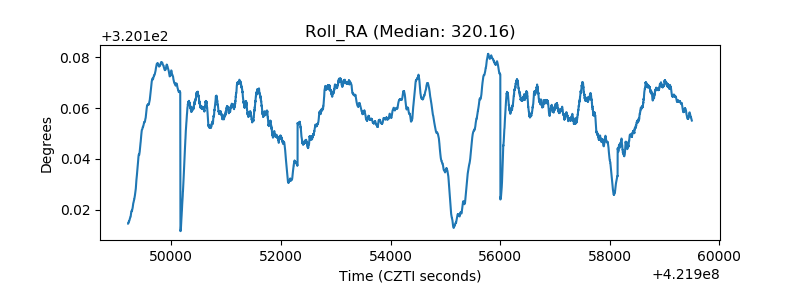 |
| Veto Counter | 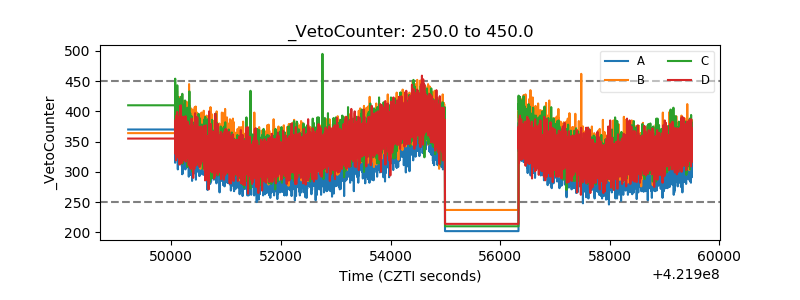 |