| Param | Original file | Final file |
|---|---|---|
| Filename | modeM0/AS1A12_052T04_9000005638_41266cztM0_level2.fits | modeM0/AS1A12_052T04_9000005638_41266cztM0_level2_quad_clean.evt |
| Size (bytes) | 471,669,120 | 125,775,360 |
| Size | 449.8 MB | 119.9 MB |
| Events in quadrant A | 3,961,629 | 846,886 |
| Events in quadrant B | 4,501,408 | 852,278 |
| Events in quadrant C | 3,899,434 | 816,868 |
| Events in quadrant D | 4,495,182 | 753,436 |
| Mode M9 | |||
|---|---|---|---|
| Quadrant | BADHDUFLAG | Total packets | Discarded packets |
| A | 0 | 29 | 0 |
| B | 0 | 29 | 0 |
| C | 0 | 29 | 0 |
| D | 0 | 29 | 0 |
| Mode SS | |||
|---|---|---|---|
| Quadrant | BADHDUFLAG | Total packets | Discarded packets |
| A | 0 | 160 | 0 |
| B | 0 | 160 | 0 |
| C | 0 | 160 | 0 |
| D | 0 | 160 | 0 |
| Mode M0 | |||
|---|---|---|---|
| Quadrant | BADHDUFLAG | Total packets | Discarded packets |
| A | 0 | 16389 | 3 |
| B | 0 | 18431 | 2 |
| C | 0 | 16465 | 2 |
| D | 0 | 18871 | 2 |
| Quadrant | Total seconds | Saturated seconds | Saturation percentage |
|---|---|---|---|
| A | 7747 | 13 | 0.167807% |
| B | 7747 | 155 | 2.000774% |
| C | 7747 | 97 | 1.252098% |
| D | 7747 | 195 | 2.517103% |
Noise dominated data is calculated using 1-second bins in cleaned event files. If a bin has >2000 counts, and if more than 50% of those come from <1% of pixels, then it is considered to be noise-dominated and hence unusable.
| Quadrant | # 1 sec bins | Bins with >0 counts | Bins with >2000 counts | High rate bins dominated by noise | Noise dominated (total time) | Noise dominated (detector-on time) | Marked lightcurve |
|---|---|---|---|---|---|---|---|
| A | 10704 | 7749 | 4 | 4 | 0.04% | 0.05% | 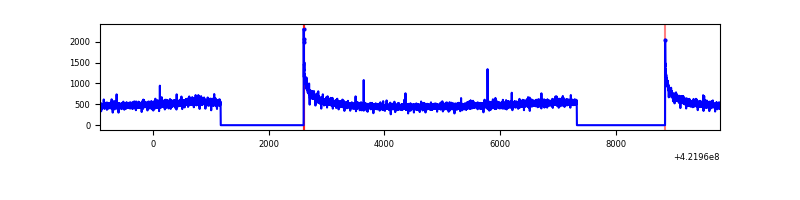 |
| B | 10704 | 7749 | 97 | 97 | 0.91% | 1.25% | 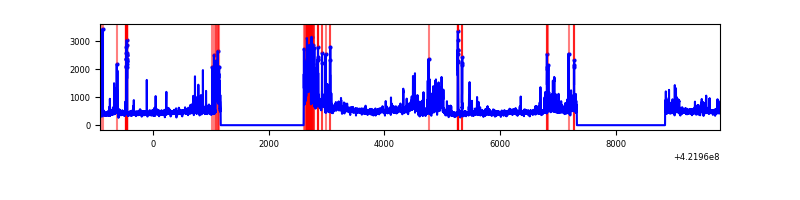 |
| C | 10704 | 7749 | 95 | 95 | 0.89% | 1.23% | 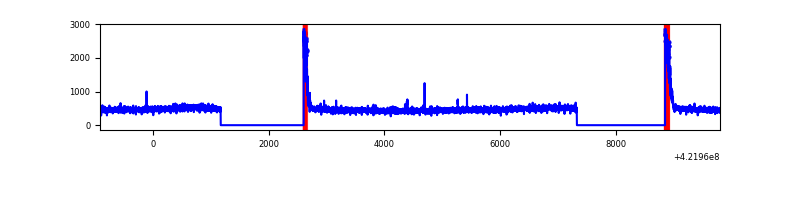 |
| D | 10704 | 7749 | 196 | 196 | 1.83% | 2.53% | 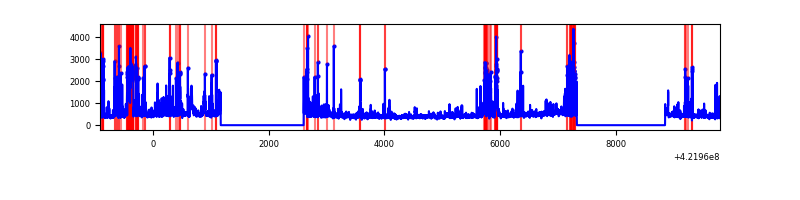 |
Top three noisy pixels from each quadrant. If the there are fewer than three noisy pixels in the level2.evt file, extra rows are filled as -1
| Pixel properties | Quadrant properties | ||||||
|---|---|---|---|---|---|---|---|
| Quadrant | DetID | PixID | Counts | Sigma | Mean | Median | Sigma |
| A | 10 | 83 | 646092 | 3688.42 | 854 | 837 | 174.9 |
| A | 13 | 254 | 11723 | 62.23 | 854 | 837 | 174.9 |
| A | 3 | 137 | 9481 | 49.41 | 854 | 837 | 174.9 |
| B | 5 | 185 | 511032 | 3138.85 | 839 | 814 | 162.5 |
| B | 5 | 255 | 378637 | 2324.36 | 839 | 814 | 162.5 |
| B | 0 | 190 | 116544 | 711.97 | 839 | 814 | 162.5 |
| C | 15 | 214 | 328504 | 1666.69 | 835 | 838 | 196.6 |
| C | 0 | 10 | 310678 | 1576.01 | 835 | 838 | 196.6 |
| C | 7 | 220 | 10986 | 51.62 | 835 | 838 | 196.6 |
| D | 1 | 52 | 946576 | 4654.65 | 833 | 811 | 203.2 |
| D | 13 | 249 | 129348 | 632.6 | 833 | 811 | 203.2 |
| D | 8 | 230 | 90455 | 441.19 | 833 | 811 | 203.2 |
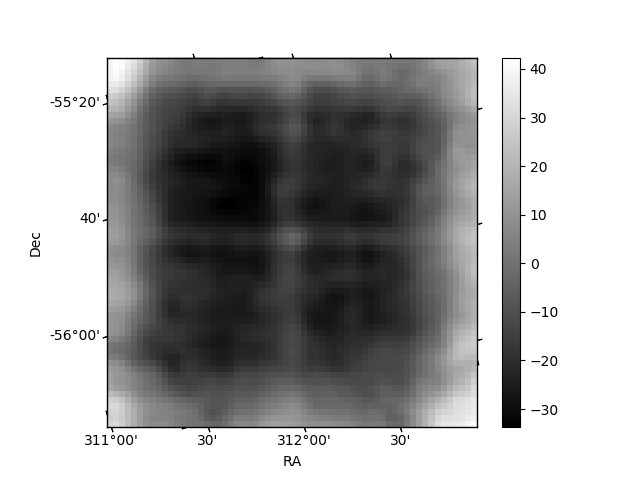
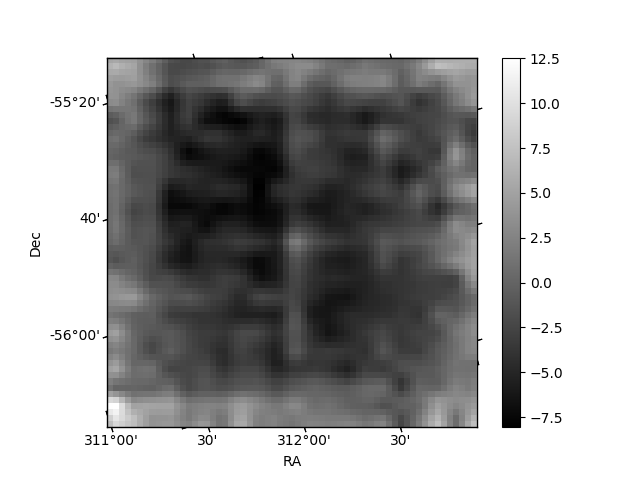
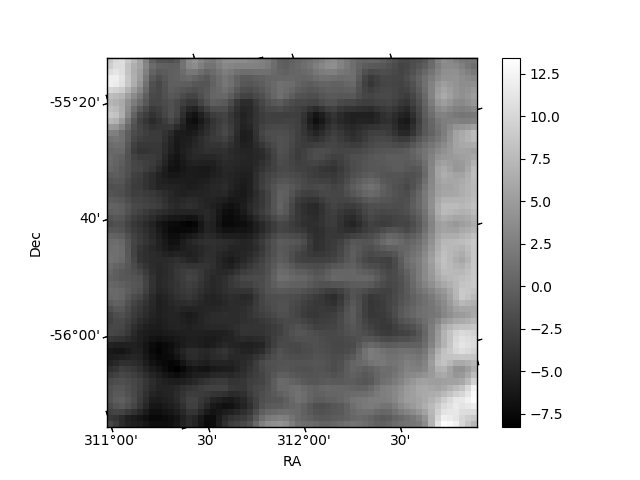
Histogram calculated using DETX and DETY for each event in the final _common_clean file
| Quadrant A | 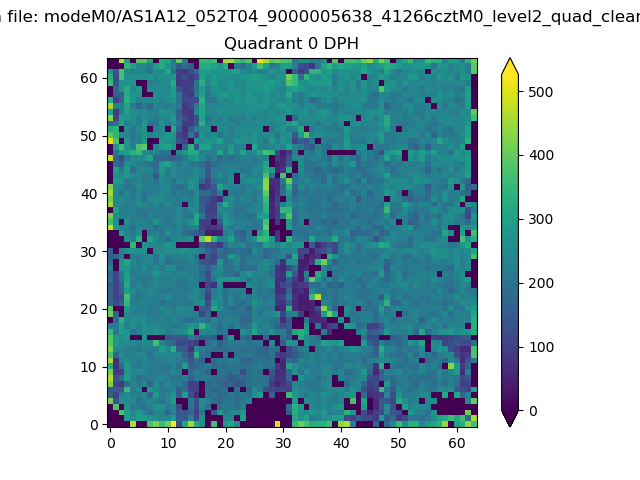 |
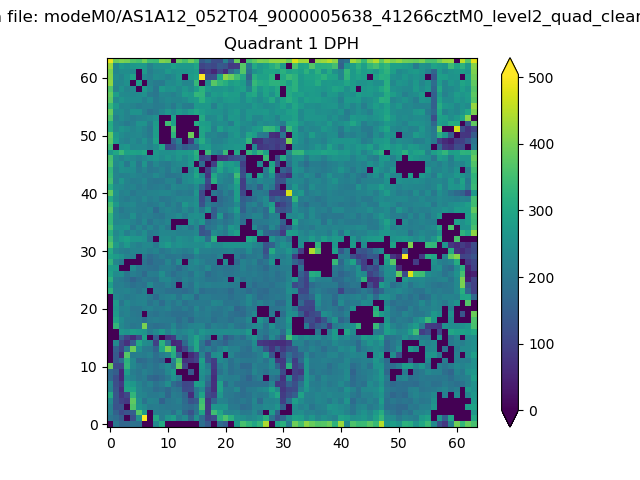 |
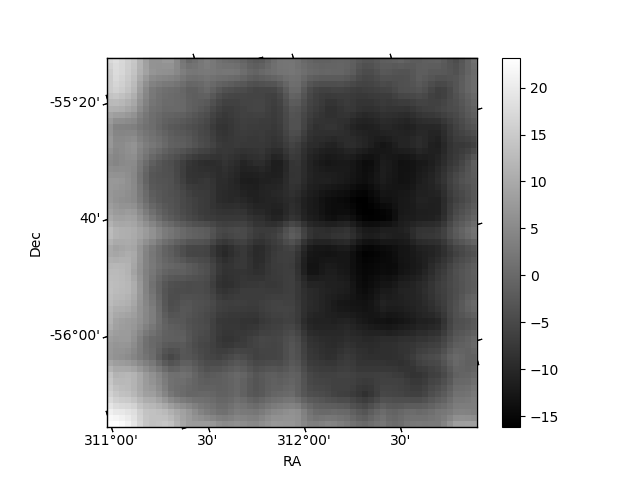
Quadrant B |
|---|---|---|---|
| Quadrant D | 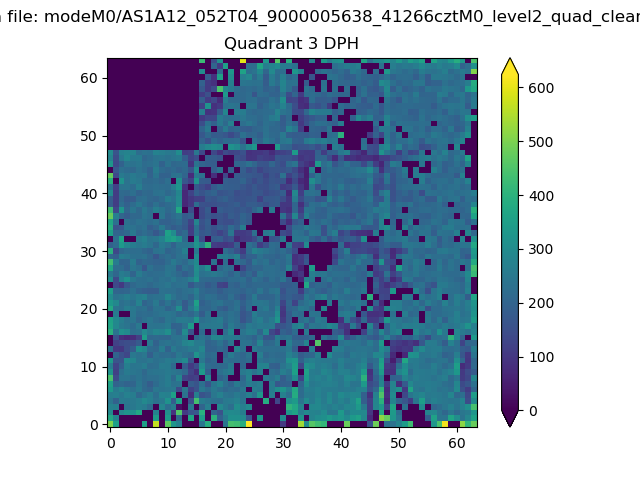 |
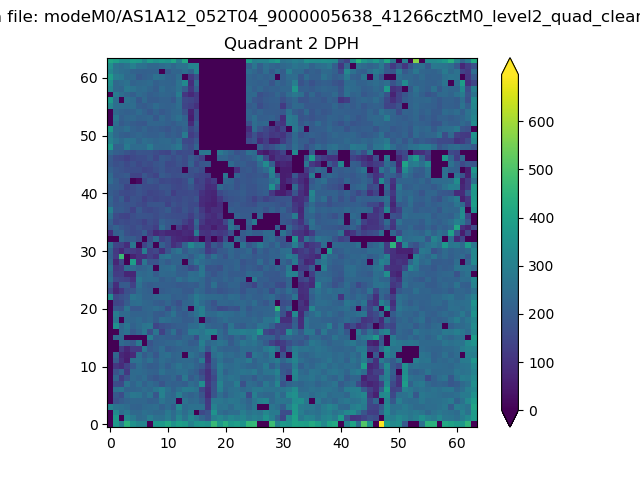 |
Quadrant C |
| Plot type | Count rate plots | Images |
|---|---|---|
| Comparison with Poisson distribution Blue bars denote a histogram of data divided into 1 sec bins. Red curve is a Poisson curve with rate = median count rate of data. |
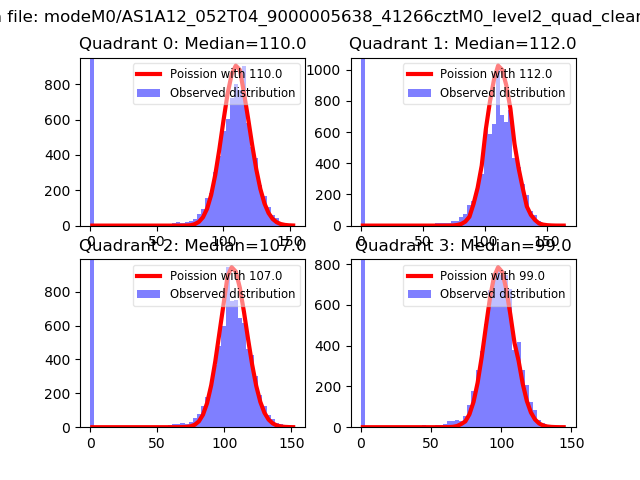 |
 |
| Quadrant-wise count rates Data is divided into 100 sec bins |
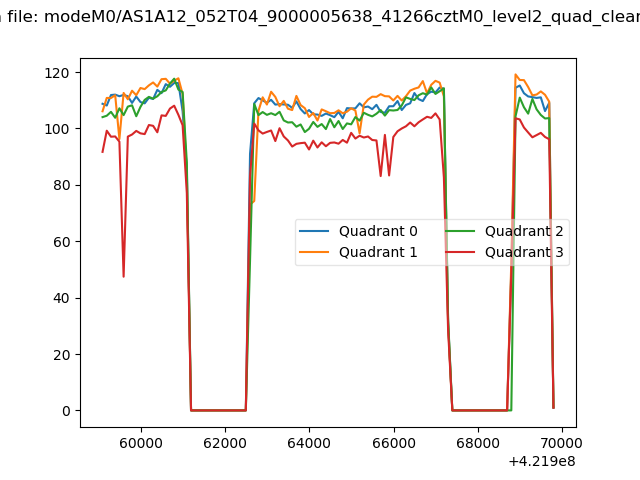 |
|
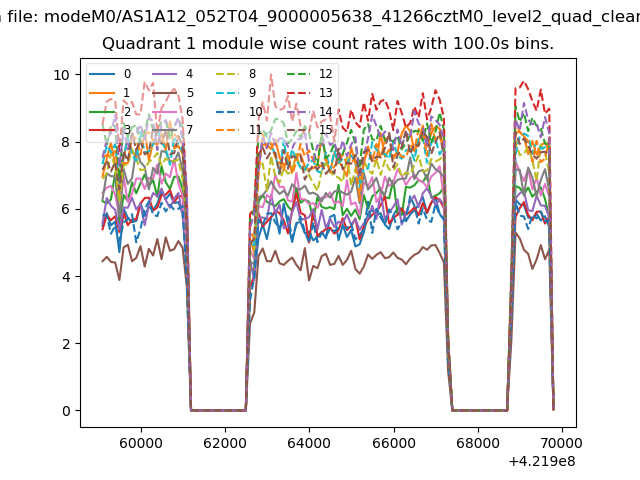
| Module-wise count rates for Quadrant A Data is divided into 100 sec bins |
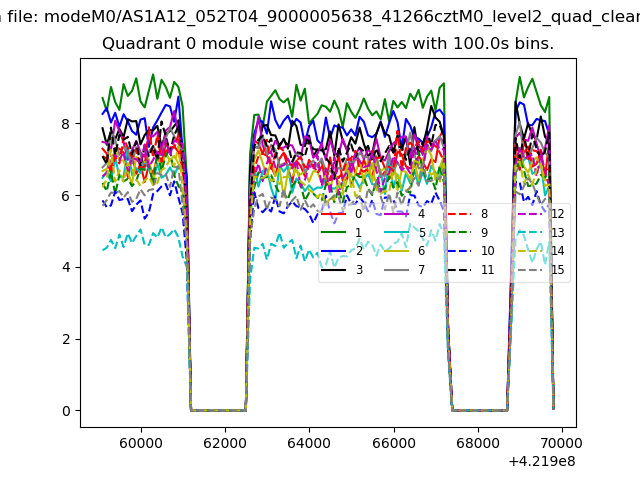 |
 |
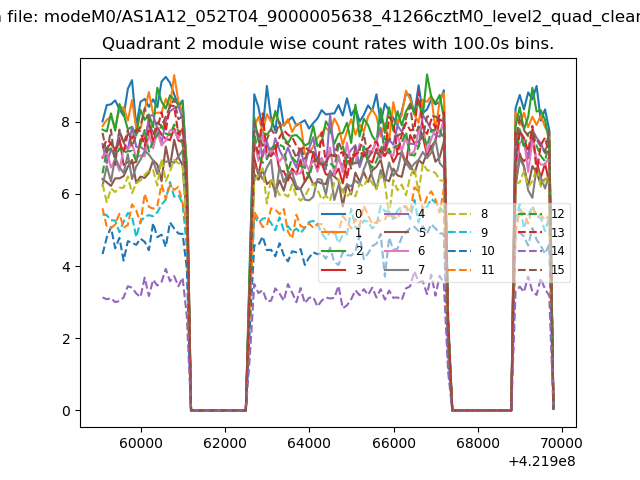
| Module-wise count rates for Quadrant B Data is divided into 100 sec bins |
 |
 |
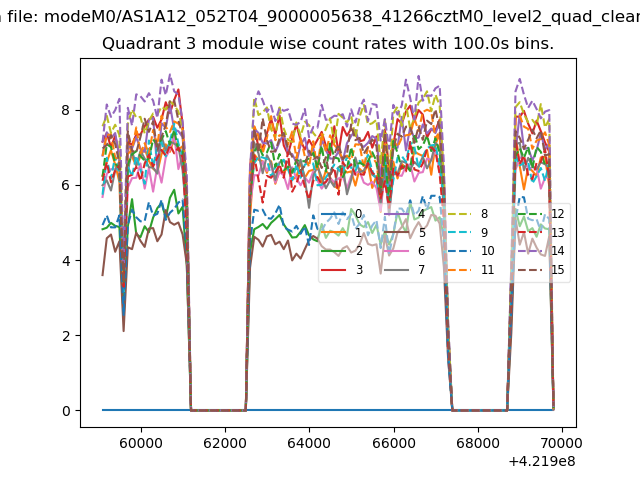
| Module-wise count rates for Quadrant C Data is divided into 100 sec bins |
 |
 |
| Module-wise count rates for Quadrant D Data is divided into 100 sec bins |
 |
 |
| Parameter | Plot |
|---|---|
| CZT HV Monitor | 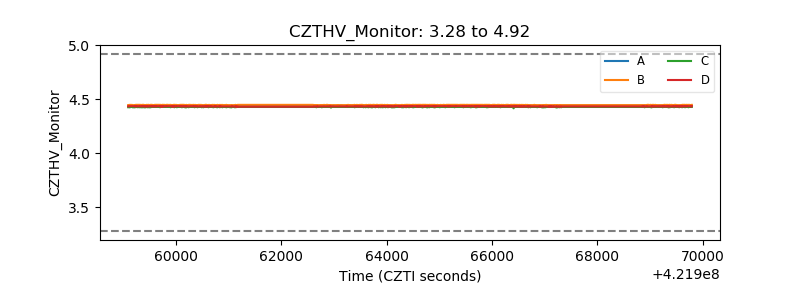 |
| D_VDD | 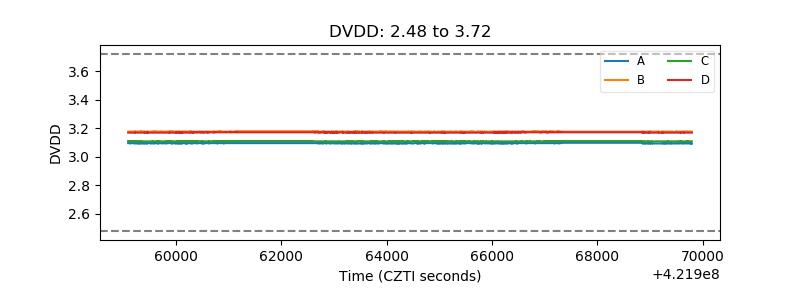 |
| Temperature 1 | 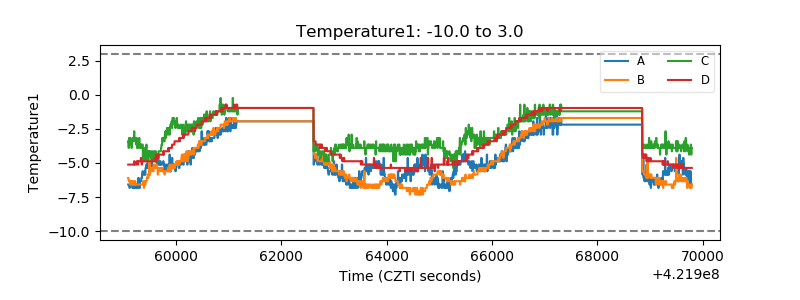 |
| Veto HV Monitor | 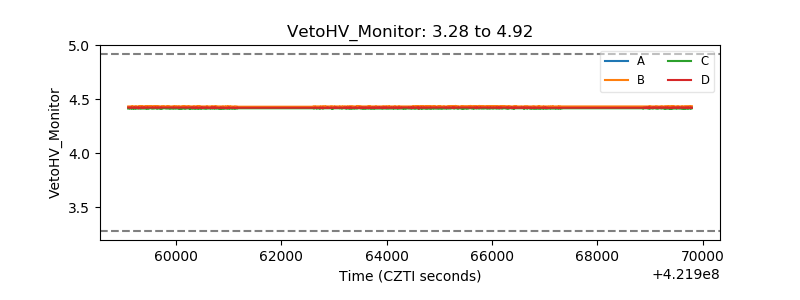 |
| Veto LLD | 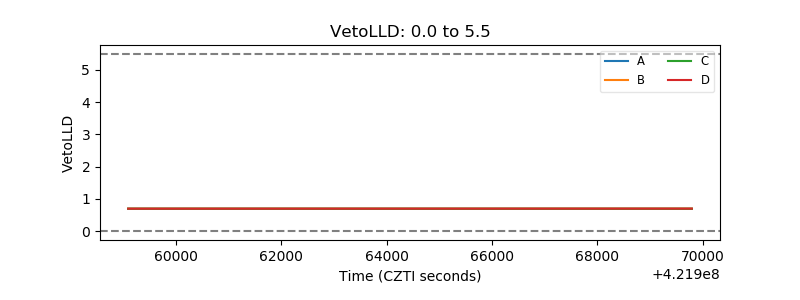 |
| Alpha Counter | 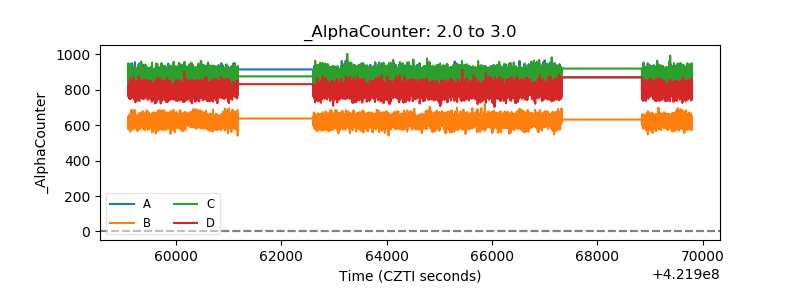 |
| _CPM_Rate | 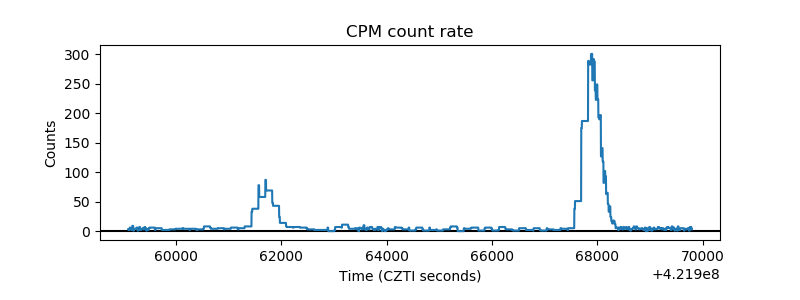 |
| CZT Counter | 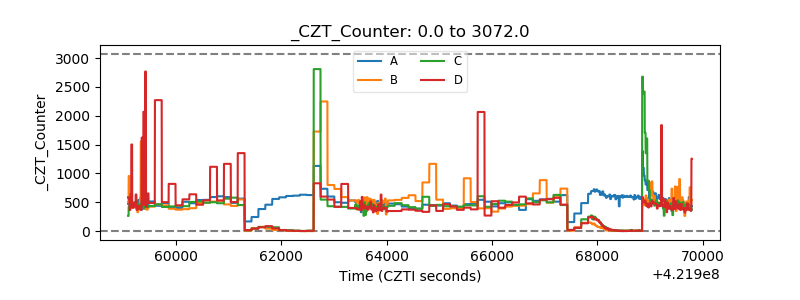 |
| +2.5 Volts monitor | 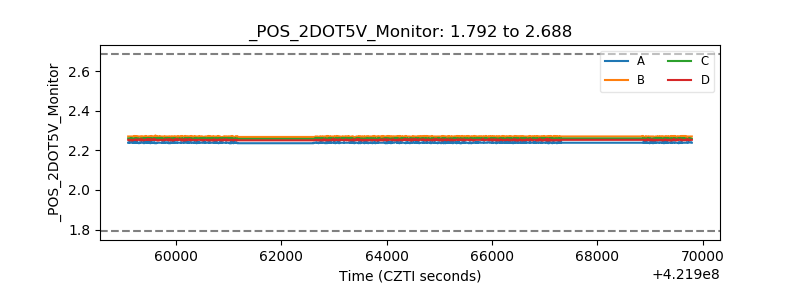 |
| +5 Volts monitor | 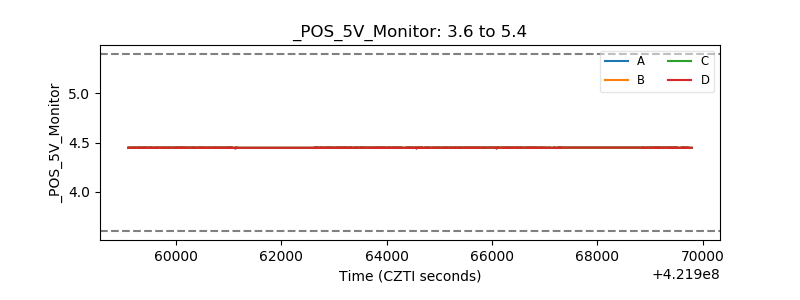 |
| _ROLL_ROT | 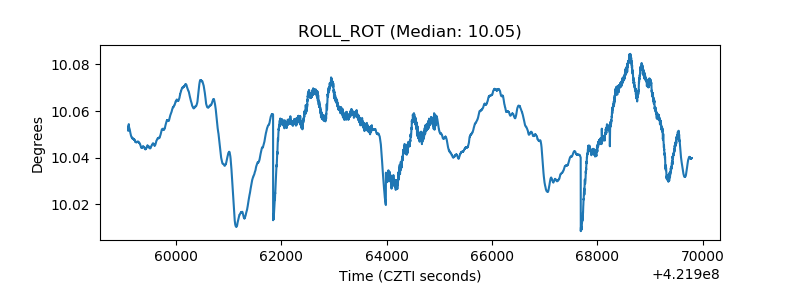 |
| _Roll_DEC |  |
| _Roll_RA | 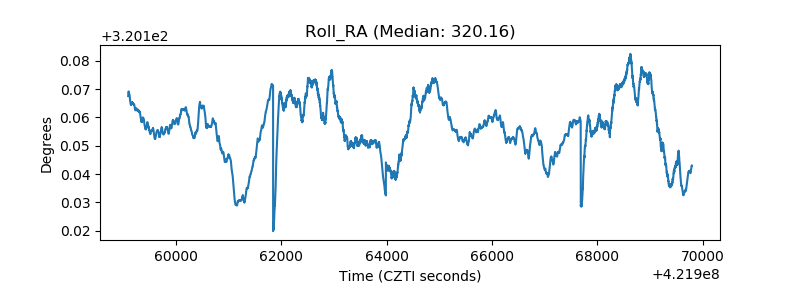 |
| Veto Counter | 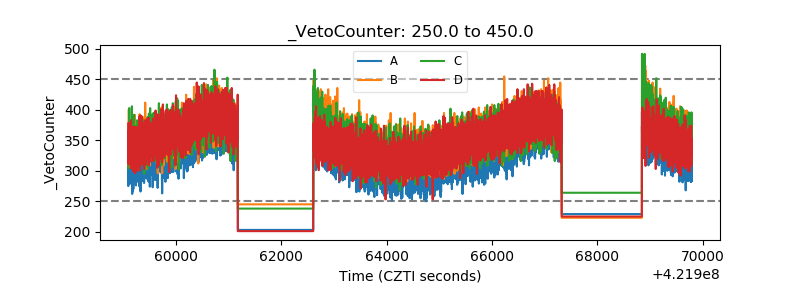 |