| Param | Original file | Final file |
|---|---|---|
| Filename | modeM0/AS1A12_052T04_9000005638_41267cztM0_level2.fits | modeM0/AS1A12_052T04_9000005638_41267cztM0_level2_quad_clean.evt |
| Size (bytes) | 328,239,360 | 87,448,320 |
| Size | 313.0 MB | 83.4 MB |
| Events in quadrant A | 2,774,932 | 595,838 |
| Events in quadrant B | 2,548,311 | 605,598 |
| Events in quadrant C | 2,909,586 | 563,026 |
| Events in quadrant D | 3,495,591 | 504,626 |
| Mode M9 | |||
|---|---|---|---|
| Quadrant | BADHDUFLAG | Total packets | Discarded packets |
| A | 0 | 26 | 0 |
| B | 0 | 26 | 0 |
| C | 0 | 26 | 0 |
| D | 0 | 27 | 0 |
| Mode SS | |||
|---|---|---|---|
| Quadrant | BADHDUFLAG | Total packets | Discarded packets |
| A | 0 | 110 | 0 |
| B | 0 | 110 | 0 |
| C | 0 | 110 | 0 |
| D | 0 | 110 | 0 |
| Mode M0 | |||
|---|---|---|---|
| Quadrant | BADHDUFLAG | Total packets | Discarded packets |
| A | 0 | 11616 | 3 |
| B | 0 | 11253 | 2 |
| C | 0 | 12112 | 2 |
| D | 0 | 14438 | 2 |
| Quadrant | Total seconds | Saturated seconds | Saturation percentage |
|---|---|---|---|
| A | 5410 | 11 | 0.203327% |
| B | 5410 | 5 | 0.092421% |
| C | 5410 | 156 | 2.883549% |
| D | 5410 | 386 | 7.134935% |
Noise dominated data is calculated using 1-second bins in cleaned event files. If a bin has >2000 counts, and if more than 50% of those come from <1% of pixels, then it is considered to be noise-dominated and hence unusable.
| Quadrant | # 1 sec bins | Bins with >0 counts | Bins with >2000 counts | High rate bins dominated by noise | Noise dominated (total time) | Noise dominated (detector-on time) | Marked lightcurve |
|---|---|---|---|---|---|---|---|
| A | 7083 | 5411 | 3 | 3 | 0.04% | 0.06% | 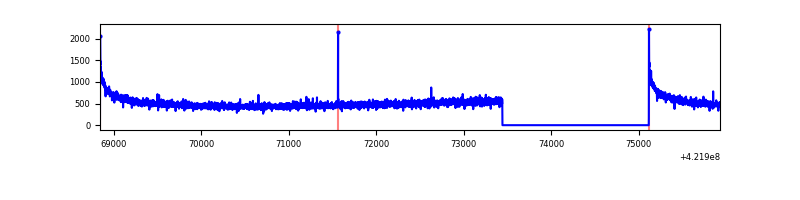 |
| B | 7083 | 5411 | 1 | 1 | 0.01% | 0.02% | 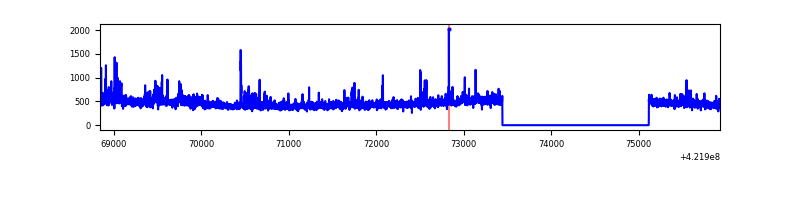 |
| C | 7083 | 5411 | 151 | 151 | 2.13% | 2.79% | 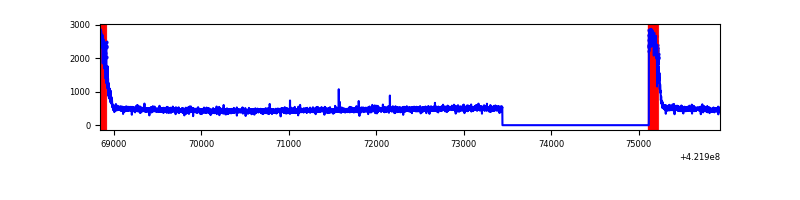 |
| D | 7083 | 5410 | 347 | 347 | 4.90% | 6.41% | 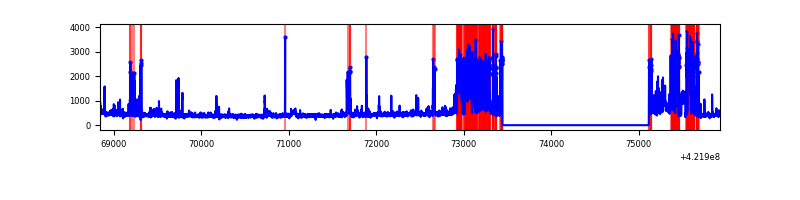 |
Top three noisy pixels from each quadrant. If the there are fewer than three noisy pixels in the level2.evt file, extra rows are filled as -1
| Pixel properties | Quadrant properties | ||||||
|---|---|---|---|---|---|---|---|
| Quadrant | DetID | PixID | Counts | Sigma | Mean | Median | Sigma |
| A | 10 | 83 | 496410 | 4102.29 | 588 | 576 | 120.9 |
| A | 13 | 254 | 7861 | 60.27 | 588 | 576 | 120.9 |
| A | 3 | 137 | 6658 | 50.32 | 588 | 576 | 120.9 |
| B | 0 | 190 | 87653 | 759.41 | 585 | 567 | 114.7 |
| B | 5 | 185 | 58309 | 503.52 | 585 | 567 | 114.7 |
| B | 5 | 255 | 54950 | 474.23 | 585 | 567 | 114.7 |
| C | 0 | 10 | 445769 | 3310.05 | 572 | 575 | 134.5 |
| C | 15 | 214 | 230223 | 1707.45 | 572 | 575 | 134.5 |
| C | 13 | 61 | 3839 | 24.26 | 572 | 575 | 134.5 |
| D | 13 | 249 | 594926 | 4324.72 | 557 | 542 | 137.4 |
| D | 1 | 52 | 521211 | 3788.37 | 557 | 542 | 137.4 |
| D | 2 | 120 | 117610 | 851.78 | 557 | 542 | 137.4 |
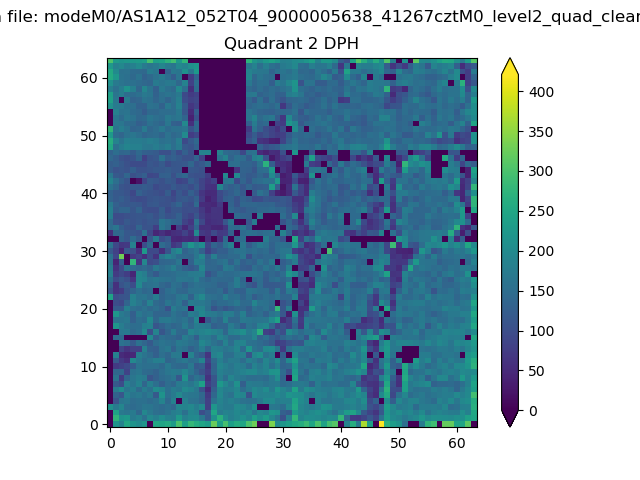
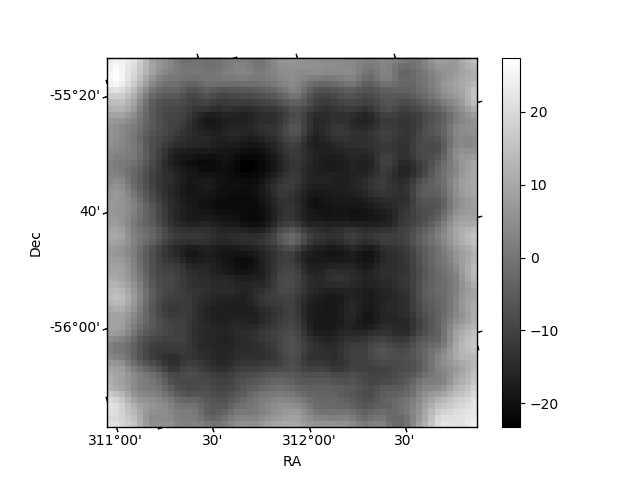
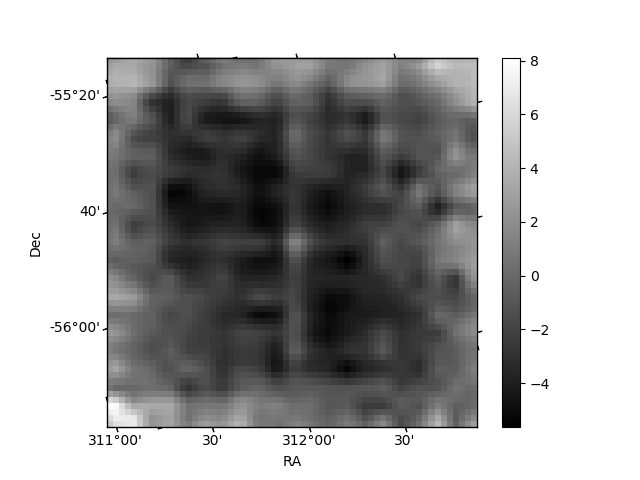
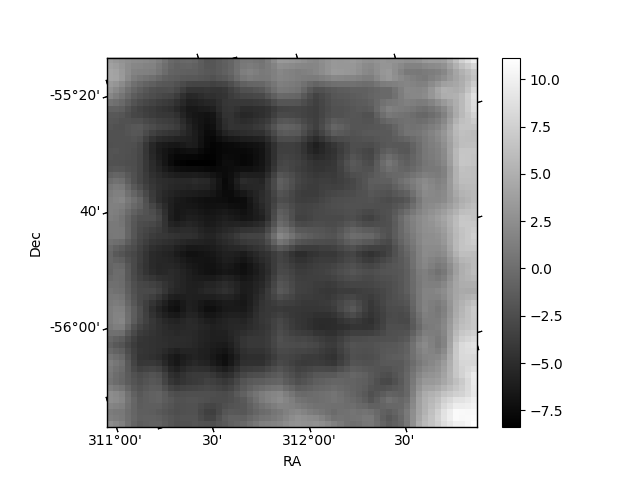
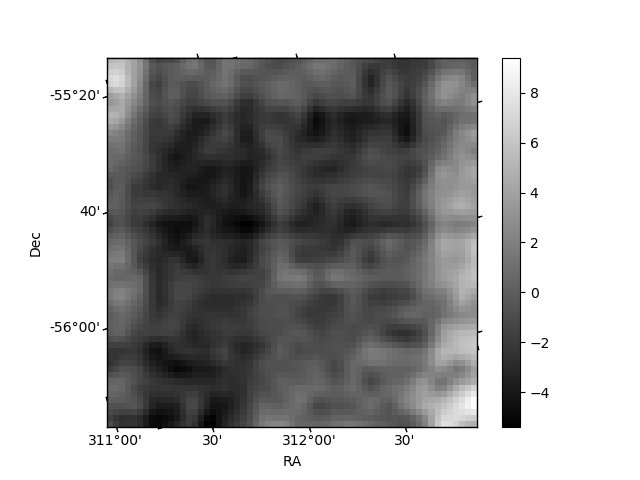
Histogram calculated using DETX and DETY for each event in the final _common_clean file
| Quadrant A | 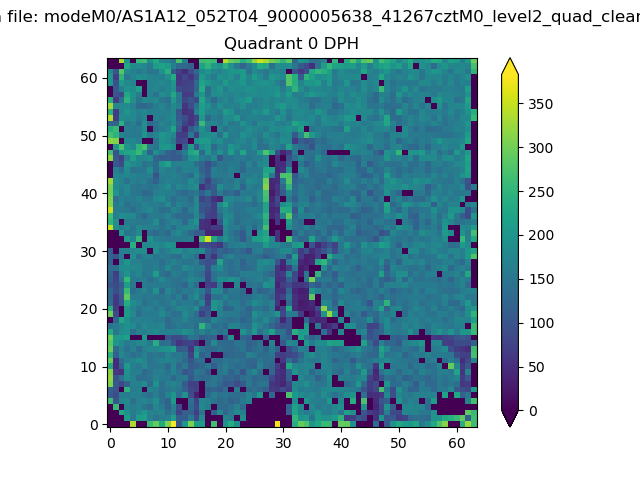 |
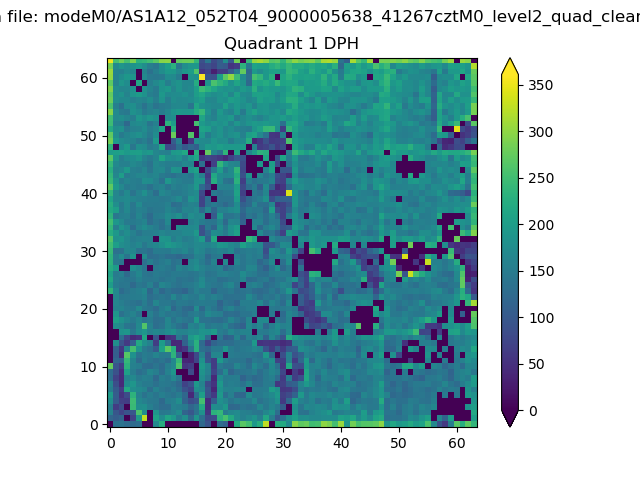 |
Quadrant B |
|---|---|---|---|
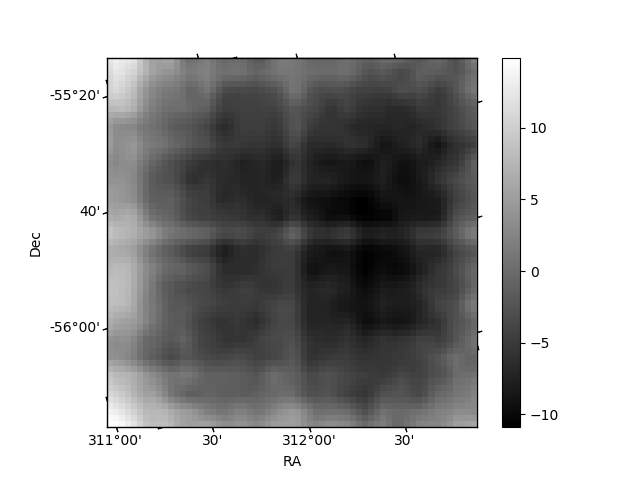
| Quadrant D | 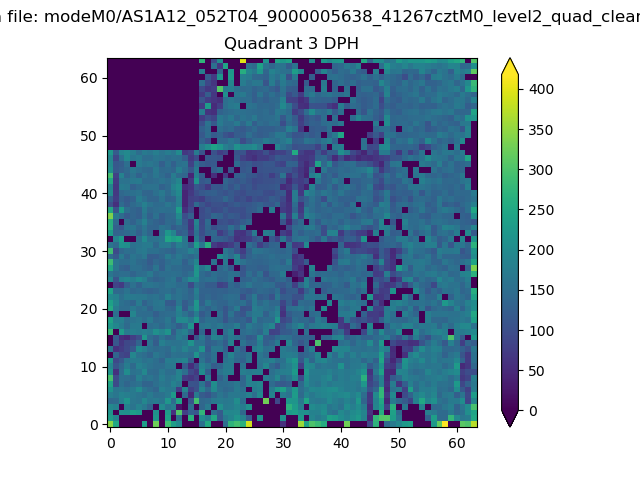 |
 |
Quadrant C |
| Plot type | Count rate plots | Images |
|---|---|---|
| Comparison with Poisson distribution Blue bars denote a histogram of data divided into 1 sec bins. Red curve is a Poisson curve with rate = median count rate of data. |
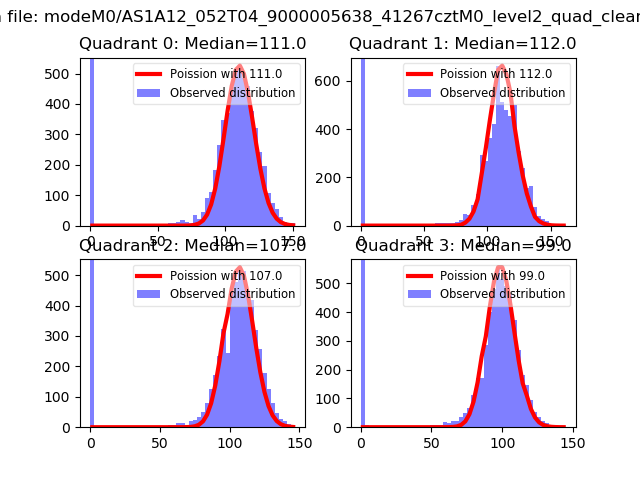 |
 |
| Quadrant-wise count rates Data is divided into 100 sec bins |
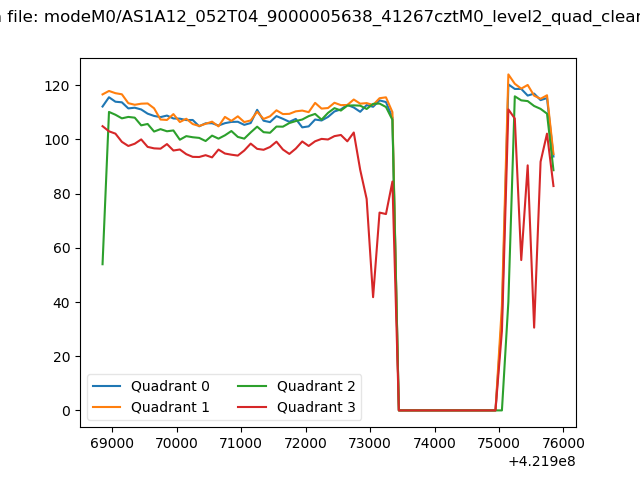 |
|
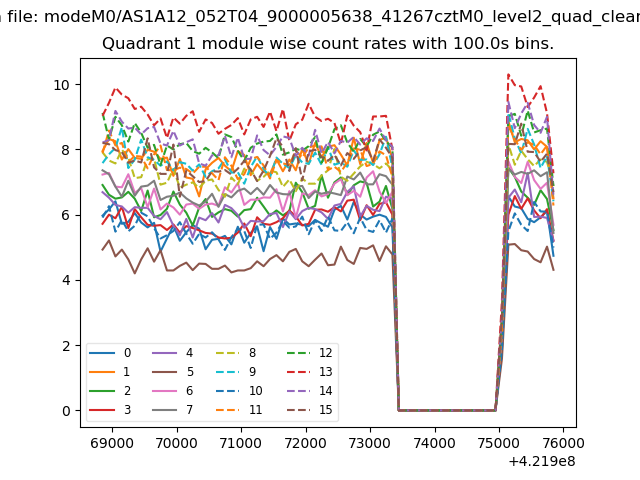
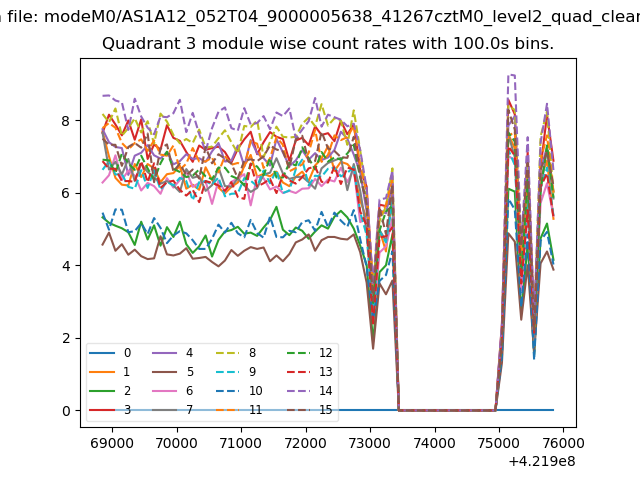
| Module-wise count rates for Quadrant A Data is divided into 100 sec bins |
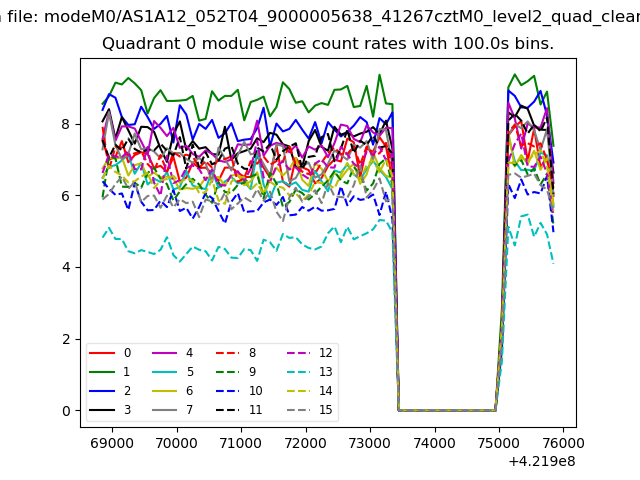 |
 |
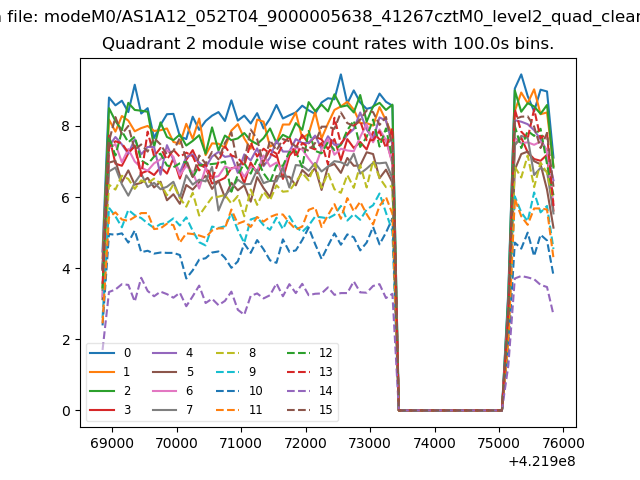
| Module-wise count rates for Quadrant B Data is divided into 100 sec bins |
 |
 |
| Module-wise count rates for Quadrant C Data is divided into 100 sec bins |
 |
 |
| Module-wise count rates for Quadrant D Data is divided into 100 sec bins |
 |
 |
| Parameter | Plot |
|---|---|
| CZT HV Monitor | 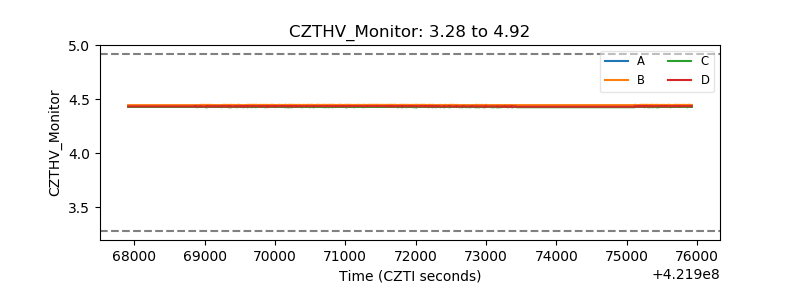 |
| D_VDD | 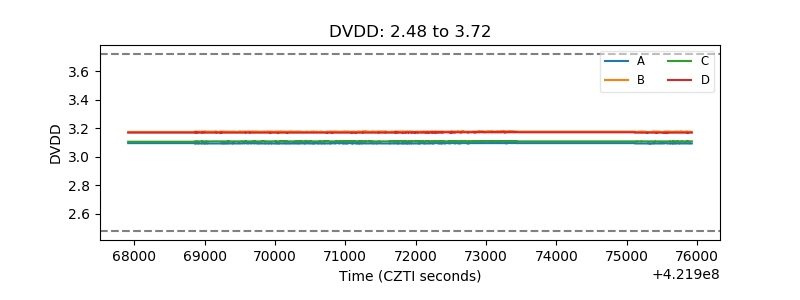 |
| Temperature 1 | 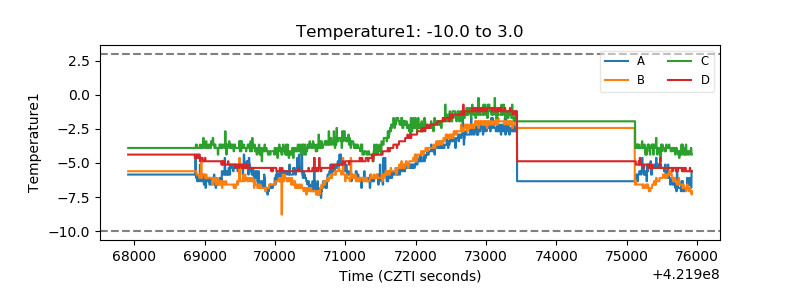 |
| Veto HV Monitor | 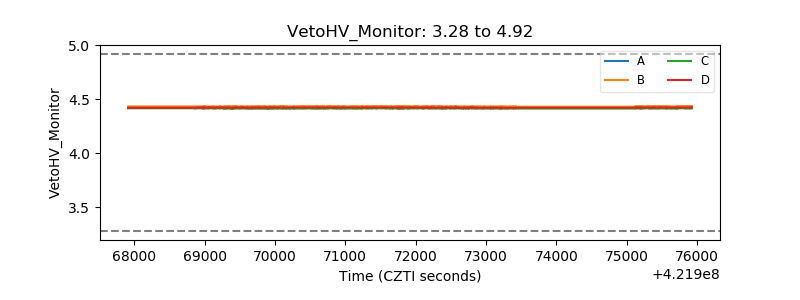 |
| Veto LLD | 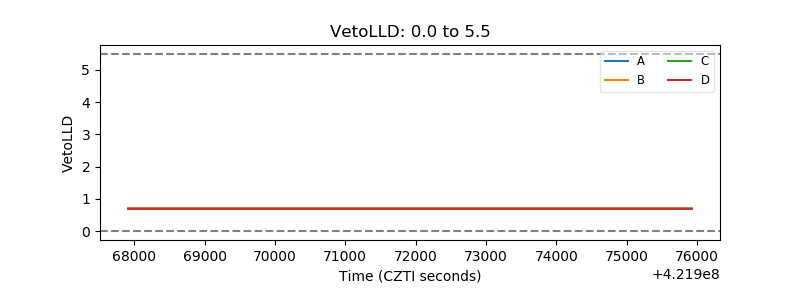 |
| Alpha Counter | 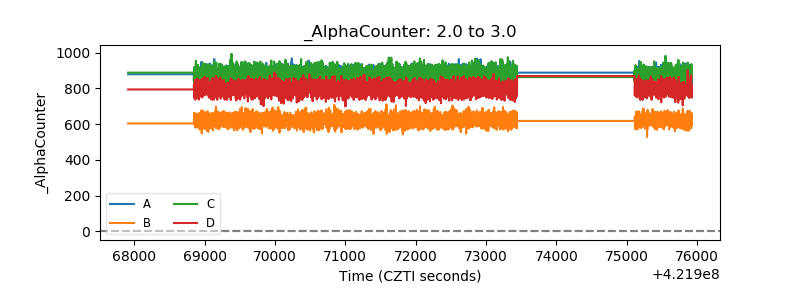 |
| _CPM_Rate | 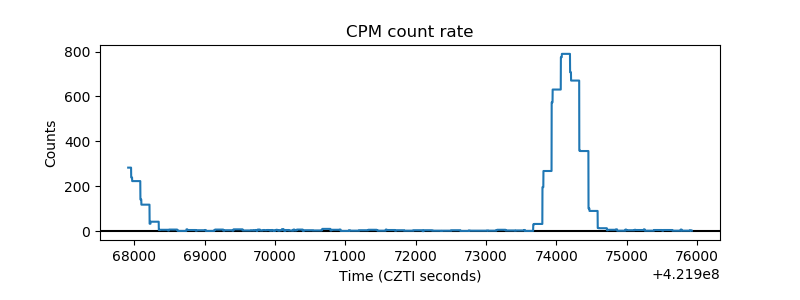 |
| CZT Counter | 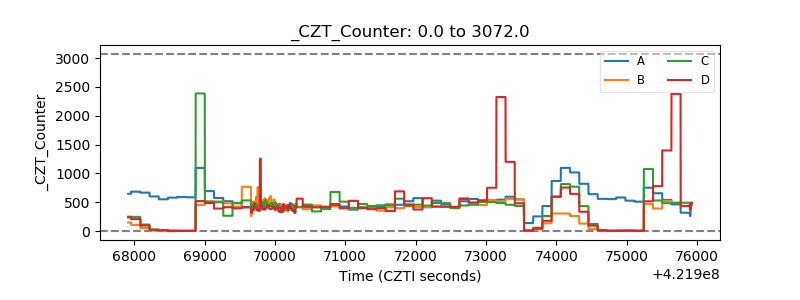 |
| +2.5 Volts monitor | 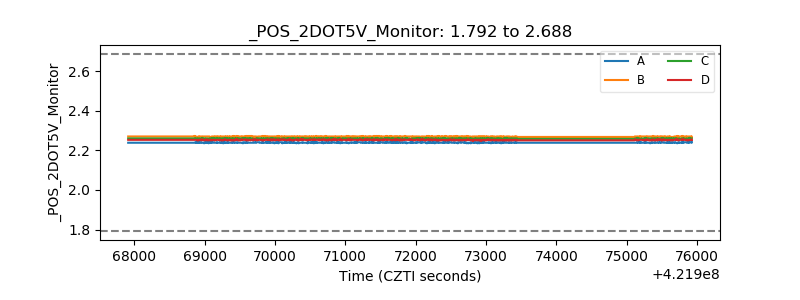 |
| +5 Volts monitor | 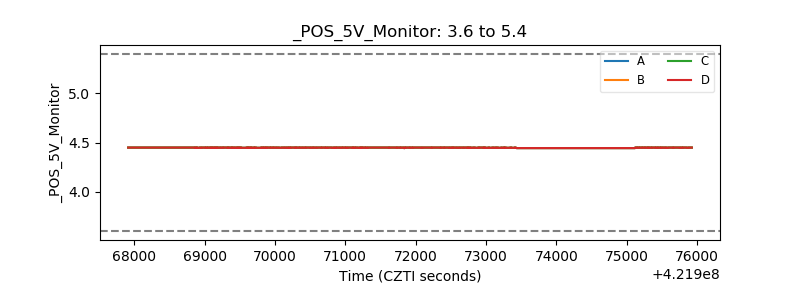 |
| _ROLL_ROT | 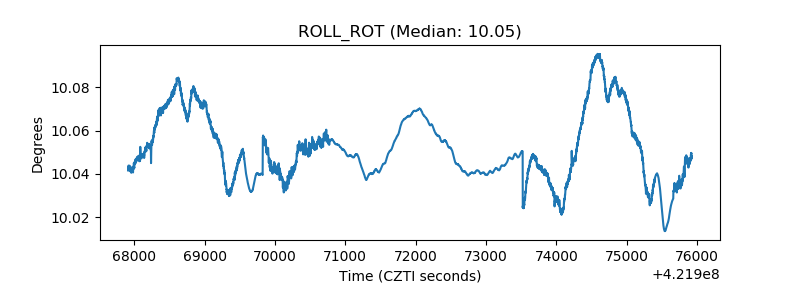 |
| _Roll_DEC | 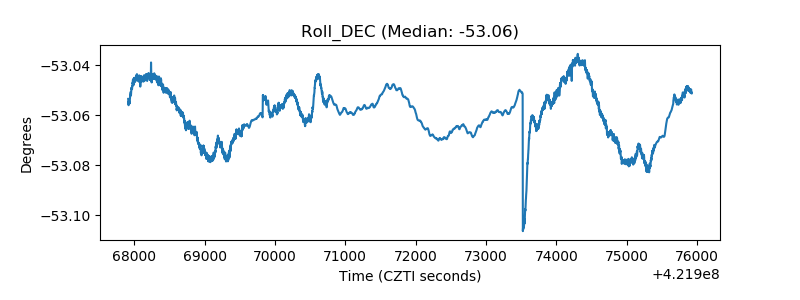 |
| _Roll_RA | 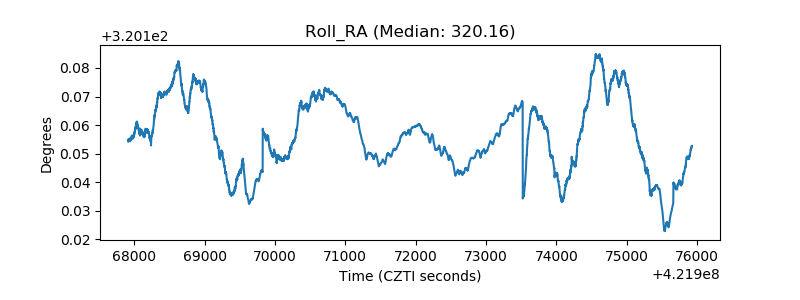 |
| Veto Counter | 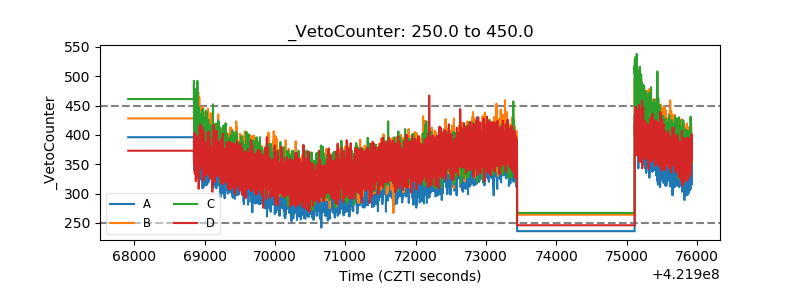 |