| Param | Original file | Final file |
|---|---|---|
| Filename | modeM0/AS1A12_052T04_9000005638_41270cztM0_level2.fits | modeM0/AS1A12_052T04_9000005638_41270cztM0_level2_quad_clean.evt |
| Size (bytes) | 378,630,720 | 96,863,040 |
| Size | 361.1 MB | 92.4 MB |
| Events in quadrant A | 3,128,882 | 652,975 |
| Events in quadrant B | 2,856,322 | 673,849 |
| Events in quadrant C | 3,216,209 | 637,290 |
| Events in quadrant D | 4,376,976 | 575,712 |
| Mode M9 | |||
|---|---|---|---|
| Quadrant | BADHDUFLAG | Total packets | Discarded packets |
| A | 0 | 37 | 0 |
| B | 0 | 37 | 0 |
| C | 0 | 37 | 0 |
| D | 0 | 37 | 0 |
| Mode SS | |||
|---|---|---|---|
| Quadrant | BADHDUFLAG | Total packets | Discarded packets |
| A | 0 | 118 | 0 |
| B | 0 | 118 | 0 |
| C | 0 | 118 | 0 |
| D | 0 | 118 | 0 |
| Mode M0 | |||
|---|---|---|---|
| Quadrant | BADHDUFLAG | Total packets | Discarded packets |
| A | 0 | 12633 | 3 |
| B | 0 | 12374 | 2 |
| C | 0 | 12935 | 2 |
| D | 0 | 16822 | 2 |
| Quadrant | Total seconds | Saturated seconds | Saturation percentage |
|---|---|---|---|
| A | 5618 | 64 | 1.139195% |
| B | 5618 | 49 | 0.872197% |
| C | 5618 | 137 | 2.438590% |
| D | 5618 | 338 | 6.016376% |
Noise dominated data is calculated using 1-second bins in cleaned event files. If a bin has >2000 counts, and if more than 50% of those come from <1% of pixels, then it is considered to be noise-dominated and hence unusable.
| Quadrant | # 1 sec bins | Bins with >0 counts | Bins with >2000 counts | High rate bins dominated by noise | Noise dominated (total time) | Noise dominated (detector-on time) | Marked lightcurve |
|---|---|---|---|---|---|---|---|
| A | 9356 | 5620 | 46 | 46 | 0.49% | 0.82% | 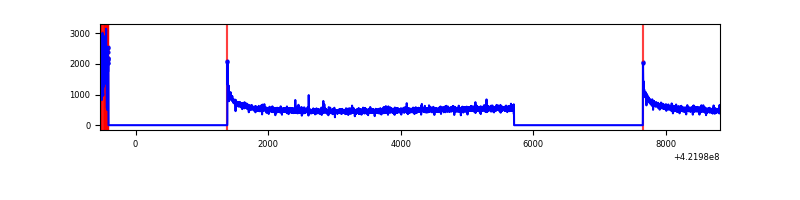 |
| B | 9356 | 5620 | 31 | 31 | 0.33% | 0.55% | 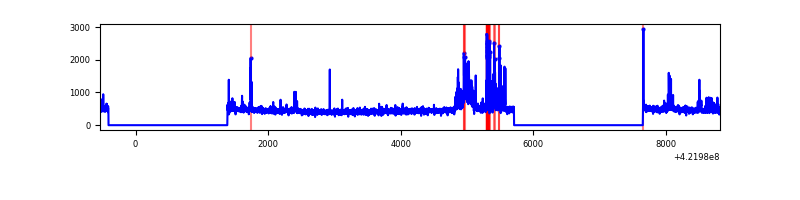 |
| C | 9356 | 5620 | 116 | 116 | 1.24% | 2.06% | 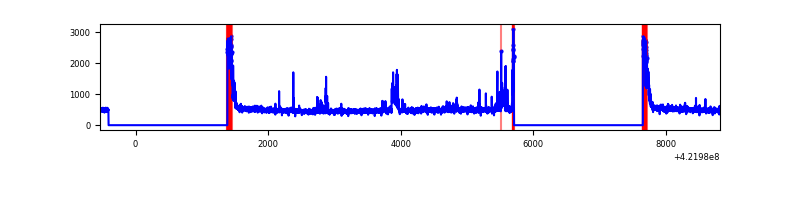 |
| D | 9356 | 5620 | 337 | 337 | 3.60% | 6.00% | 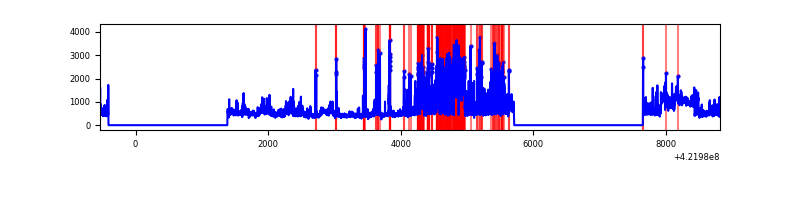 |
Top three noisy pixels from each quadrant. If the there are fewer than three noisy pixels in the level2.evt file, extra rows are filled as -1
| Pixel properties | Quadrant properties | ||||||
|---|---|---|---|---|---|---|---|
| Quadrant | DetID | PixID | Counts | Sigma | Mean | Median | Sigma |
| A | 10 | 83 | 531184 | 4158.74 | 627 | 614 | 127.6 |
| A | 13 | 248 | 153042 | 1194.77 | 627 | 614 | 127.6 |
| A | 13 | 6 | 12823 | 95.69 | 627 | 614 | 127.6 |
| B | 0 | 186 | 265306 | 2194.8 | 626 | 607 | 120.6 |
| B | 0 | 190 | 48718 | 398.92 | 626 | 607 | 120.6 |
| B | 5 | 255 | 44160 | 361.12 | 626 | 607 | 120.6 |
| C | 0 | 10 | 354058 | 2441.86 | 623 | 627 | 144.7 |
| C | 15 | 214 | 237218 | 1634.61 | 623 | 627 | 144.7 |
| C | 9 | 54 | 183089 | 1260.63 | 623 | 627 | 144.7 |
| D | 2 | 120 | 961411 | 6460.69 | 611 | 598 | 148.7 |
| D | 1 | 52 | 667360 | 4483.43 | 611 | 598 | 148.7 |
| D | 5 | 222 | 149020 | 998.02 | 611 | 598 | 148.7 |
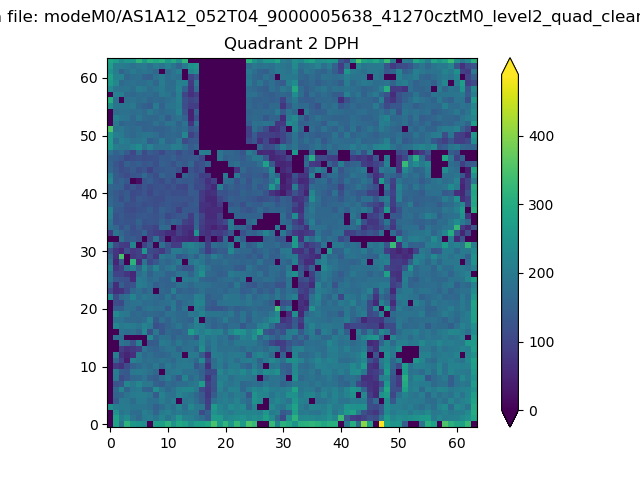
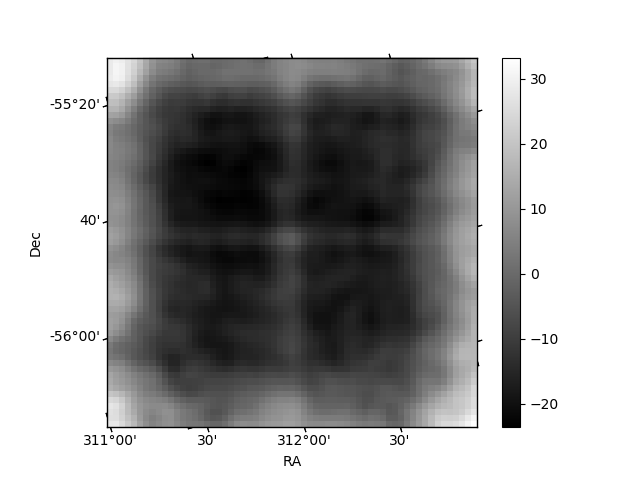
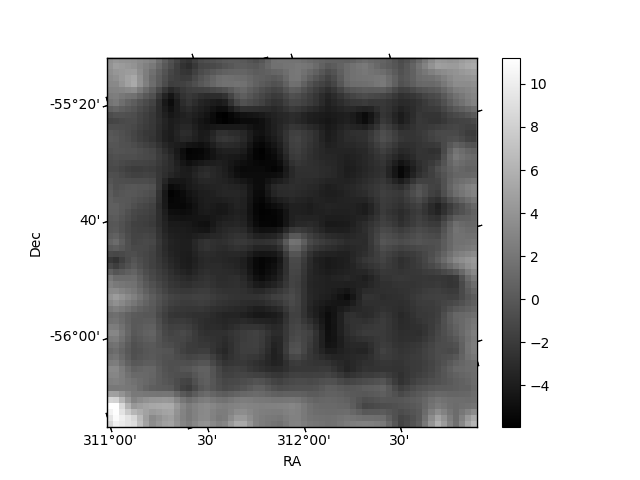
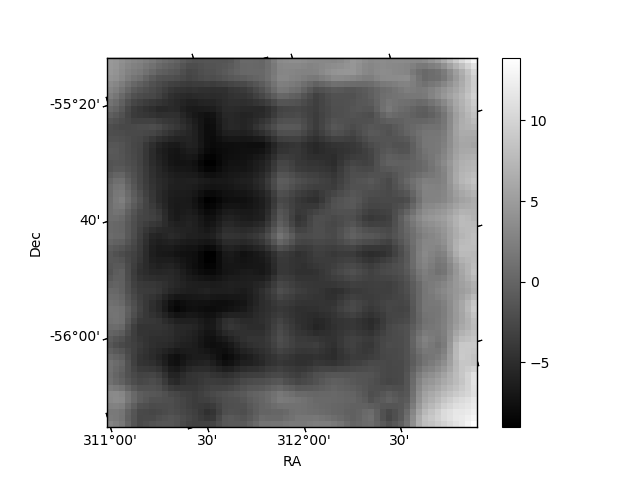
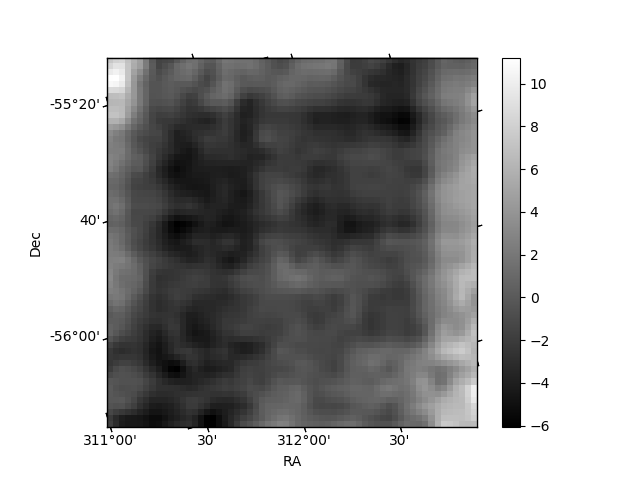
Histogram calculated using DETX and DETY for each event in the final _common_clean file
| Quadrant A | 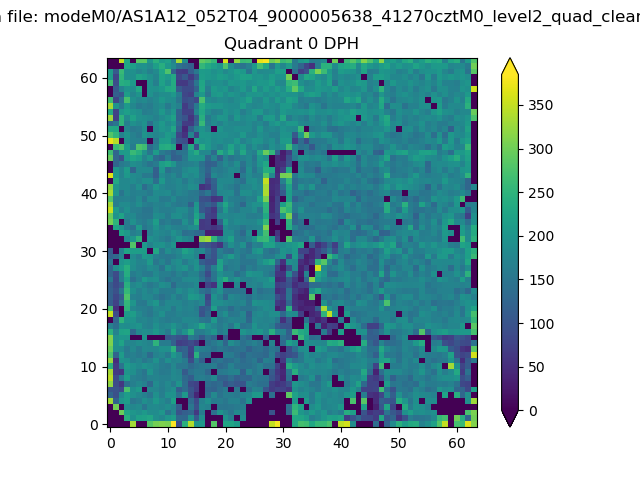 |
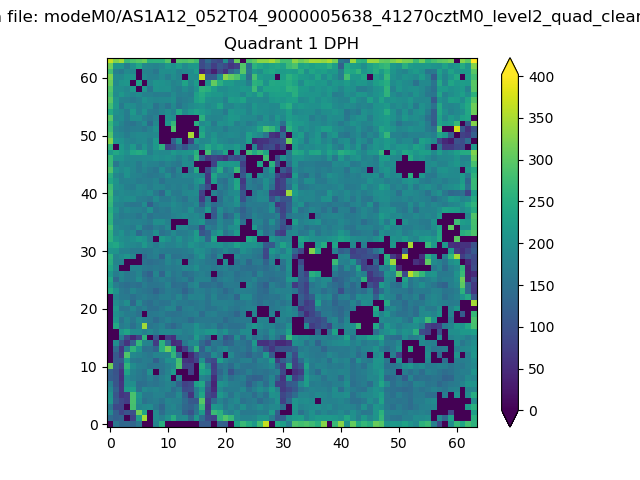 |
Quadrant B |
|---|---|---|---|
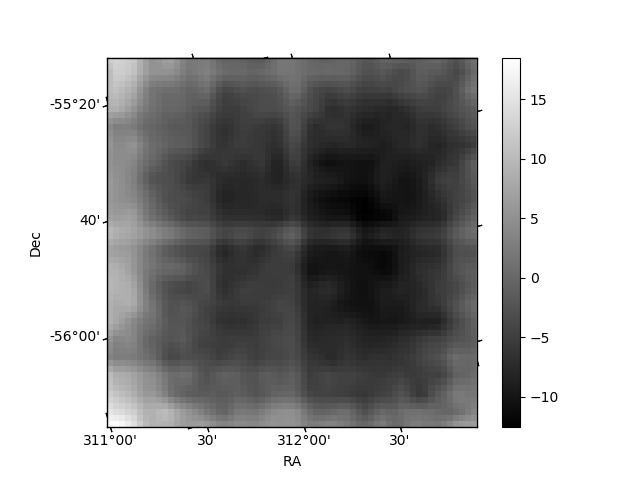
| Quadrant D | 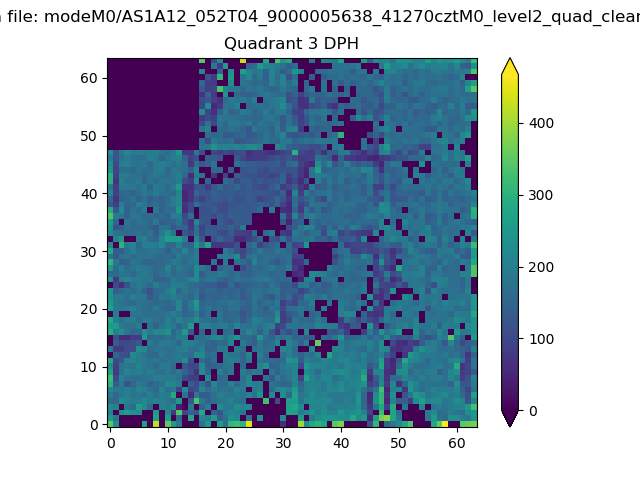 |
 |
Quadrant C |
| Plot type | Count rate plots | Images |
|---|---|---|
| Comparison with Poisson distribution Blue bars denote a histogram of data divided into 1 sec bins. Red curve is a Poisson curve with rate = median count rate of data. |
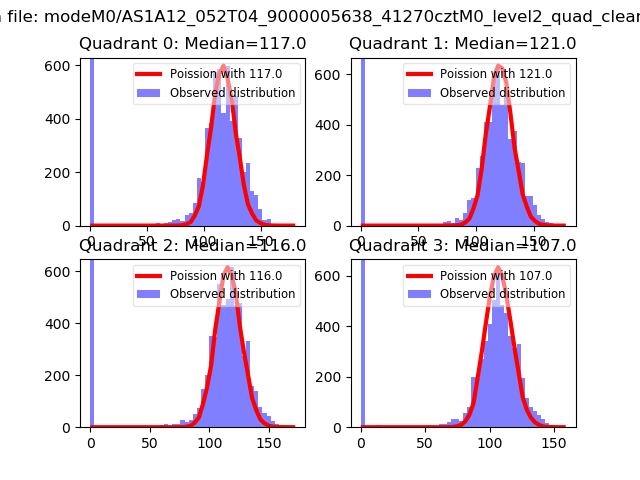 |
 |
| Quadrant-wise count rates Data is divided into 100 sec bins |
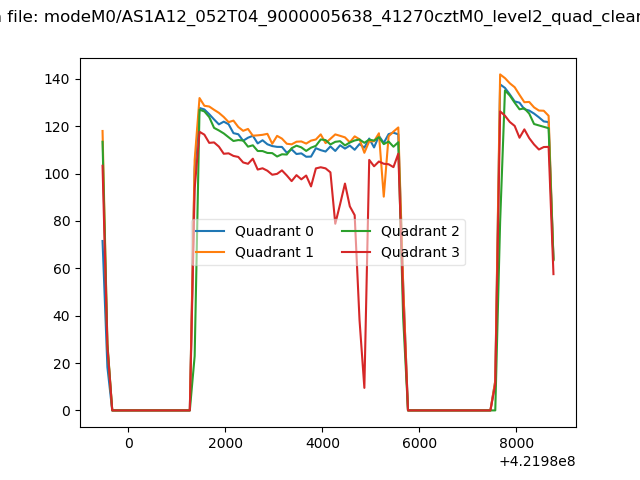 |
|
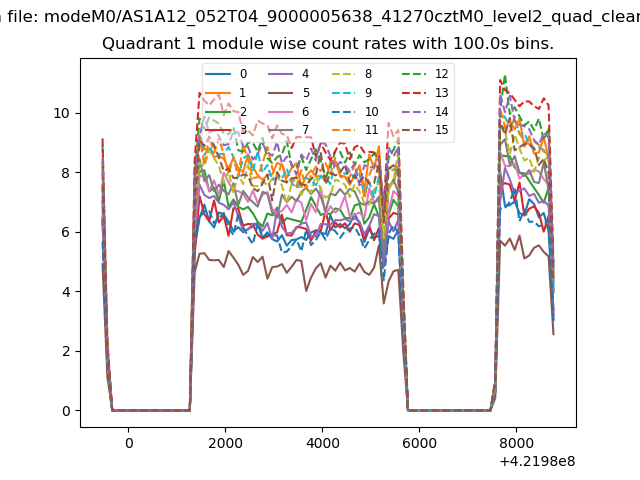
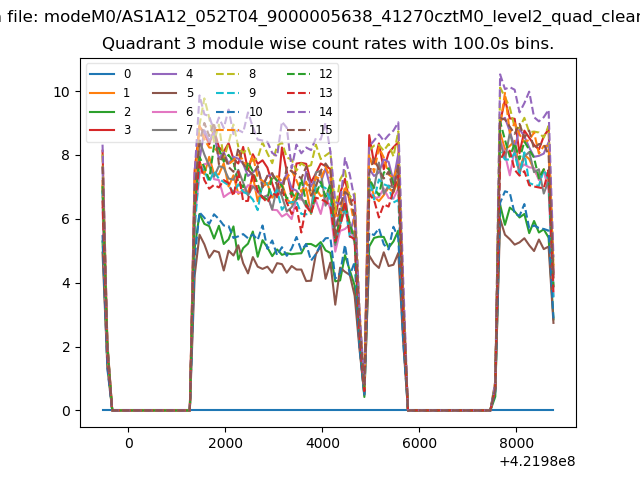
| Module-wise count rates for Quadrant A Data is divided into 100 sec bins |
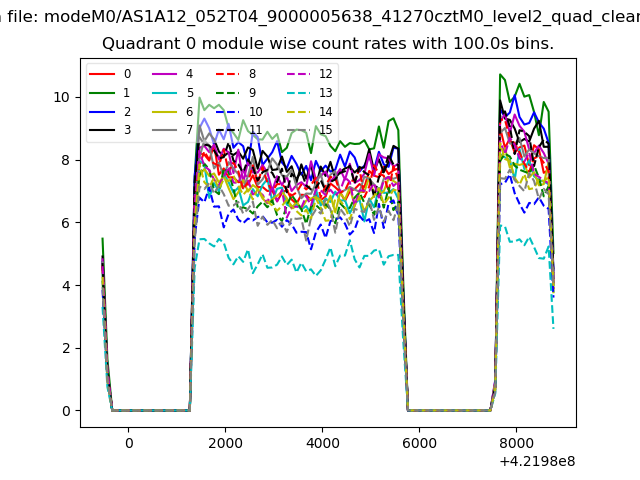 |
 |
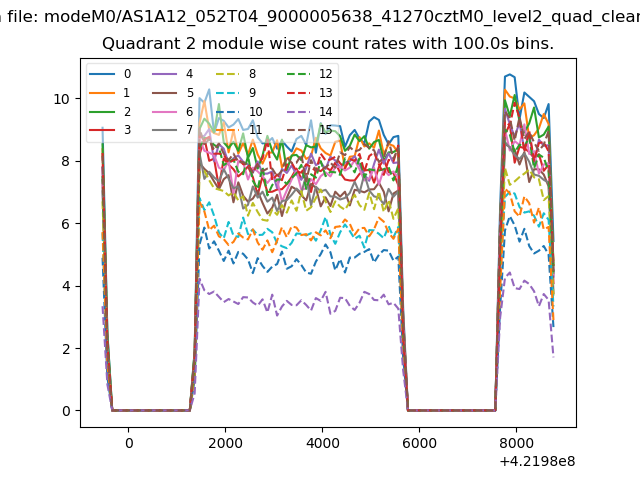
| Module-wise count rates for Quadrant B Data is divided into 100 sec bins |
 |
 |
| Module-wise count rates for Quadrant C Data is divided into 100 sec bins |
 |
 |
| Module-wise count rates for Quadrant D Data is divided into 100 sec bins |
 |
 |
| Parameter | Plot |
|---|---|
| CZT HV Monitor | 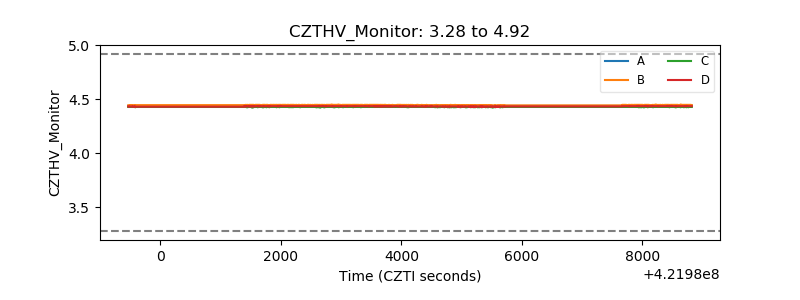 |
| D_VDD | 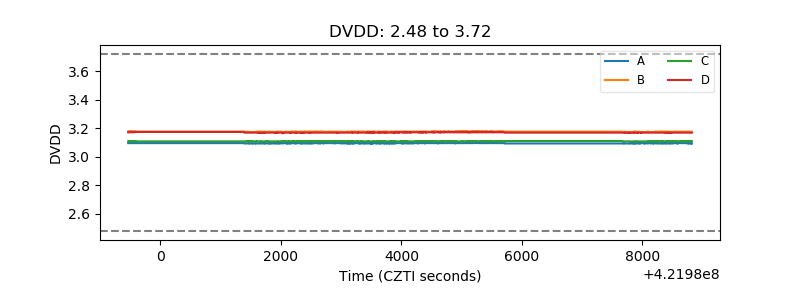 |
| Temperature 1 | 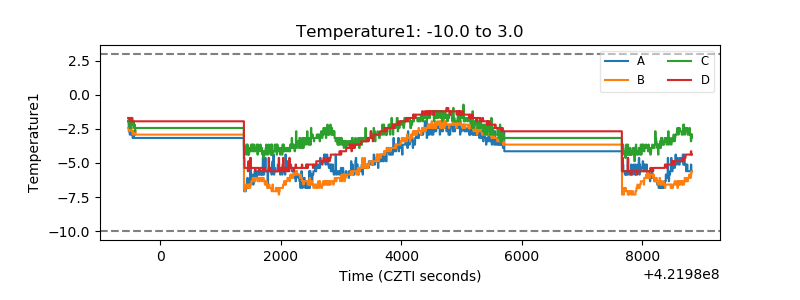 |
| Veto HV Monitor | 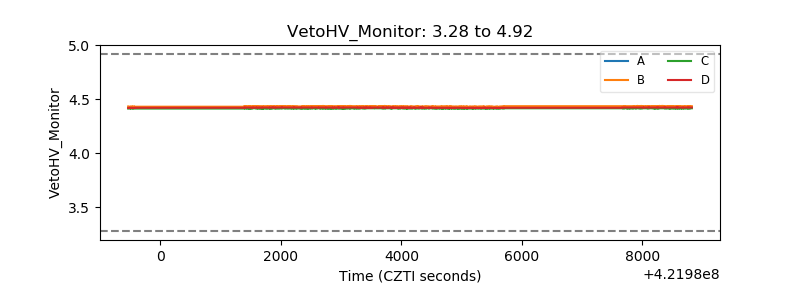 |
| Veto LLD | 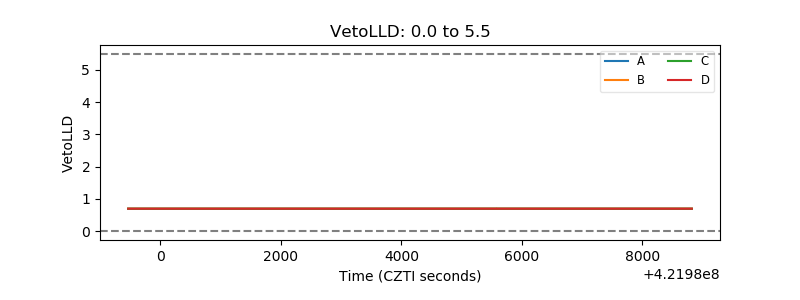 |
| Alpha Counter | 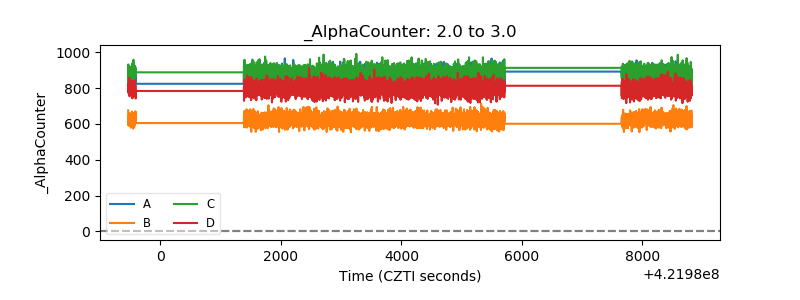 |
| _CPM_Rate | 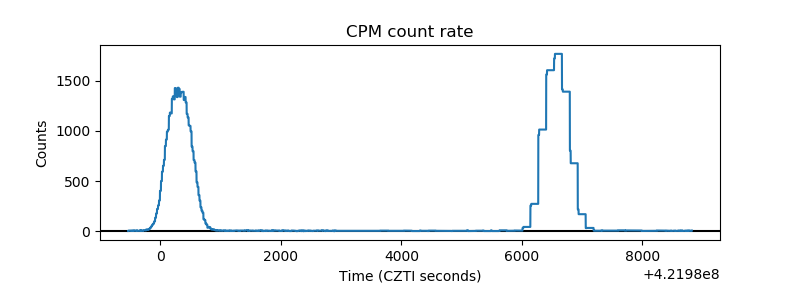 |
| CZT Counter |  |
| +2.5 Volts monitor |  |
| +5 Volts monitor |  |
| _ROLL_ROT | 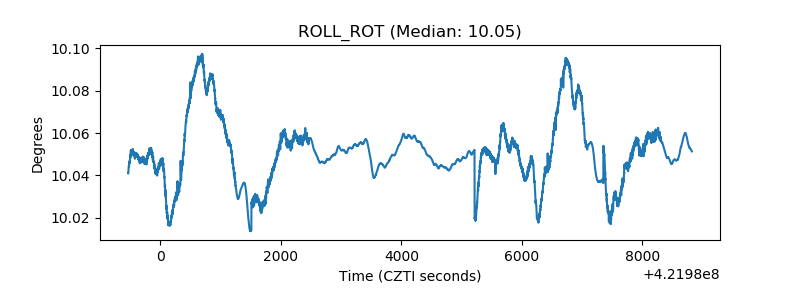 |
| _Roll_DEC |  |
| _Roll_RA | 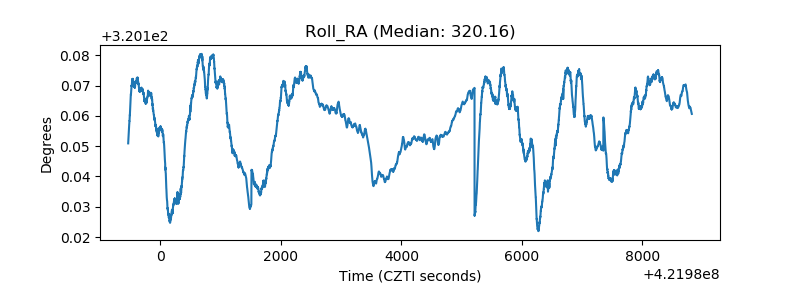 |
| Veto Counter | 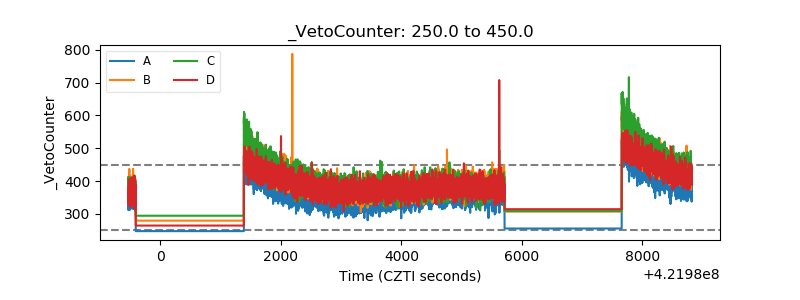 |