| Param | Original file | Final file |
|---|---|---|
| Filename | modeM0/AS1A12_052T04_9000005638_41271cztM0_level2.fits | modeM0/AS1A12_052T04_9000005638_41271cztM0_level2_quad_clean.evt |
| Size (bytes) | 300,962,880 | 86,535,360 |
| Size | 287.0 MB | 82.5 MB |
| Events in quadrant A | 2,574,947 | 580,339 |
| Events in quadrant B | 2,402,348 | 597,588 |
| Events in quadrant C | 2,624,664 | 570,606 |
| Events in quadrant D | 3,161,739 | 532,916 |
| Mode M9 | |||
|---|---|---|---|
| Quadrant | BADHDUFLAG | Total packets | Discarded packets |
| A | 0 | 21 | 0 |
| B | 0 | 21 | 0 |
| C | 0 | 21 | 0 |
| D | 0 | 21 | 0 |
| Mode SS | |||
|---|---|---|---|
| Quadrant | BADHDUFLAG | Total packets | Discarded packets |
| A | 0 | 98 | 0 |
| B | 0 | 98 | 0 |
| C | 0 | 98 | 0 |
| D | 0 | 98 | 0 |
| Mode M0 | |||
|---|---|---|---|
| Quadrant | BADHDUFLAG | Total packets | Discarded packets |
| A | 0 | 10452 | 2 |
| B | 0 | 10339 | 1 |
| C | 0 | 10586 | 1 |
| D | 0 | 12533 | 1 |
| Quadrant | Total seconds | Saturated seconds | Saturation percentage |
|---|---|---|---|
| A | 4834 | 11 | 0.227555% |
| B | 4834 | 18 | 0.372362% |
| C | 4834 | 91 | 1.882499% |
| D | 4834 | 73 | 1.510137% |
Noise dominated data is calculated using 1-second bins in cleaned event files. If a bin has >2000 counts, and if more than 50% of those come from <1% of pixels, then it is considered to be noise-dominated and hence unusable.
| Quadrant | # 1 sec bins | Bins with >0 counts | Bins with >2000 counts | High rate bins dominated by noise | Noise dominated (total time) | Noise dominated (detector-on time) | Marked lightcurve |
|---|---|---|---|---|---|---|---|
| A | 6898 | 4835 | 2 | 2 | 0.03% | 0.04% | 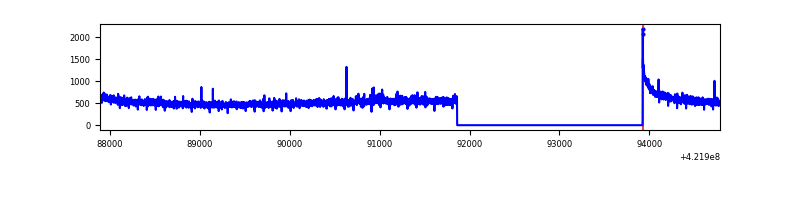 |
| B | 6898 | 4835 | 7 | 7 | 0.10% | 0.14% | 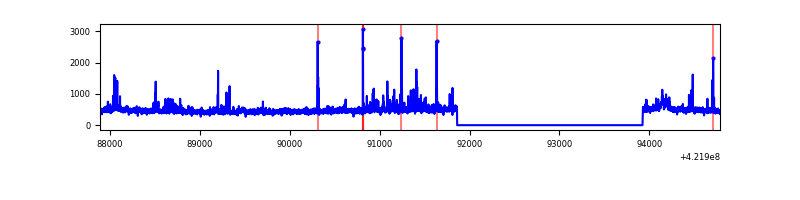 |
| C | 6898 | 4835 | 97 | 97 | 1.41% | 2.01% | 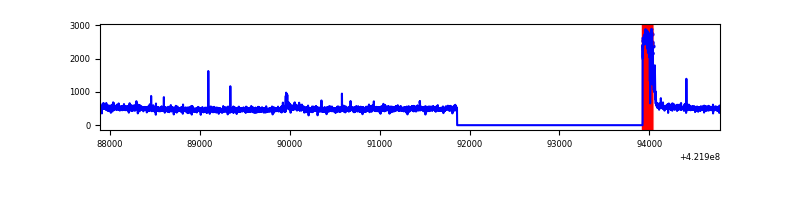 |
| D | 6898 | 4835 | 47 | 47 | 0.68% | 0.97% | 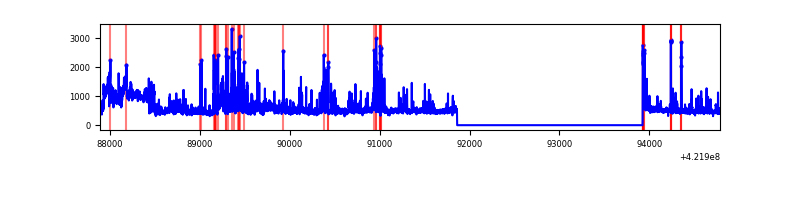 |
Top three noisy pixels from each quadrant. If the there are fewer than three noisy pixels in the level2.evt file, extra rows are filled as -1
| Pixel properties | Quadrant properties | ||||||
|---|---|---|---|---|---|---|---|
| Quadrant | DetID | PixID | Counts | Sigma | Mean | Median | Sigma |
| A | 10 | 83 | 421434 | 3729.01 | 551 | 540 | 112.9 |
| A | 13 | 248 | 11323 | 95.53 | 551 | 540 | 112.9 |
| A | 2 | 79 | 6637 | 54.02 | 551 | 540 | 112.9 |
| B | 0 | 190 | 68056 | 647.79 | 547 | 532 | 104.2 |
| B | 5 | 255 | 55815 | 530.36 | 547 | 532 | 104.2 |
| B | 0 | 229 | 49249 | 467.37 | 547 | 532 | 104.2 |
| C | 0 | 10 | 269567 | 2125.29 | 544 | 548 | 126.6 |
| C | 15 | 214 | 204385 | 1610.34 | 544 | 548 | 126.6 |
| C | 9 | 54 | 27631 | 213.96 | 544 | 548 | 126.6 |
| D | 2 | 120 | 329129 | 2481.76 | 548 | 536 | 132.4 |
| D | 1 | 52 | 242793 | 1829.69 | 548 | 536 | 132.4 |
| D | 2 | 249 | 216746 | 1632.97 | 548 | 536 | 132.4 |
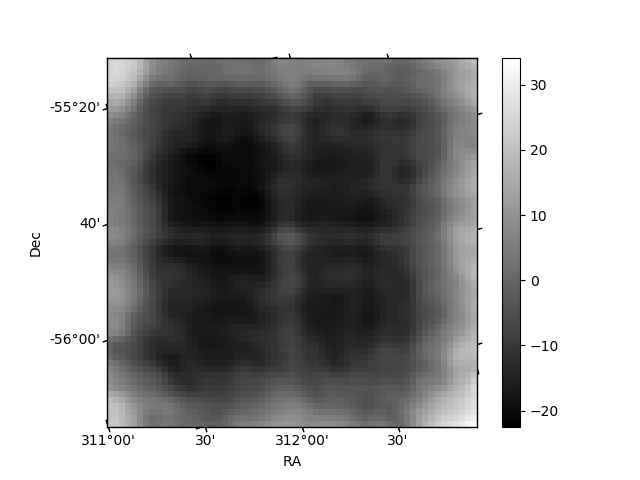
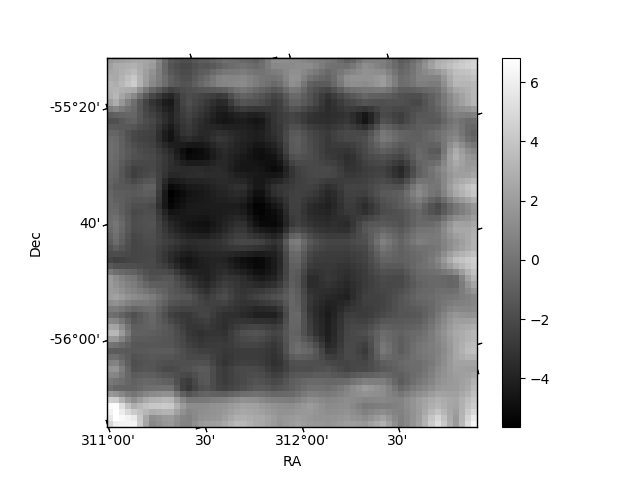
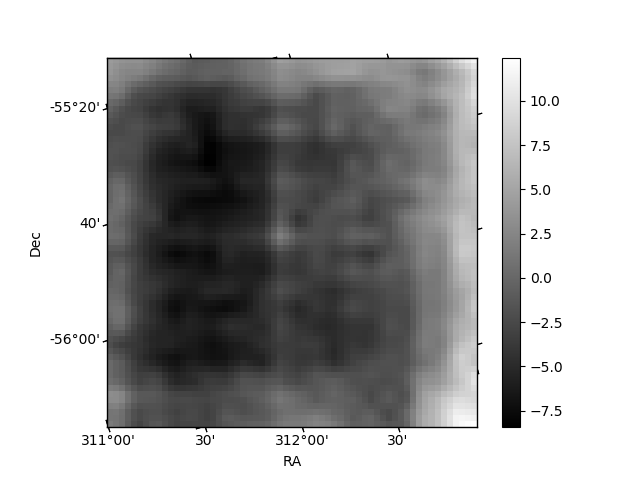
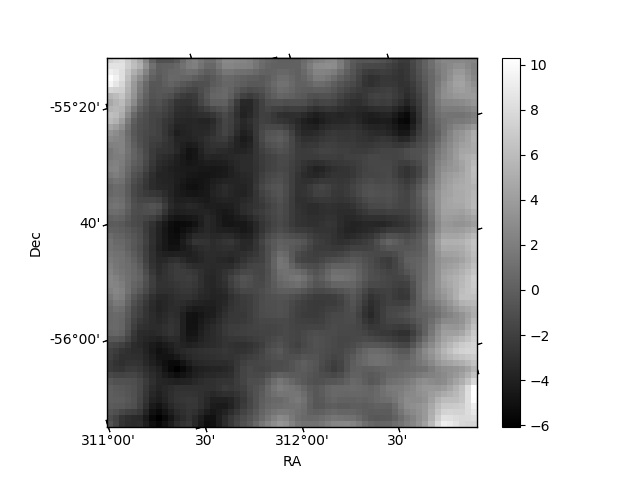
Histogram calculated using DETX and DETY for each event in the final _common_clean file
| Quadrant A | 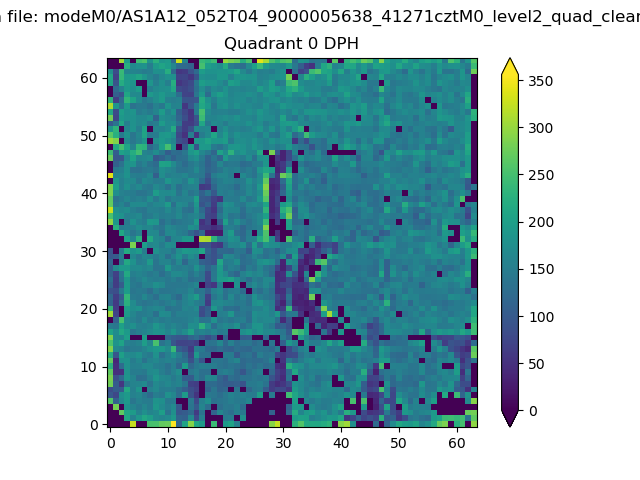 |
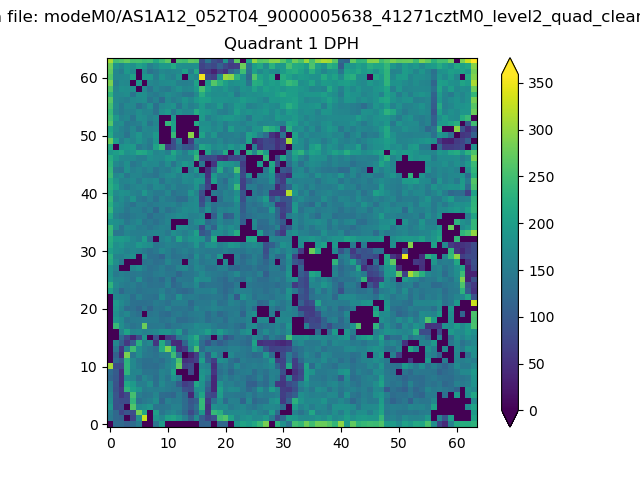 |
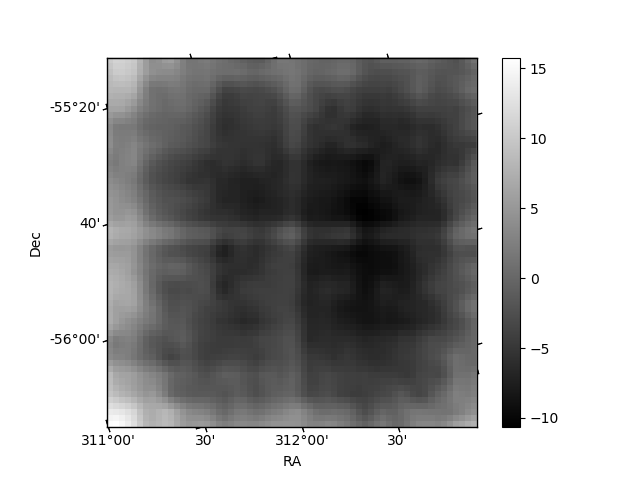
Quadrant B |
|---|---|---|---|
| Quadrant D | 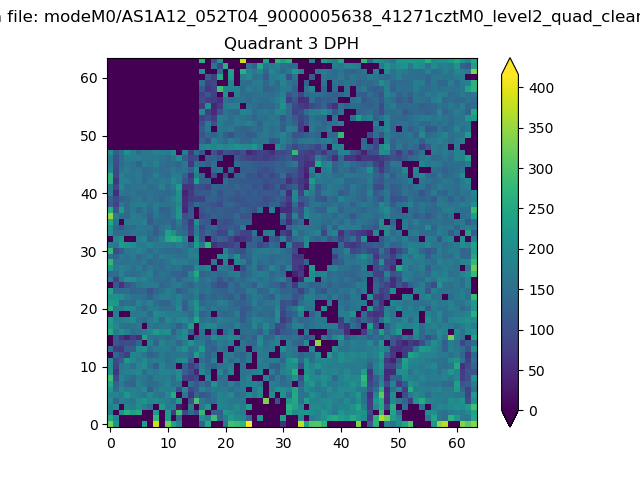 |
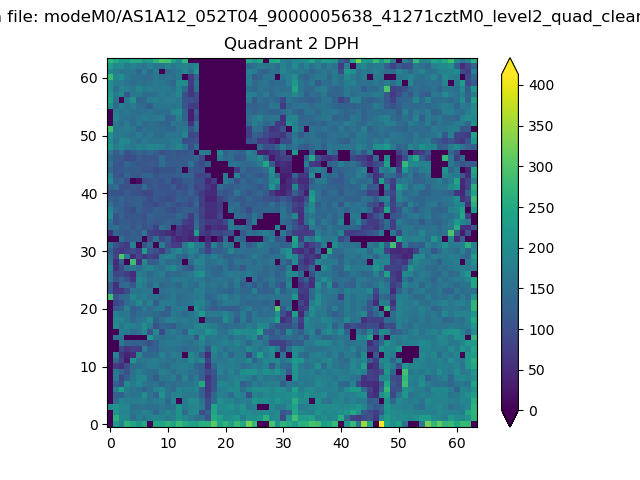 |
Quadrant C |
| Plot type | Count rate plots | Images |
|---|---|---|
| Comparison with Poisson distribution Blue bars denote a histogram of data divided into 1 sec bins. Red curve is a Poisson curve with rate = median count rate of data. |
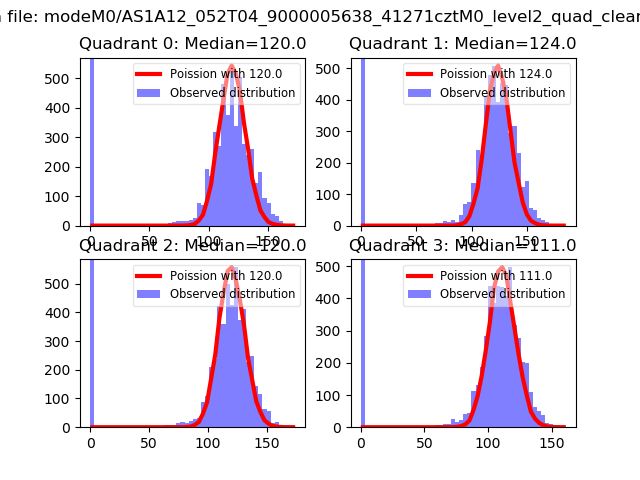 |
 |
| Quadrant-wise count rates Data is divided into 100 sec bins |
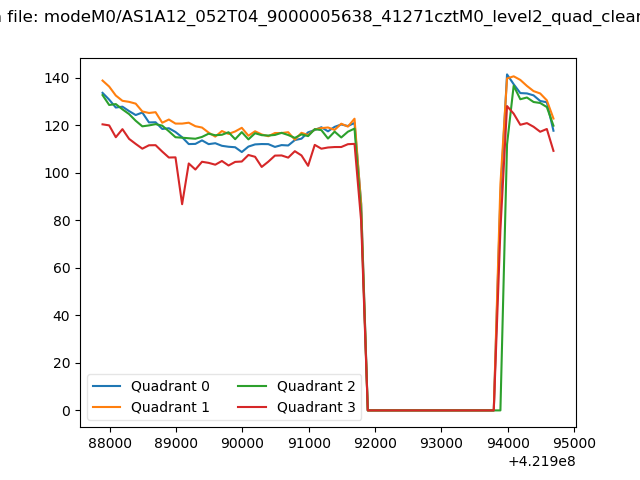 |
|
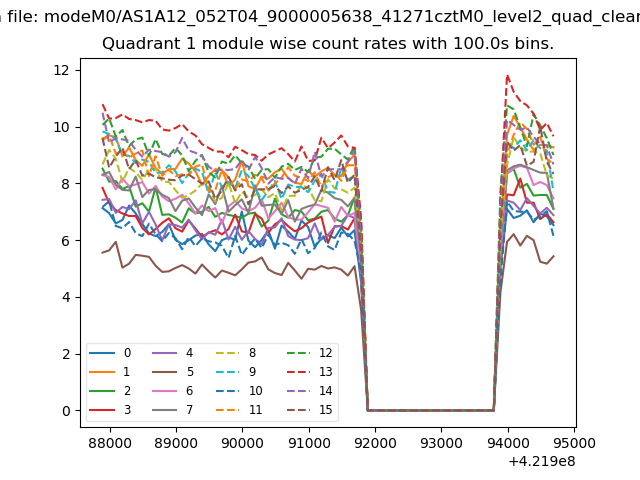
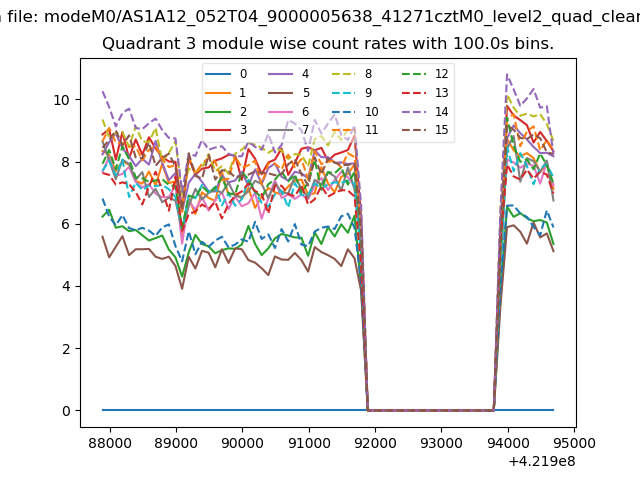
| Module-wise count rates for Quadrant A Data is divided into 100 sec bins |
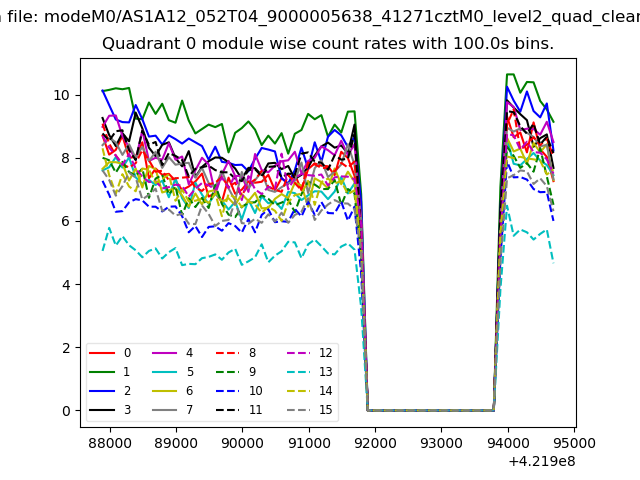 |
 |
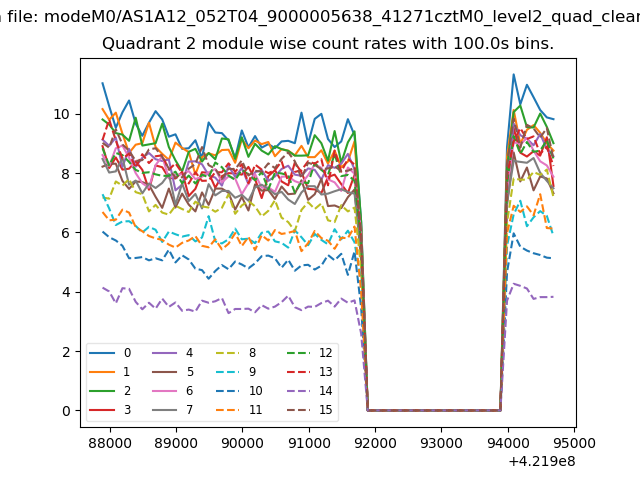
| Module-wise count rates for Quadrant B Data is divided into 100 sec bins |
 |
 |
| Module-wise count rates for Quadrant C Data is divided into 100 sec bins |
 |
 |
| Module-wise count rates for Quadrant D Data is divided into 100 sec bins |
 |
 |
| Parameter | Plot |
|---|---|
| CZT HV Monitor | 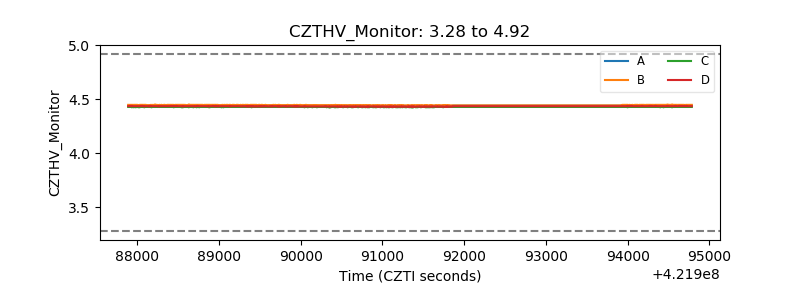 |
| D_VDD | 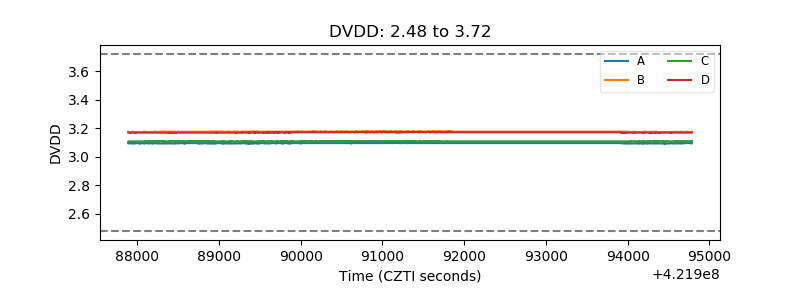 |
| Temperature 1 | 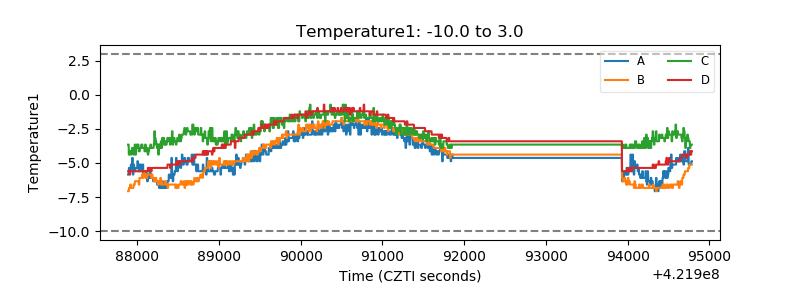 |
| Veto HV Monitor | 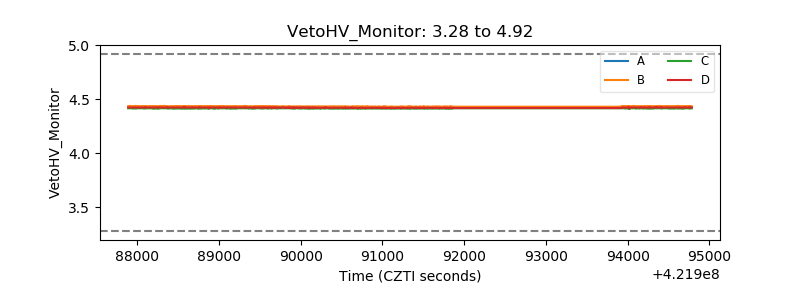 |
| Veto LLD | 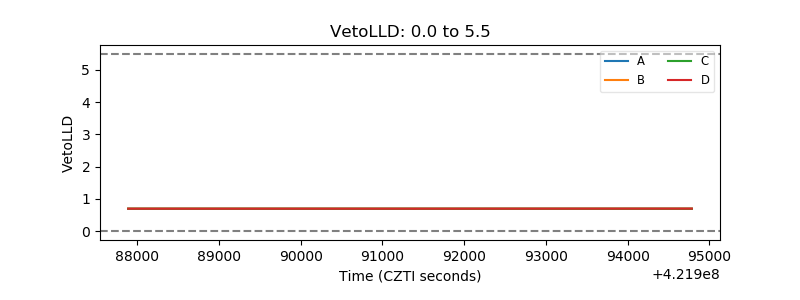 |
| Alpha Counter | 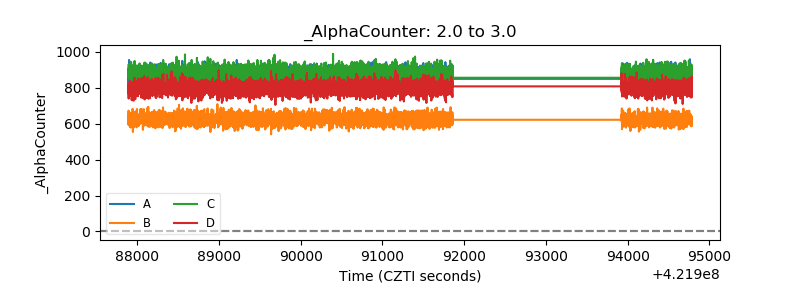 |
| _CPM_Rate | 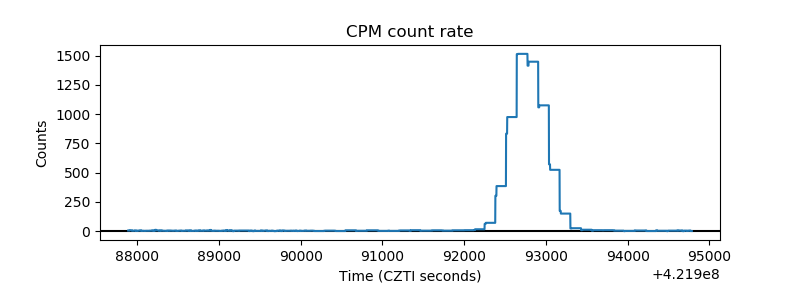 |
| CZT Counter | 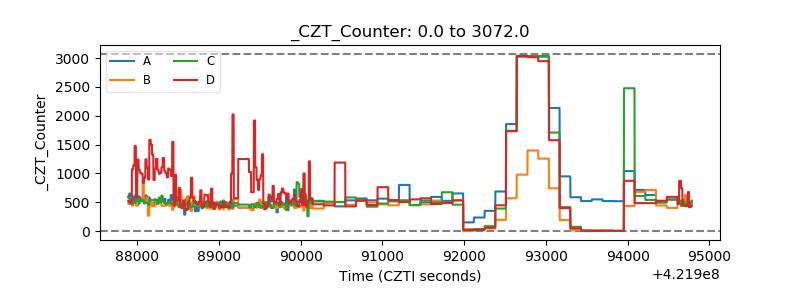 |
| +2.5 Volts monitor | 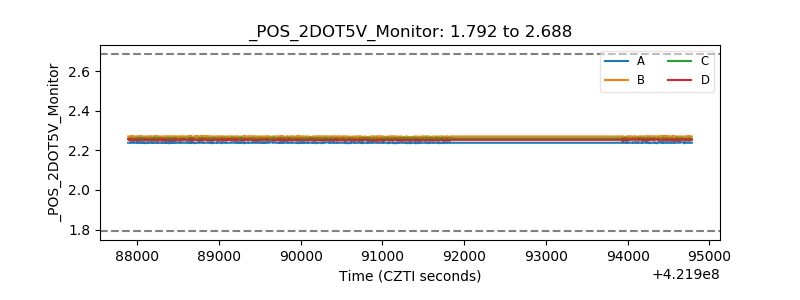 |
| +5 Volts monitor | 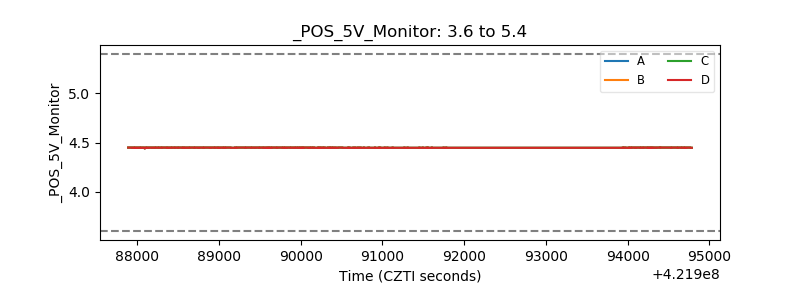 |
| _ROLL_ROT | 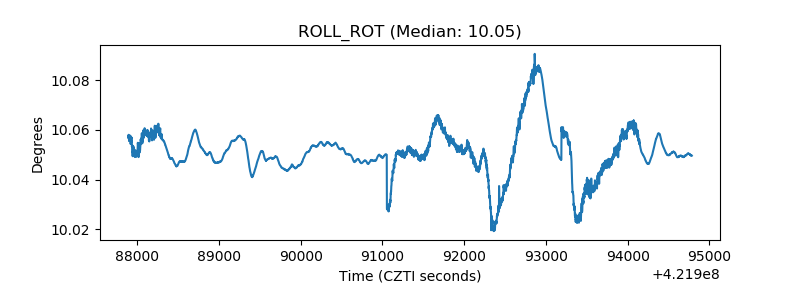 |
| _Roll_DEC | 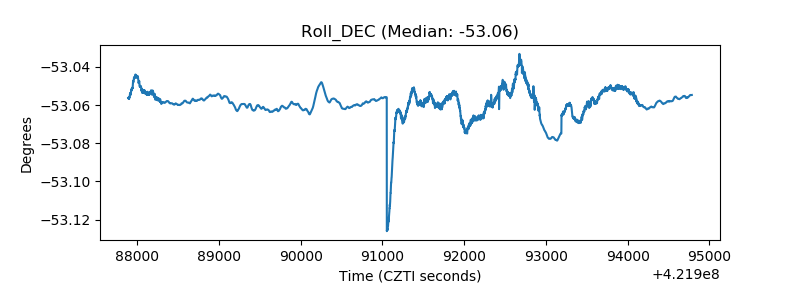 |
| _Roll_RA | 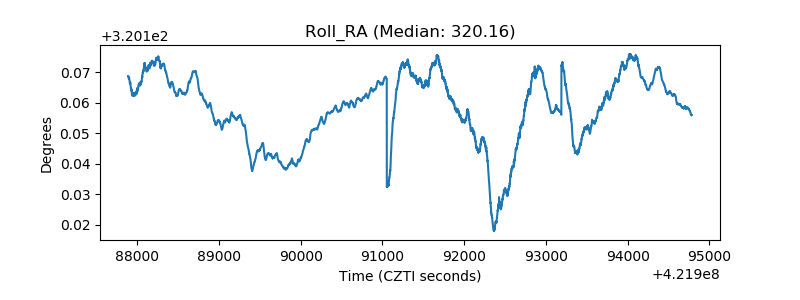 |
| Veto Counter | 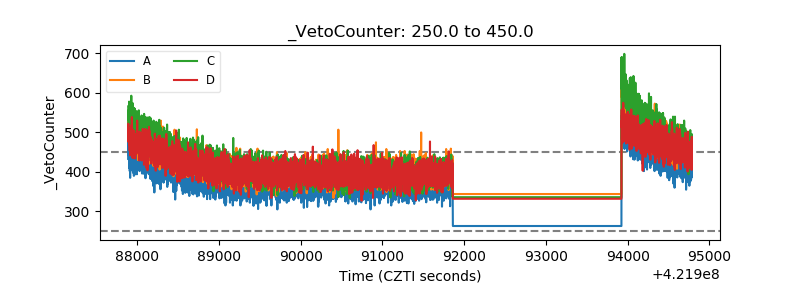 |