| Param | Original file | Final file |
|---|---|---|
| Filename | modeM0/AS1A12_052T04_9000005638_41272cztM0_level2.fits | modeM0/AS1A12_052T04_9000005638_41272cztM0_level2_quad_clean.evt |
| Size (bytes) | 313,928,640 | 88,588,800 |
| Size | 299.4 MB | 84.5 MB |
| Events in quadrant A | 2,738,509 | 599,381 |
| Events in quadrant B | 2,581,813 | 613,642 |
| Events in quadrant C | 2,963,185 | 574,593 |
| Events in quadrant D | 2,952,612 | 549,165 |
| Mode M9 | |||
|---|---|---|---|
| Quadrant | BADHDUFLAG | Total packets | Discarded packets |
| A | 0 | 29 | 0 |
| B | 0 | 29 | 0 |
| C | 0 | 29 | 0 |
| D | 0 | 30 | 0 |
| Mode SS | |||
|---|---|---|---|
| Quadrant | BADHDUFLAG | Total packets | Discarded packets |
| A | 0 | 100 | 0 |
| B | 0 | 100 | 0 |
| C | 0 | 100 | 0 |
| D | 0 | 100 | 0 |
| Mode M0 | |||
|---|---|---|---|
| Quadrant | BADHDUFLAG | Total packets | Discarded packets |
| A | 0 | 10949 | 3 |
| B | 0 | 10756 | 2 |
| C | 0 | 11675 | 2 |
| D | 0 | 11933 | 2 |
| Quadrant | Total seconds | Saturated seconds | Saturation percentage |
|---|---|---|---|
| A | 4935 | 13 | 0.263425% |
| B | 4935 | 23 | 0.466059% |
| C | 4935 | 213 | 4.316109% |
| D | 4935 | 60 | 1.215805% |
Noise dominated data is calculated using 1-second bins in cleaned event files. If a bin has >2000 counts, and if more than 50% of those come from <1% of pixels, then it is considered to be noise-dominated and hence unusable.
| Quadrant | # 1 sec bins | Bins with >0 counts | Bins with >2000 counts | High rate bins dominated by noise | Noise dominated (total time) | Noise dominated (detector-on time) | Marked lightcurve |
|---|---|---|---|---|---|---|---|
| A | 7056 | 4936 | 4 | 4 | 0.06% | 0.08% | 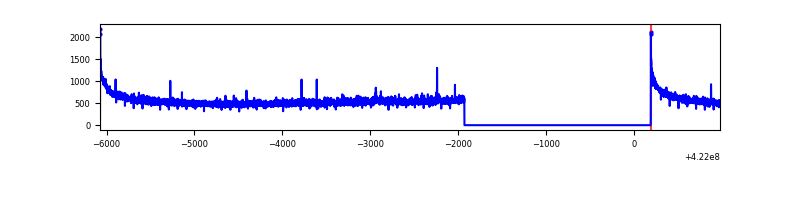 |
| B | 7056 | 4936 | 14 | 14 | 0.20% | 0.28% | 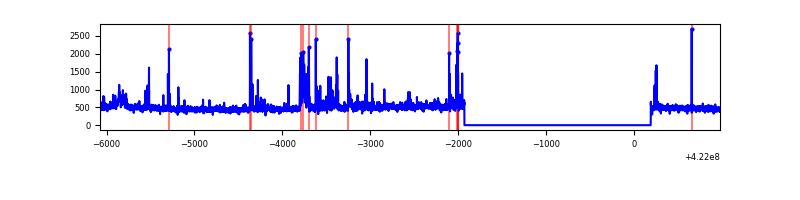 |
| C | 7056 | 4936 | 214 | 214 | 3.03% | 4.34% | 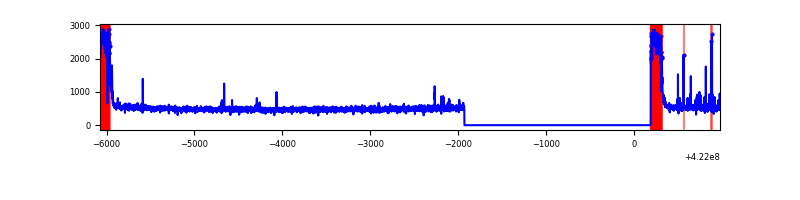 |
| D | 7056 | 4936 | 60 | 60 | 0.85% | 1.22% | 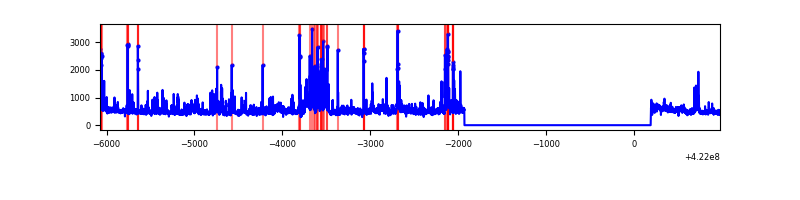 |
Top three noisy pixels from each quadrant. If the there are fewer than three noisy pixels in the level2.evt file, extra rows are filled as -1
| Pixel properties | Quadrant properties | ||||||
|---|---|---|---|---|---|---|---|
| Quadrant | DetID | PixID | Counts | Sigma | Mean | Median | Sigma |
| A | 10 | 83 | 501911 | 4353.04 | 569 | 557 | 115.2 |
| A | 12 | 189 | 25395 | 215.66 | 569 | 557 | 115.2 |
| A | 13 | 6 | 7936 | 64.07 | 569 | 557 | 115.2 |
| B | 0 | 190 | 74510 | 676.99 | 561 | 545 | 109.3 |
| B | 7 | 202 | 72601 | 659.52 | 561 | 545 | 109.3 |
| B | 0 | 186 | 69266 | 628.99 | 561 | 545 | 109.3 |
| C | 0 | 10 | 565850 | 4484.78 | 547 | 552 | 126.0 |
| C | 15 | 214 | 207700 | 1643.4 | 547 | 552 | 126.0 |
| C | 15 | 111 | 46608 | 365.38 | 547 | 552 | 126.0 |
| D | 5 | 222 | 332264 | 2449.95 | 564 | 550 | 135.4 |
| D | 1 | 52 | 214235 | 1578.22 | 564 | 550 | 135.4 |
| D | 13 | 249 | 94858 | 696.53 | 564 | 550 | 135.4 |
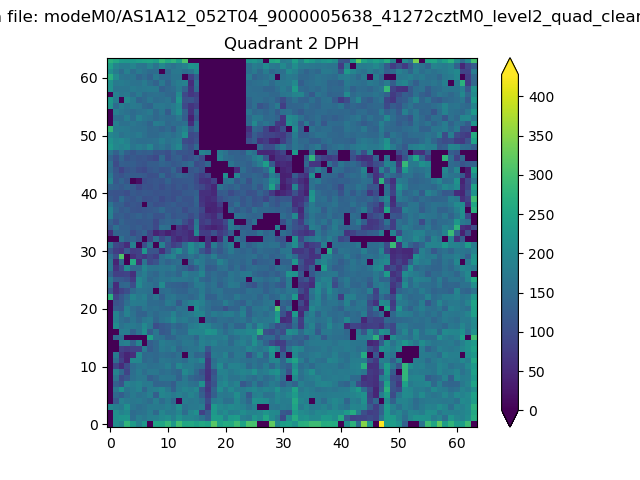
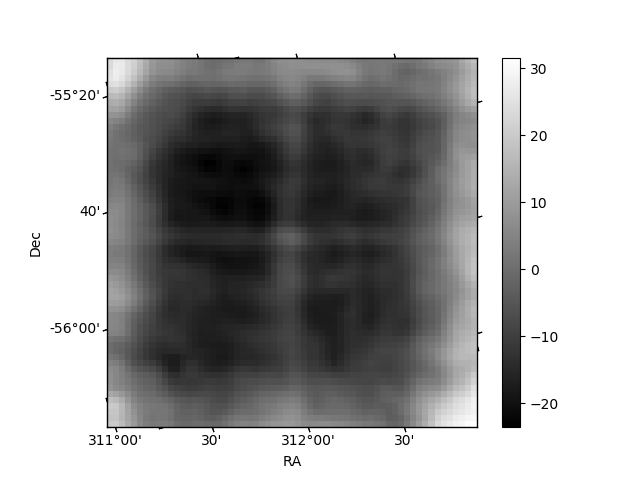
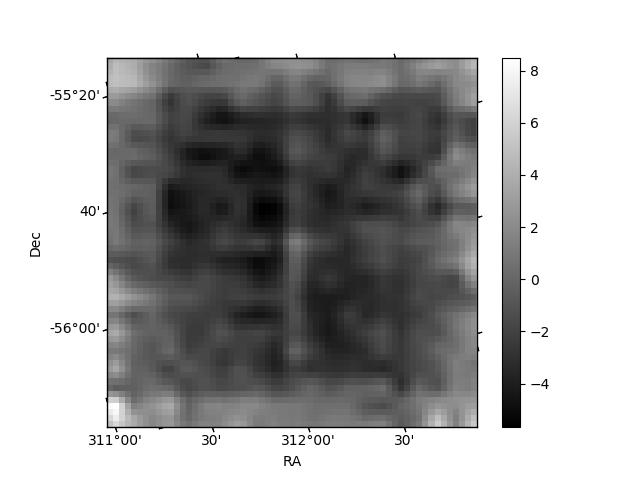
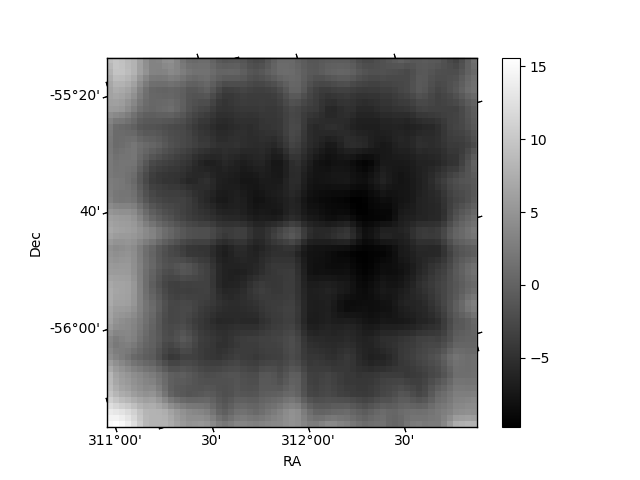
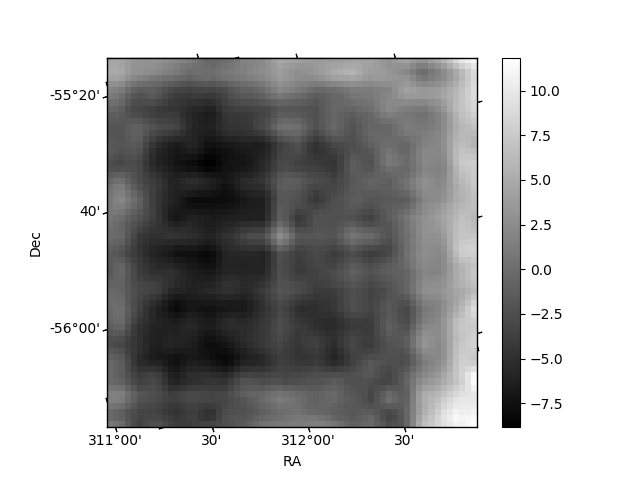
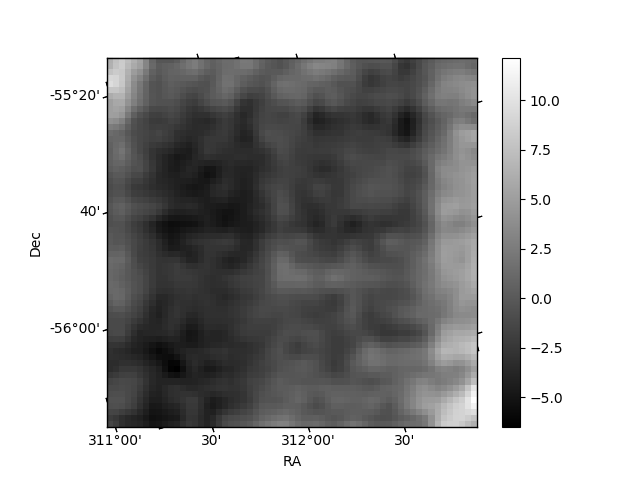
Histogram calculated using DETX and DETY for each event in the final _common_clean file
| Quadrant A | 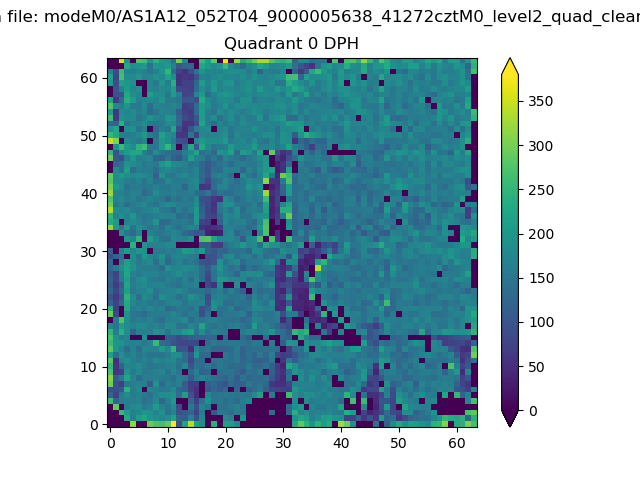 |
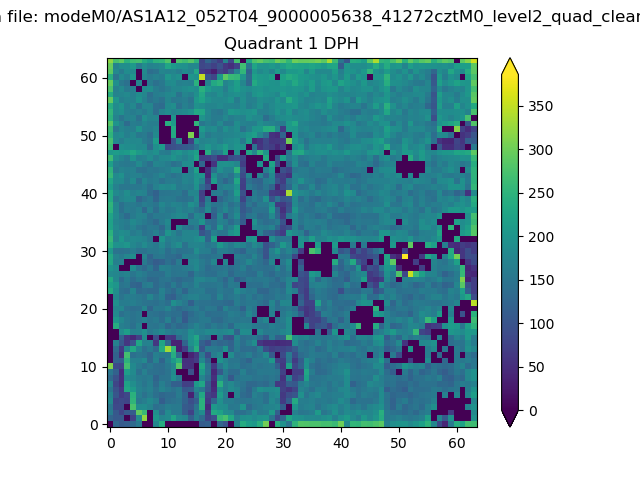 |
Quadrant B |
|---|---|---|---|
| Quadrant D | 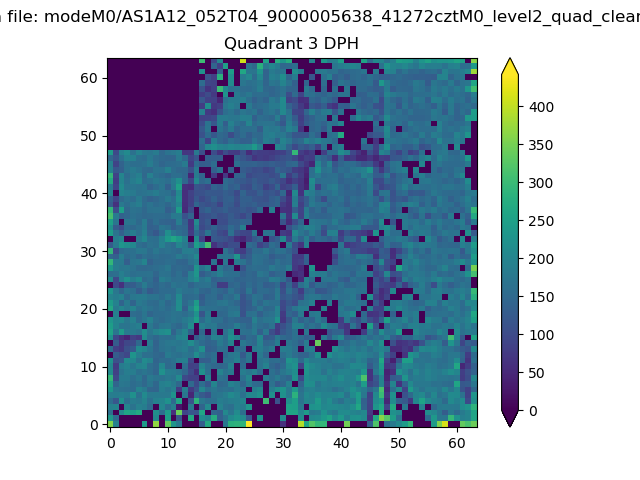 |
 |
Quadrant C |
| Plot type | Count rate plots | Images |
|---|---|---|
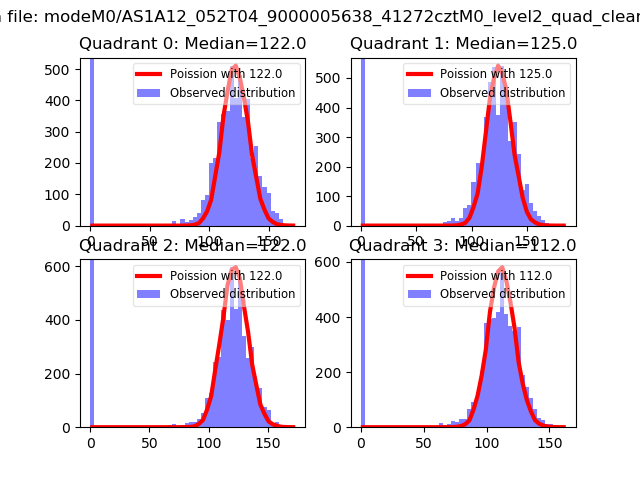
| Comparison with Poisson distribution Blue bars denote a histogram of data divided into 1 sec bins. Red curve is a Poisson curve with rate = median count rate of data. |
 |
 |
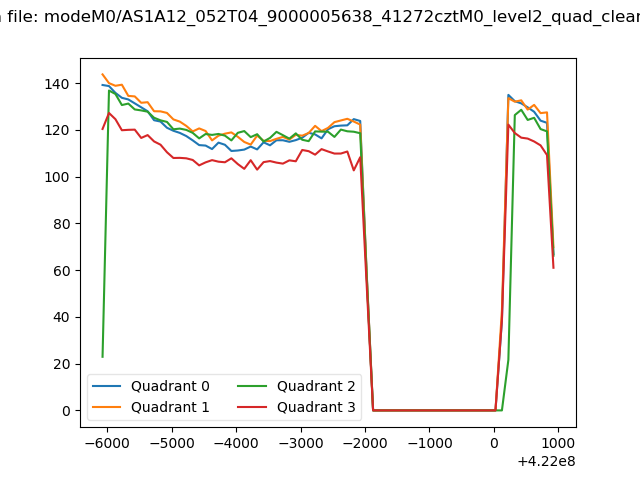
| Quadrant-wise count rates Data is divided into 100 sec bins |
 |
|
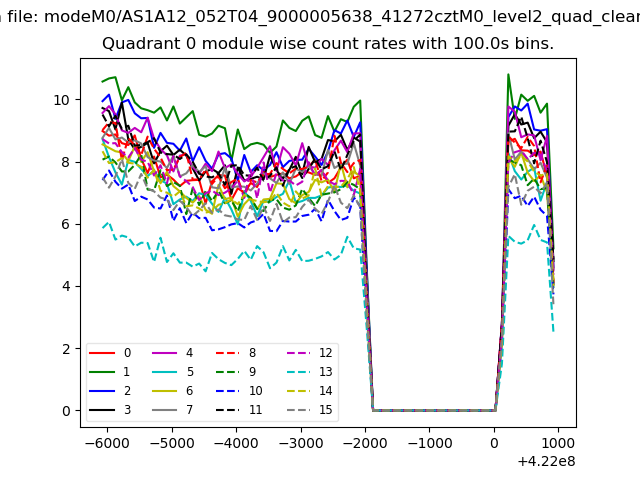
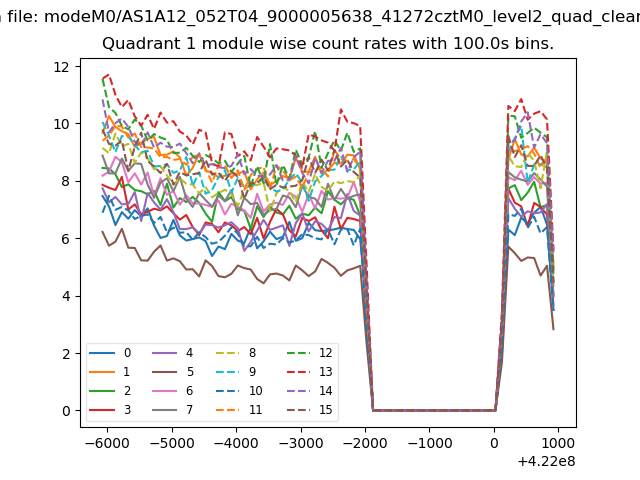
| Module-wise count rates for Quadrant A Data is divided into 100 sec bins |
 |
 |
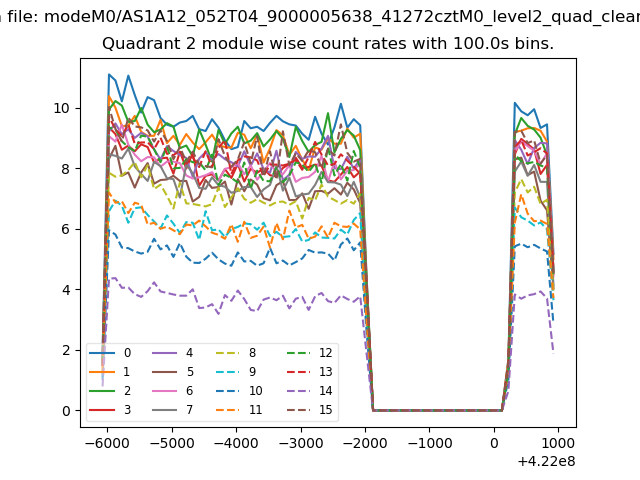
| Module-wise count rates for Quadrant B Data is divided into 100 sec bins |
 |
 |
| Module-wise count rates for Quadrant C Data is divided into 100 sec bins |
 |
 |
| Module-wise count rates for Quadrant D Data is divided into 100 sec bins |
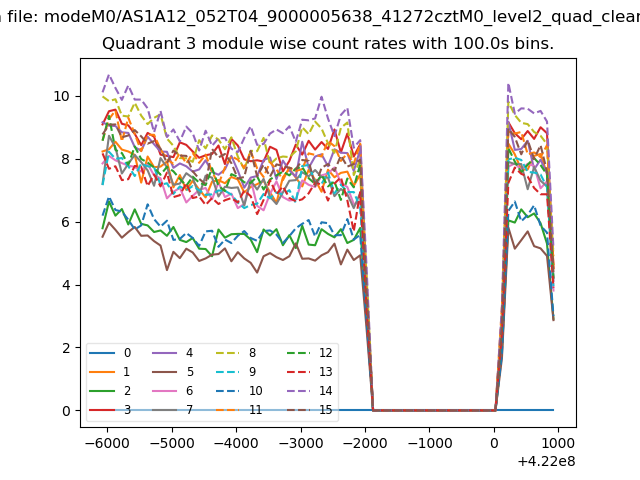 |
 |
| Parameter | Plot |
|---|---|
| CZT HV Monitor | 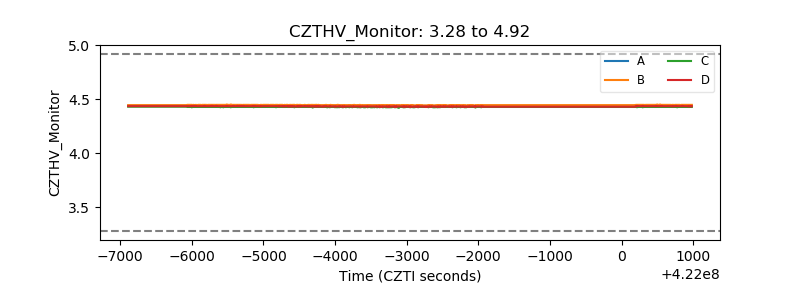 |
| D_VDD |  |
| Temperature 1 | 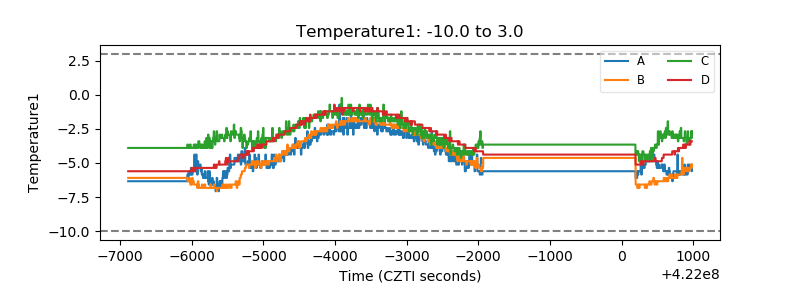 |
| Veto HV Monitor | 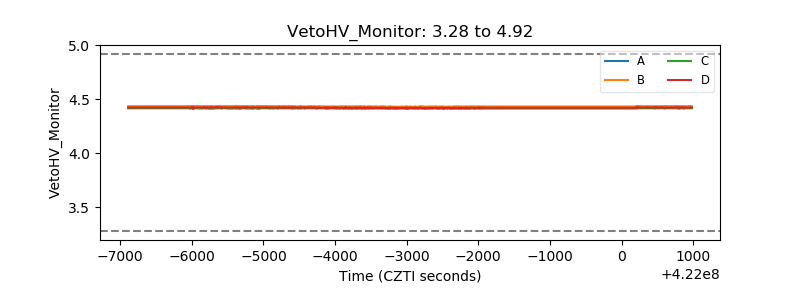 |
| Veto LLD | 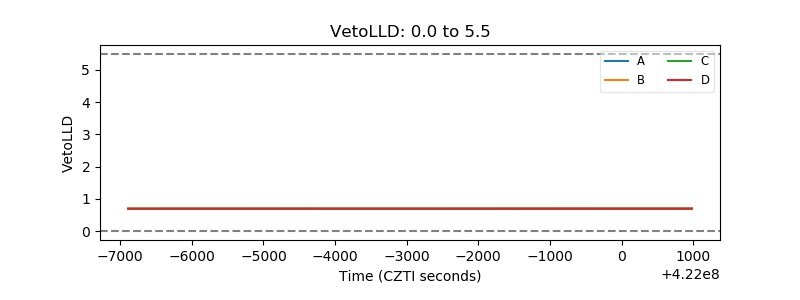 |
| Alpha Counter | 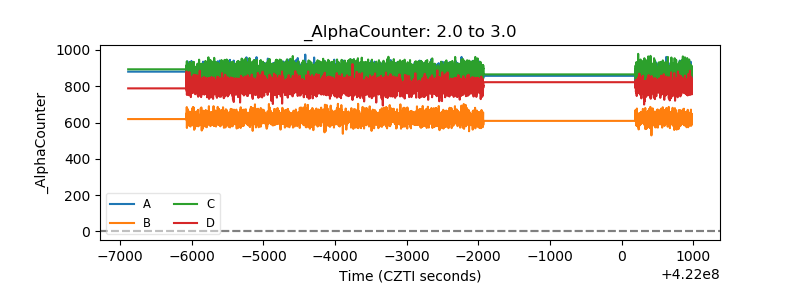 |
| _CPM_Rate | 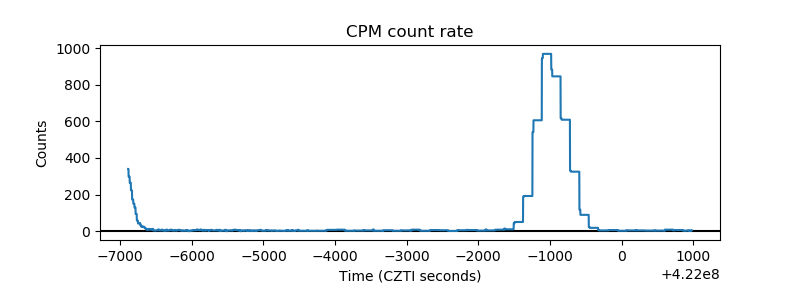 |
| CZT Counter | 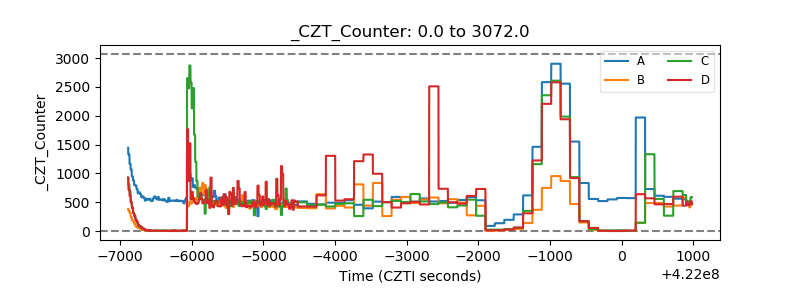 |
| +2.5 Volts monitor | 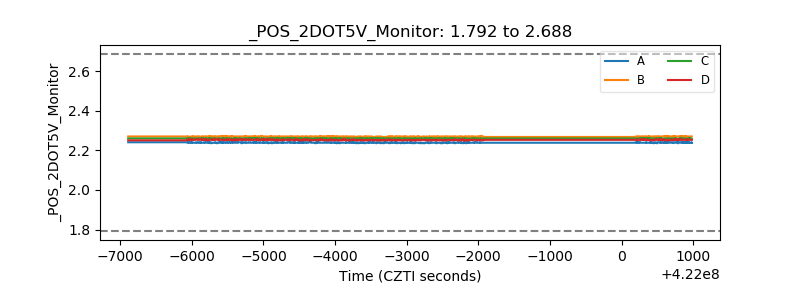 |
| +5 Volts monitor | 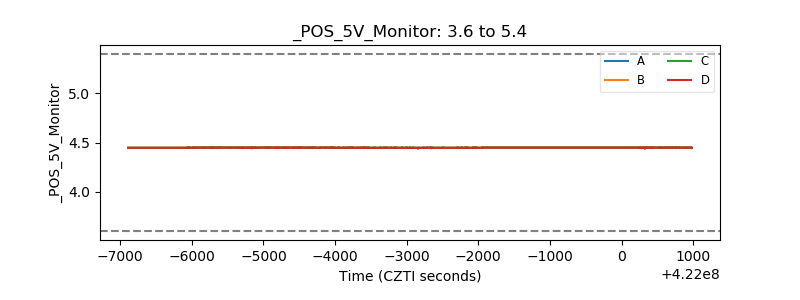 |
| _ROLL_ROT | 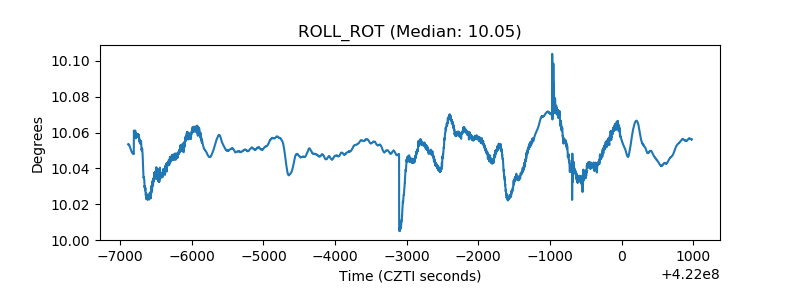 |
| _Roll_DEC | 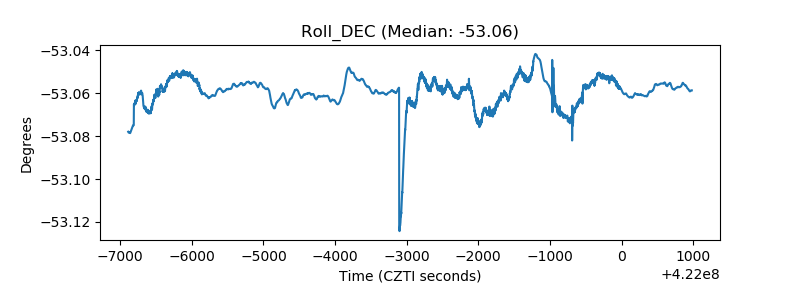 |
| _Roll_RA | 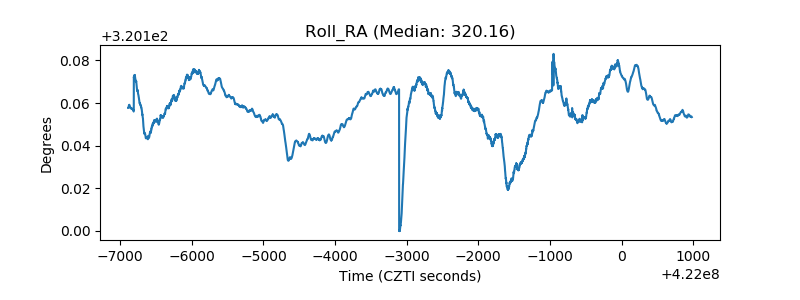 |
| Veto Counter | 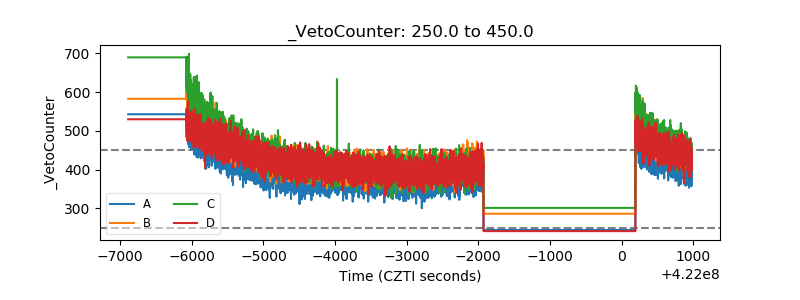 |