| Param | Original file | Final file |
|---|---|---|
| Filename | modeM0/AS1A12_052T04_9000005638_41273cztM0_level2.fits | modeM0/AS1A12_052T04_9000005638_41273cztM0_level2_quad_clean.evt |
| Size (bytes) | 292,282,560 | 85,775,040 |
| Size | 278.7 MB | 81.8 MB |
| Events in quadrant A | 2,673,497 | 579,448 |
| Events in quadrant B | 2,330,140 | 590,452 |
| Events in quadrant C | 2,876,369 | 552,374 |
| Events in quadrant D | 2,557,517 | 531,400 |
| Mode M9 | |||
|---|---|---|---|
| Quadrant | BADHDUFLAG | Total packets | Discarded packets |
| A | 0 | 21 | 0 |
| B | 0 | 21 | 0 |
| C | 0 | 21 | 0 |
| D | 0 | 21 | 0 |
| Mode SS | |||
|---|---|---|---|
| Quadrant | BADHDUFLAG | Total packets | Discarded packets |
| A | 0 | 102 | 0 |
| B | 0 | 102 | 0 |
| C | 0 | 102 | 0 |
| D | 0 | 102 | 0 |
| Mode M0 | |||
|---|---|---|---|
| Quadrant | BADHDUFLAG | Total packets | Discarded packets |
| A | 0 | 10741 | 3 |
| B | 0 | 9961 | 2 |
| C | 0 | 11479 | 2 |
| D | 0 | 10820 | 2 |
| Quadrant | Total seconds | Saturated seconds | Saturation percentage |
|---|---|---|---|
| A | 4893 | 8 | 0.163499% |
| B | 4893 | 6 | 0.122624% |
| C | 4893 | 206 | 4.210096% |
| D | 4894 | 25 | 0.510830% |
Noise dominated data is calculated using 1-second bins in cleaned event files. If a bin has >2000 counts, and if more than 50% of those come from <1% of pixels, then it is considered to be noise-dominated and hence unusable.
| Quadrant | # 1 sec bins | Bins with >0 counts | Bins with >2000 counts | High rate bins dominated by noise | Noise dominated (total time) | Noise dominated (detector-on time) | Marked lightcurve |
|---|---|---|---|---|---|---|---|
| A | 7016 | 4894 | 3 | 3 | 0.04% | 0.06% | 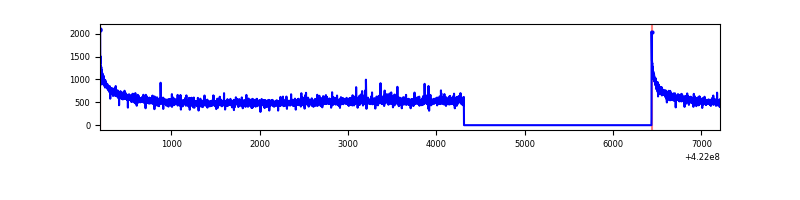 |
| B | 7016 | 4894 | 1 | 1 | 0.01% | 0.02% | 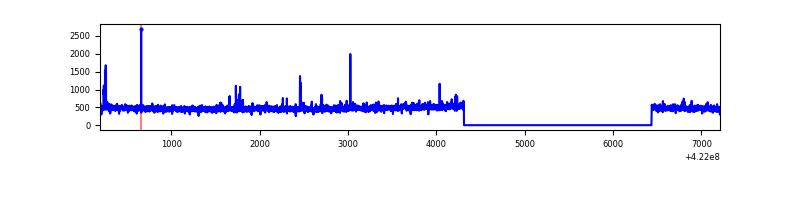 |
| C | 7016 | 4894 | 204 | 204 | 2.91% | 4.17% | 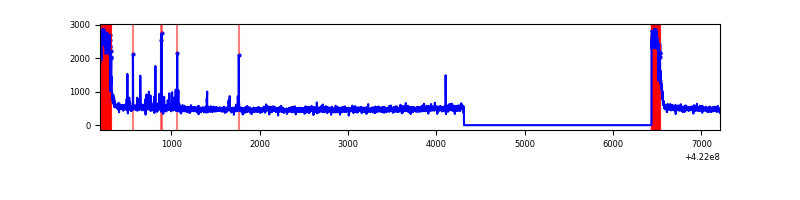 |
| D | 7017 | 4895 | 24 | 24 | 0.34% | 0.49% | 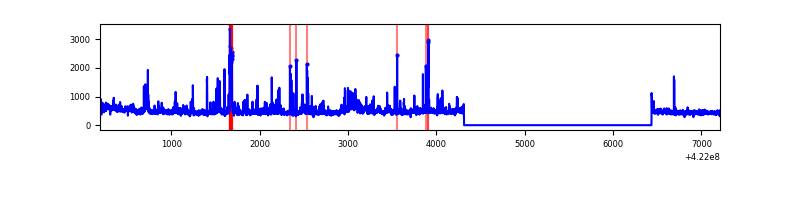 |
Top three noisy pixels from each quadrant. If the there are fewer than three noisy pixels in the level2.evt file, extra rows are filled as -1
| Pixel properties | Quadrant properties | ||||||
|---|---|---|---|---|---|---|---|
| Quadrant | DetID | PixID | Counts | Sigma | Mean | Median | Sigma |
| A | 10 | 83 | 491448 | 4368.41 | 556 | 544 | 112.4 |
| A | 2 | 79 | 17103 | 147.35 | 556 | 544 | 112.4 |
| A | 12 | 189 | 10174 | 85.69 | 556 | 544 | 112.4 |
| B | 7 | 202 | 116961 | 1092.12 | 547 | 531 | 106.6 |
| B | 5 | 255 | 22007 | 201.45 | 547 | 531 | 106.6 |
| B | 0 | 229 | 19479 | 177.73 | 547 | 531 | 106.6 |
| C | 0 | 10 | 535094 | 4368.21 | 531 | 535 | 122.4 |
| C | 15 | 214 | 209043 | 1703.85 | 531 | 535 | 122.4 |
| C | 15 | 111 | 51674 | 417.89 | 531 | 535 | 122.4 |
| D | 5 | 222 | 188809 | 1415.77 | 549 | 533 | 133.0 |
| D | 1 | 52 | 113975 | 853.04 | 549 | 533 | 133.0 |
| D | 2 | 249 | 60372 | 449.97 | 549 | 533 | 133.0 |
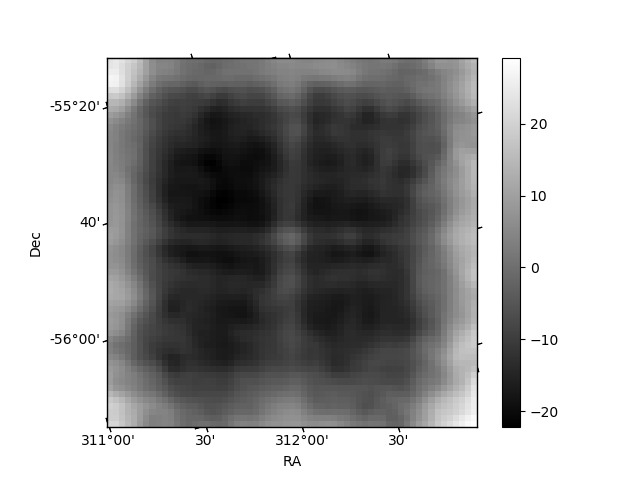
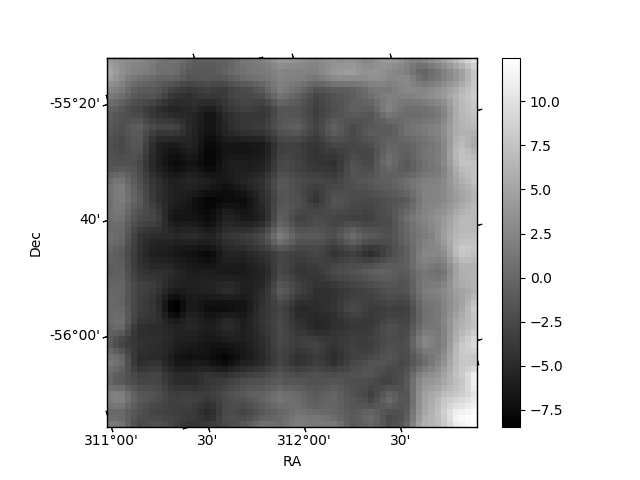
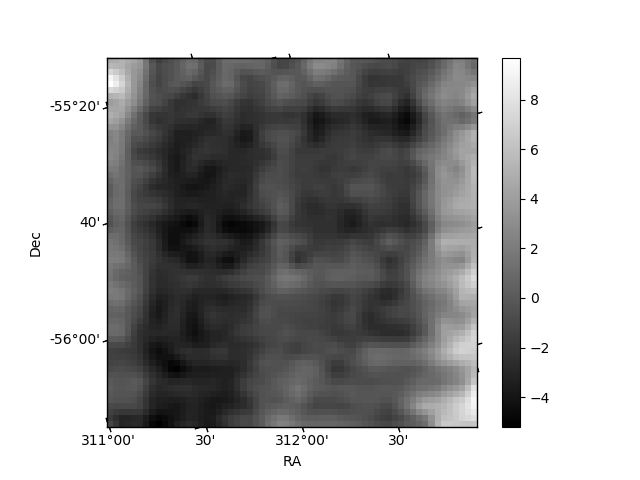
Histogram calculated using DETX and DETY for each event in the final _common_clean file
| Quadrant A | 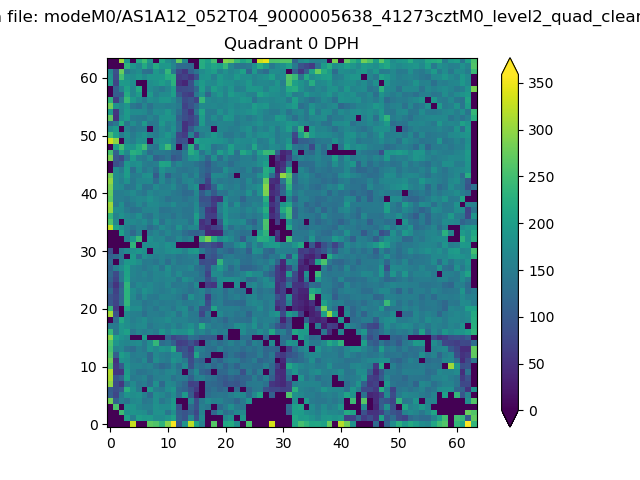 |
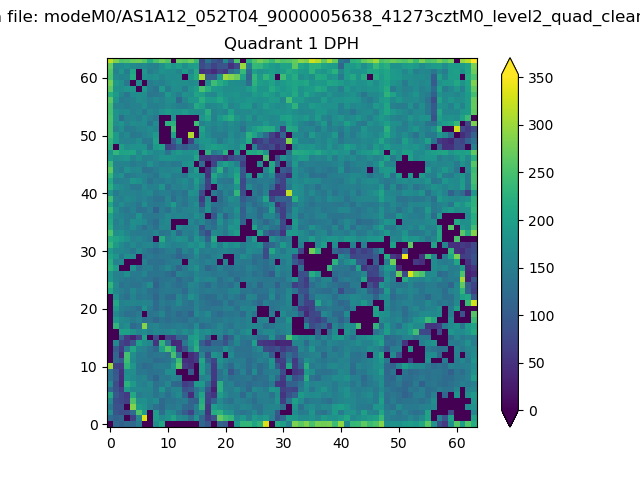 |
Quadrant B |
|---|---|---|---|
| Quadrant D | 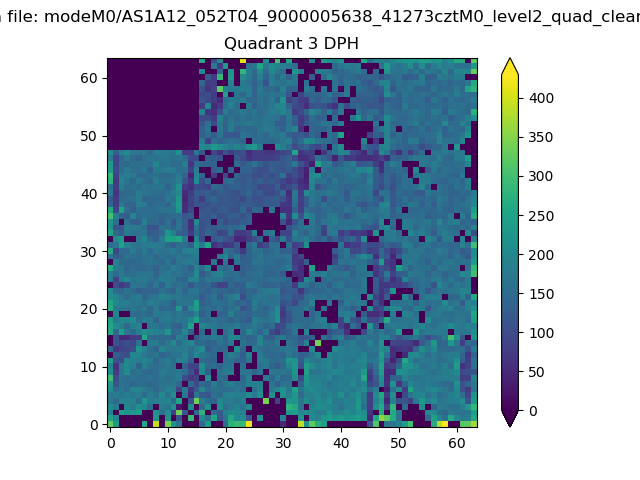 |
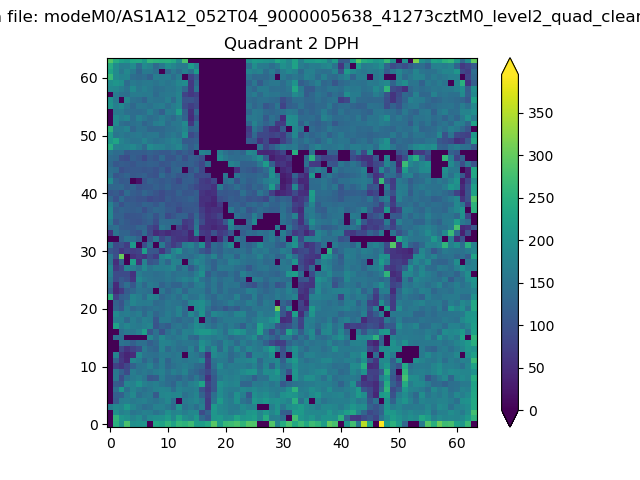 |
Quadrant C |
| Plot type | Count rate plots | Images |
|---|---|---|
| Comparison with Poisson distribution Blue bars denote a histogram of data divided into 1 sec bins. Red curve is a Poisson curve with rate = median count rate of data. |
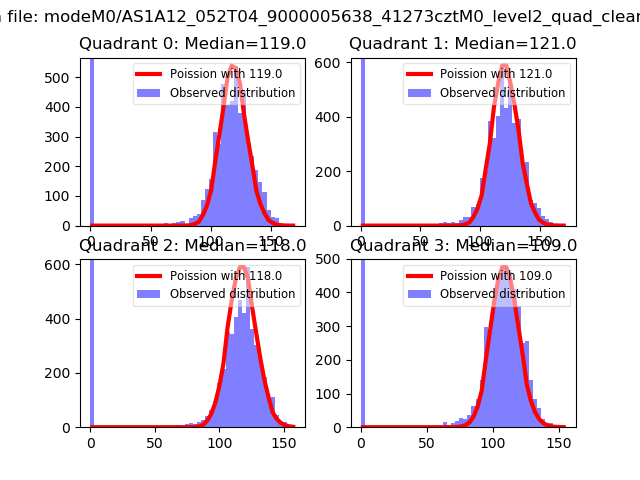 |
 |
| Quadrant-wise count rates Data is divided into 100 sec bins |
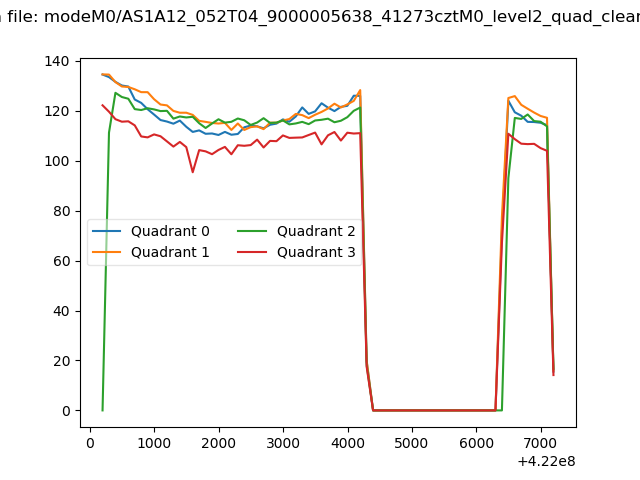 |
|
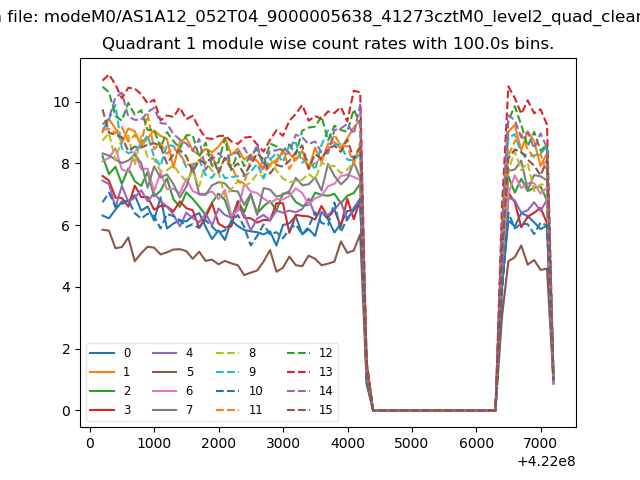
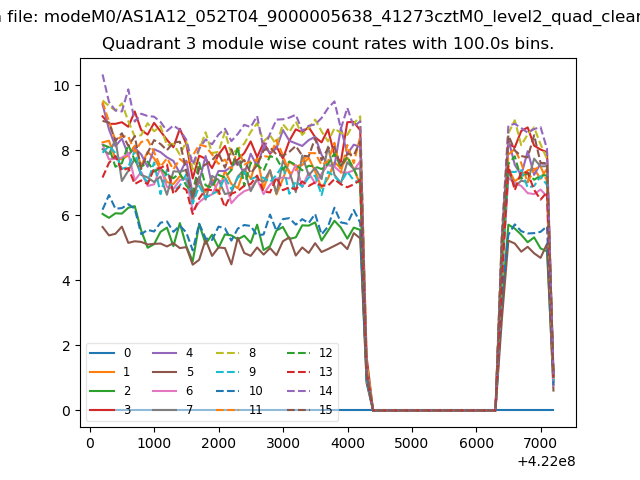
| Module-wise count rates for Quadrant A Data is divided into 100 sec bins |
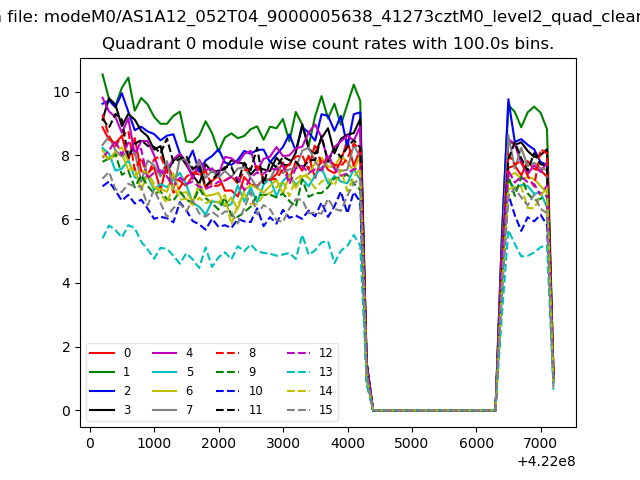 |
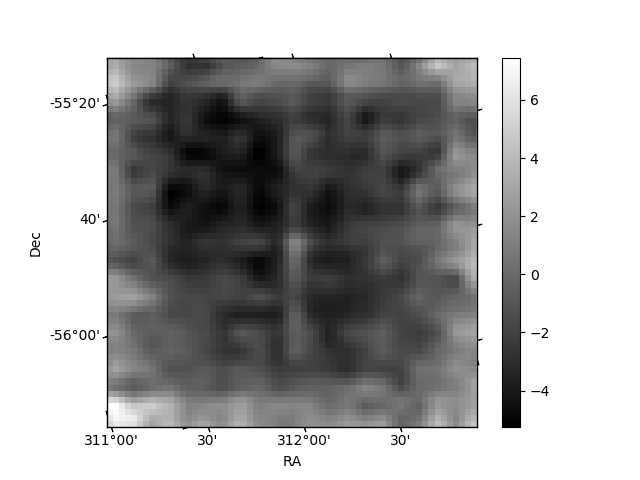 |
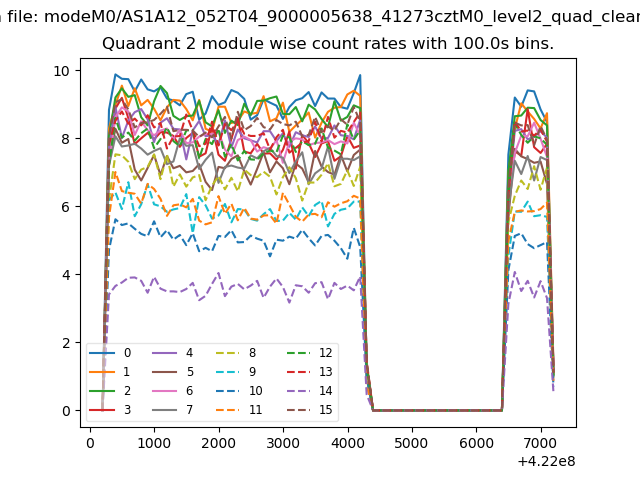
| Module-wise count rates for Quadrant B Data is divided into 100 sec bins |
 |
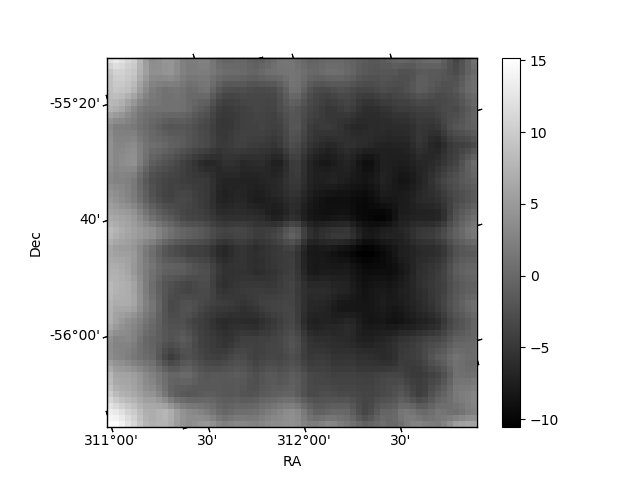 |
| Module-wise count rates for Quadrant C Data is divided into 100 sec bins |
 |
 |
| Module-wise count rates for Quadrant D Data is divided into 100 sec bins |
 |
 |
| Parameter | Plot |
|---|---|
| CZT HV Monitor |  |
| D_VDD | 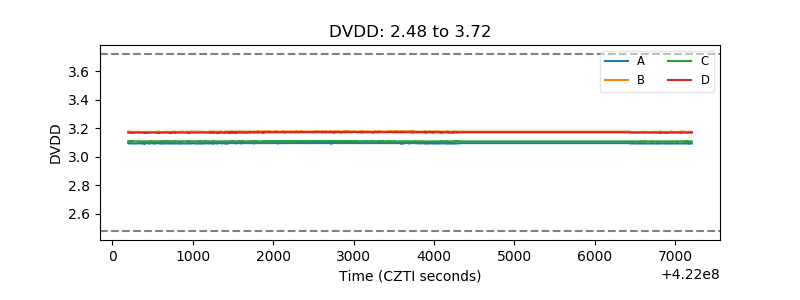 |
| Temperature 1 | 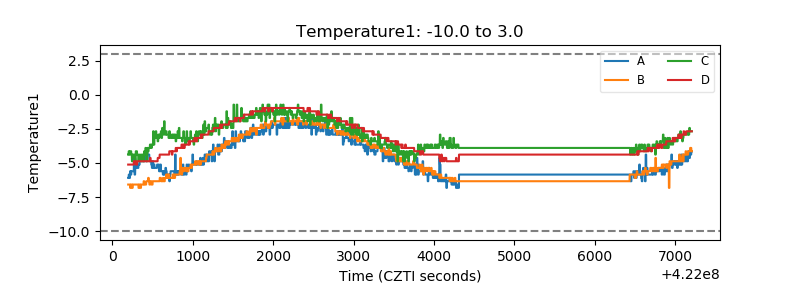 |
| Veto HV Monitor | 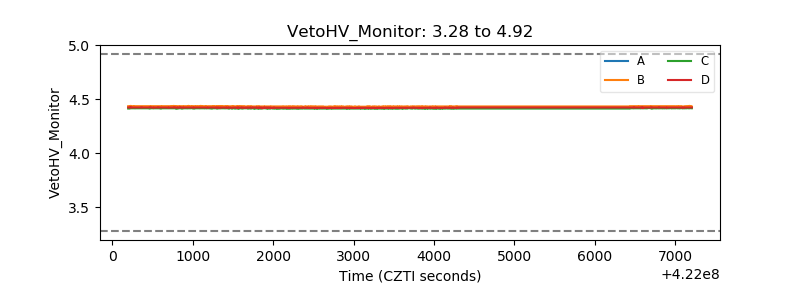 |
| Veto LLD | 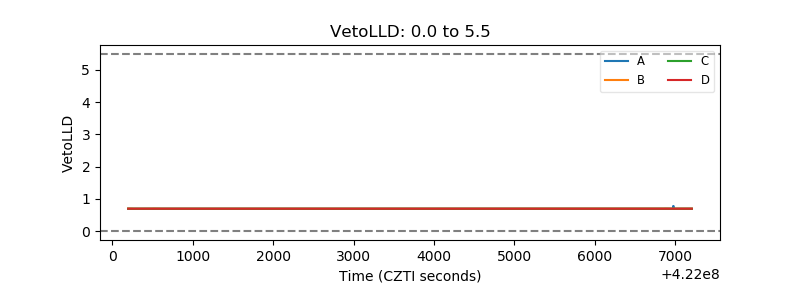 |
| Alpha Counter | 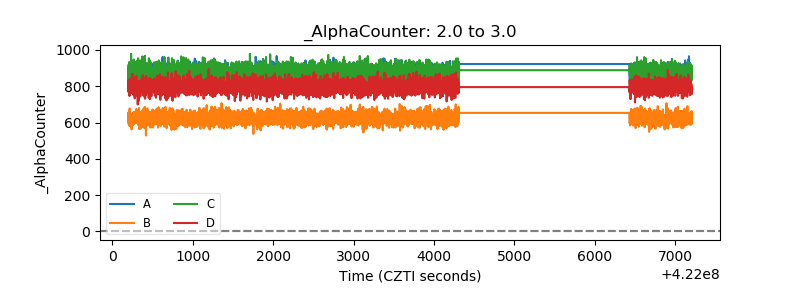 |
| _CPM_Rate | 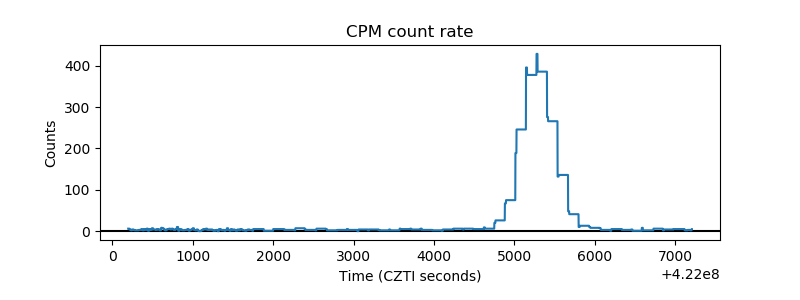 |
| CZT Counter | 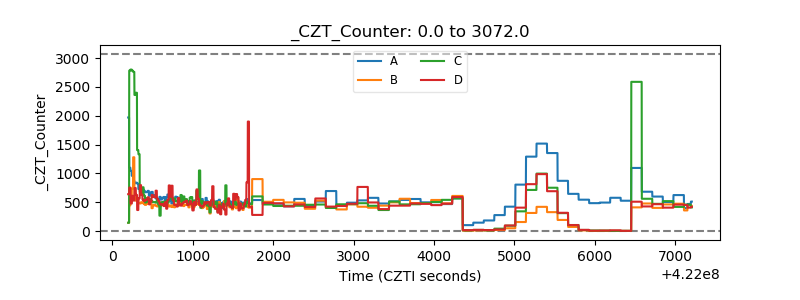 |
| +2.5 Volts monitor | 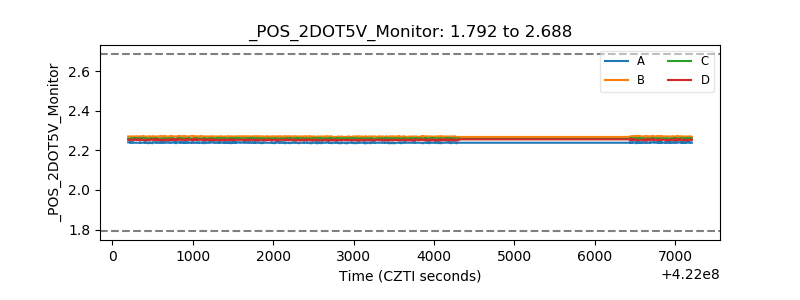 |
| +5 Volts monitor | 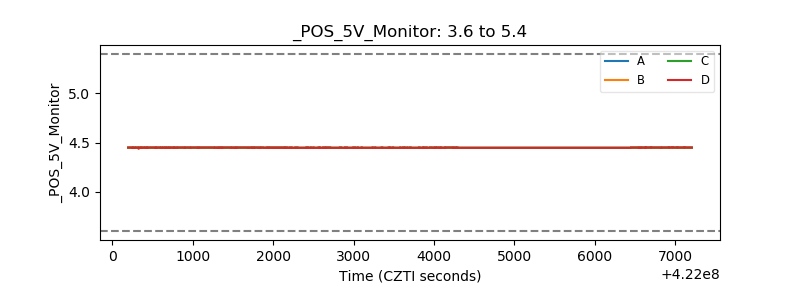 |
| _ROLL_ROT | 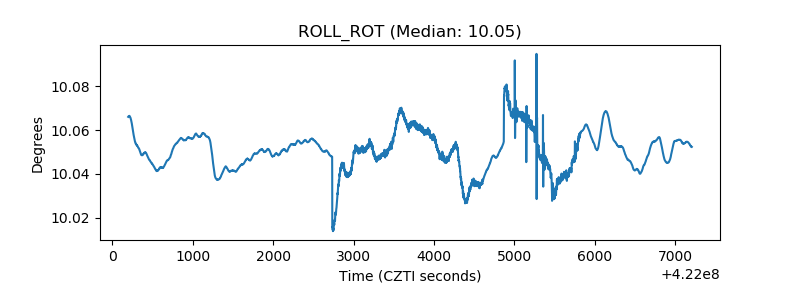 |
| _Roll_DEC | 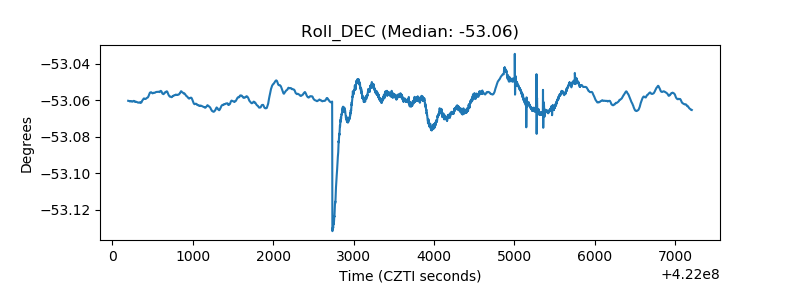 |
| _Roll_RA | 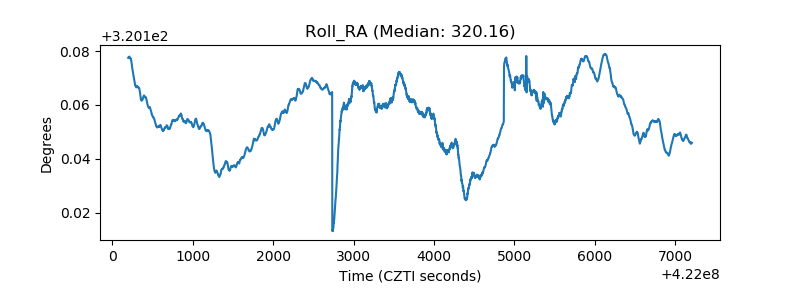 |
| Veto Counter | 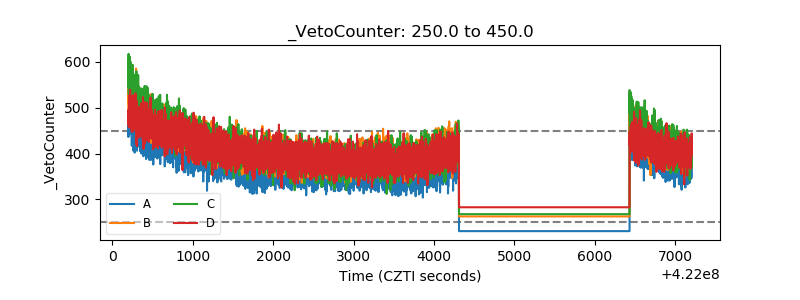 |