| Param | Original file | Final file |
|---|---|---|
| Filename | modeM0/AS1A12_052T04_9000005638_41274cztM0_level2.fits | modeM0/AS1A12_052T04_9000005638_41274cztM0_level2_quad_clean.evt |
| Size (bytes) | 313,007,040 | 89,268,480 |
| Size | 298.5 MB | 85.1 MB |
| Events in quadrant A | 3,057,037 | 597,739 |
| Events in quadrant B | 2,551,330 | 608,851 |
| Events in quadrant C | 2,919,563 | 575,787 |
| Events in quadrant D | 2,644,123 | 548,543 |
| Mode M9 | |||
|---|---|---|---|
| Quadrant | BADHDUFLAG | Total packets | Discarded packets |
| A | 0 | 24 | 0 |
| B | 0 | 24 | 0 |
| C | 0 | 24 | 0 |
| D | 0 | 25 | 0 |
| Mode SS | |||
|---|---|---|---|
| Quadrant | BADHDUFLAG | Total packets | Discarded packets |
| A | 0 | 108 | 0 |
| B | 0 | 108 | 0 |
| C | 0 | 108 | 0 |
| D | 0 | 108 | 0 |
| Mode M0 | |||
|---|---|---|---|
| Quadrant | BADHDUFLAG | Total packets | Discarded packets |
| A | 0 | 12202 | 3 |
| B | 0 | 11104 | 2 |
| C | 0 | 12036 | 2 |
| D | 0 | 11568 | 2 |
| Quadrant | Total seconds | Saturated seconds | Saturation percentage |
|---|---|---|---|
| A | 5317 | 11 | 0.206884% |
| B | 5317 | 20 | 0.376152% |
| C | 5317 | 179 | 3.366560% |
| D | 5317 | 24 | 0.451382% |
Noise dominated data is calculated using 1-second bins in cleaned event files. If a bin has >2000 counts, and if more than 50% of those come from <1% of pixels, then it is considered to be noise-dominated and hence unusable.
| Quadrant | # 1 sec bins | Bins with >0 counts | Bins with >2000 counts | High rate bins dominated by noise | Noise dominated (total time) | Noise dominated (detector-on time) | Marked lightcurve |
|---|---|---|---|---|---|---|---|
| A | 7351 | 5318 | 5 | 5 | 0.07% | 0.09% | 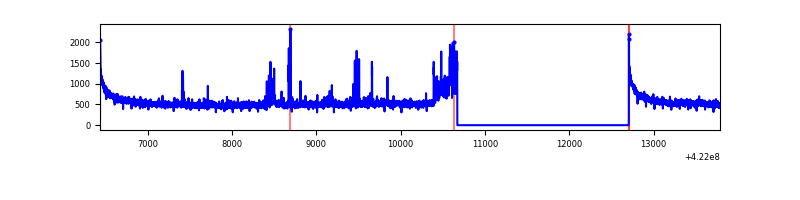 |
| B | 7351 | 5318 | 11 | 11 | 0.15% | 0.21% | 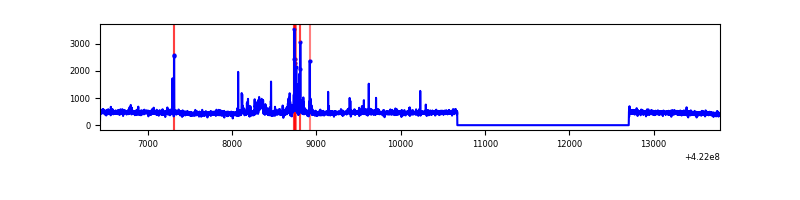 |
| C | 7351 | 5318 | 176 | 176 | 2.39% | 3.31% | 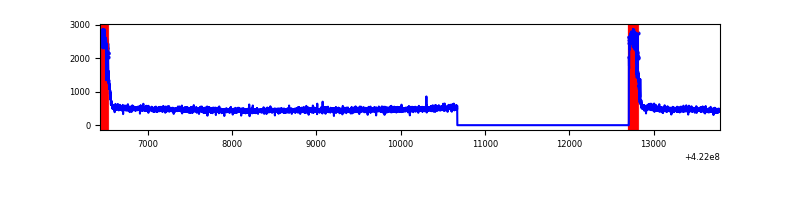 |
| D | 7351 | 5318 | 27 | 27 | 0.37% | 0.51% | 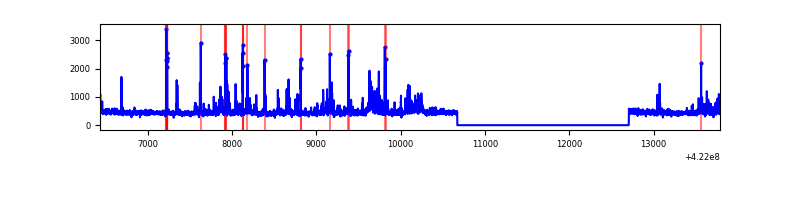 |
Top three noisy pixels from each quadrant. If the there are fewer than three noisy pixels in the level2.evt file, extra rows are filled as -1
| Pixel properties | Quadrant properties | ||||||
|---|---|---|---|---|---|---|---|
| Quadrant | DetID | PixID | Counts | Sigma | Mean | Median | Sigma |
| A | 10 | 83 | 515235 | 4274.12 | 588 | 575 | 120.4 |
| A | 6 | 10 | 145551 | 1203.99 | 588 | 575 | 120.4 |
| A | 2 | 79 | 66868 | 550.55 | 588 | 575 | 120.4 |
| B | 0 | 186 | 80985 | 721.27 | 579 | 563 | 111.5 |
| B | 7 | 202 | 80227 | 714.47 | 579 | 563 | 111.5 |
| B | 5 | 255 | 58037 | 515.46 | 579 | 563 | 111.5 |
| C | 0 | 10 | 495395 | 3781.72 | 562 | 565 | 130.8 |
| C | 15 | 214 | 225650 | 1720.2 | 562 | 565 | 130.8 |
| C | 13 | 61 | 3690 | 23.88 | 562 | 565 | 130.8 |
| D | 1 | 52 | 204170 | 1453.98 | 578 | 564 | 140.0 |
| D | 2 | 249 | 63757 | 451.27 | 578 | 564 | 140.0 |
| D | 12 | 233 | 50526 | 356.79 | 578 | 564 | 140.0 |
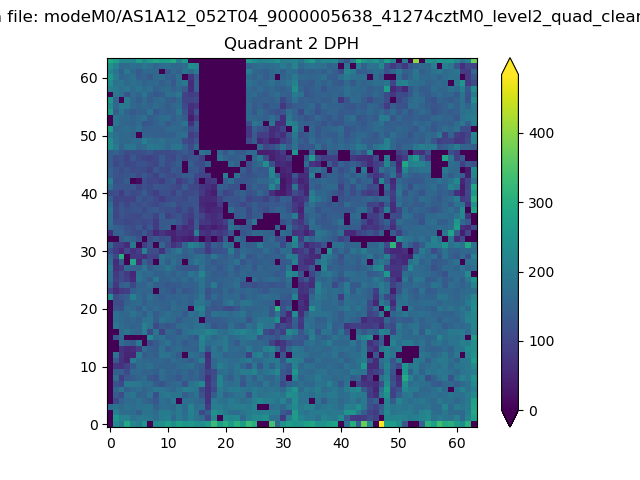
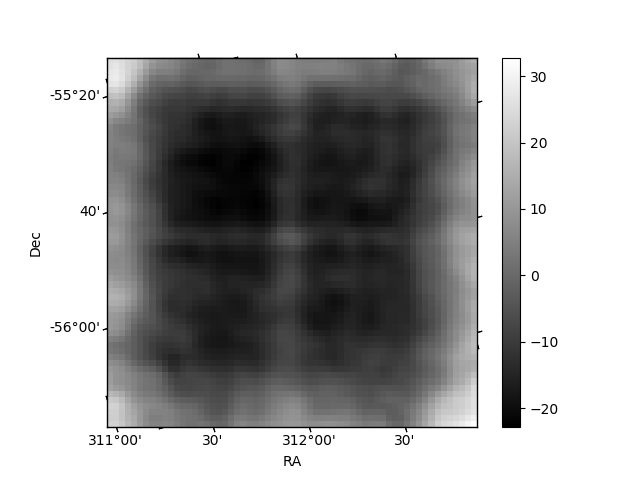
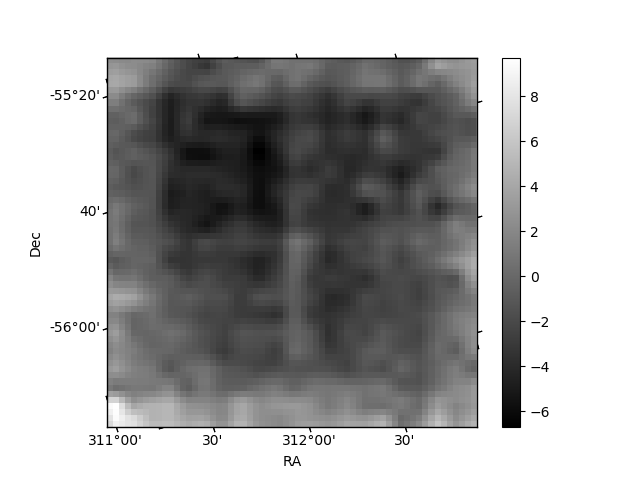
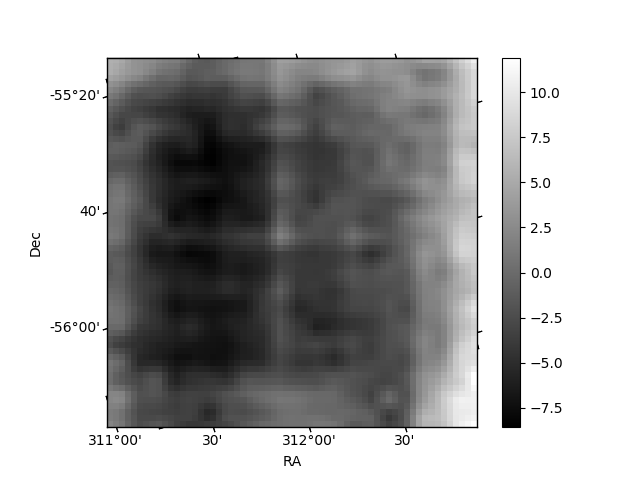
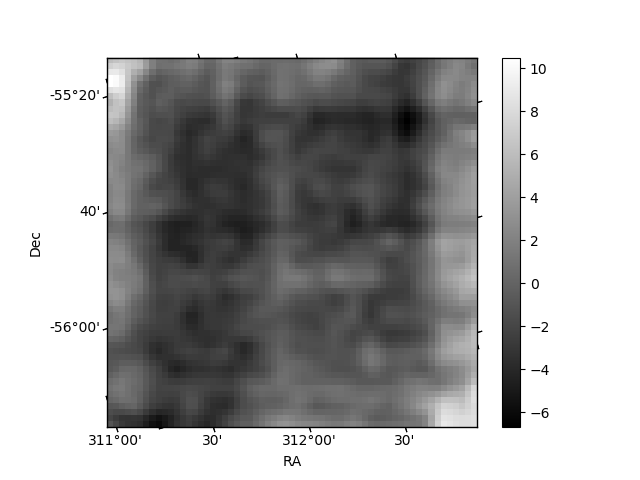
Histogram calculated using DETX and DETY for each event in the final _common_clean file
| Quadrant A | 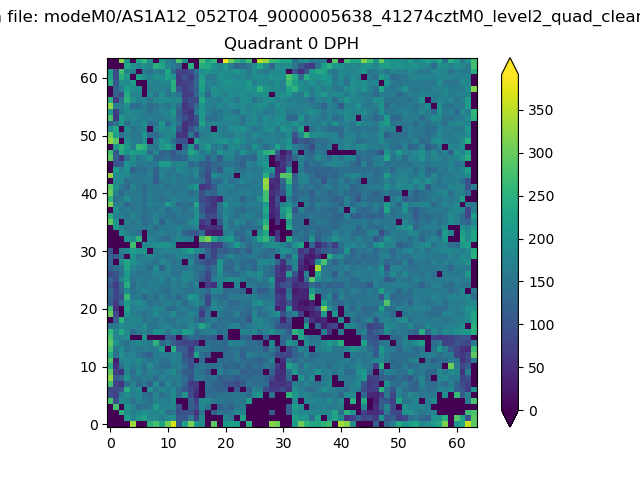 |
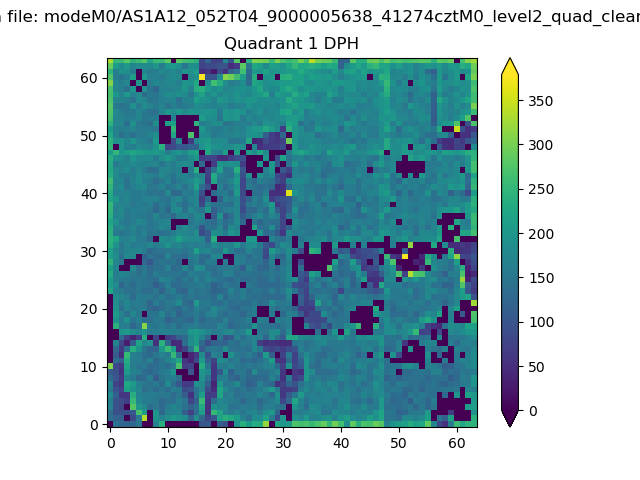 |
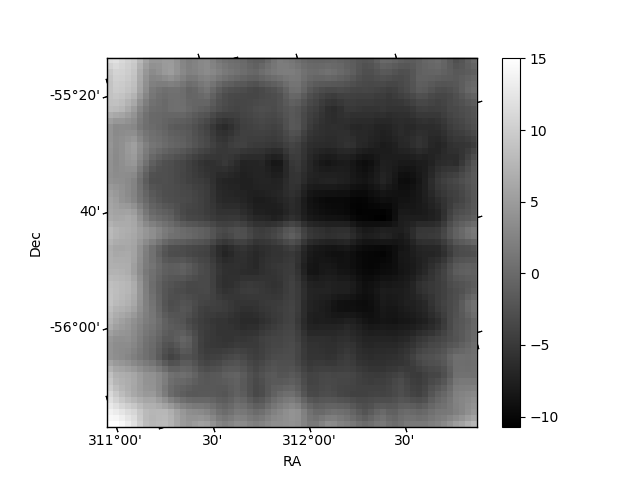
Quadrant B |
|---|---|---|---|
| Quadrant D | 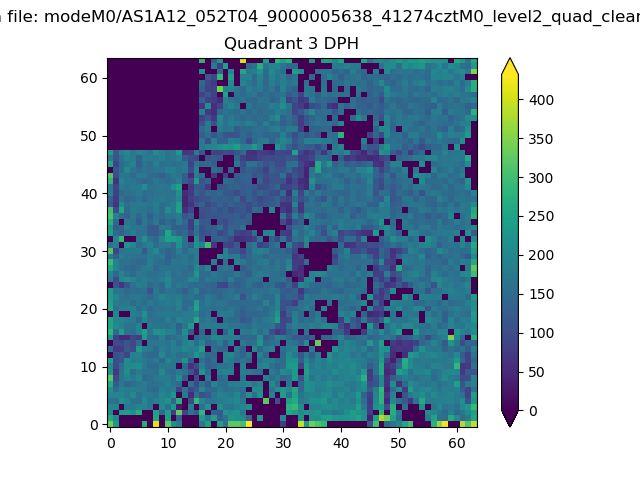 |
 |
Quadrant C |
| Plot type | Count rate plots | Images |
|---|---|---|
| Comparison with Poisson distribution Blue bars denote a histogram of data divided into 1 sec bins. Red curve is a Poisson curve with rate = median count rate of data. |
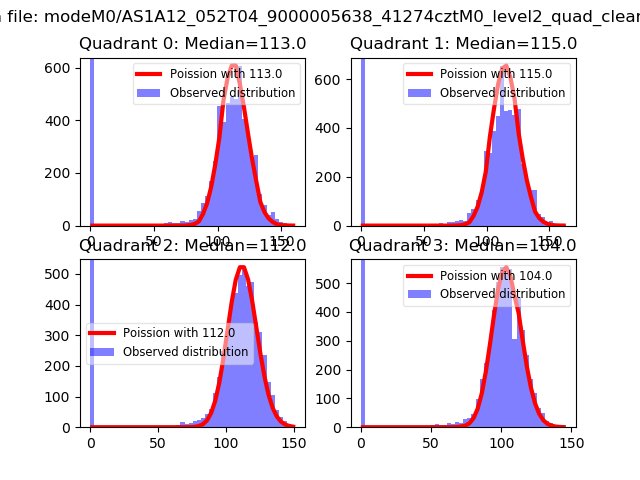 |
 |
| Quadrant-wise count rates Data is divided into 100 sec bins |
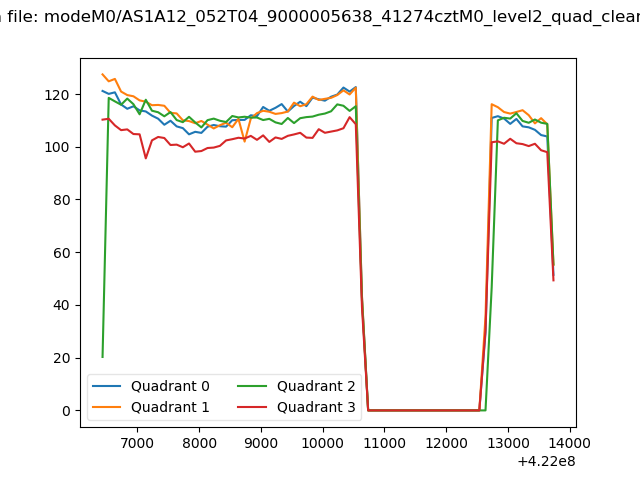 |
|
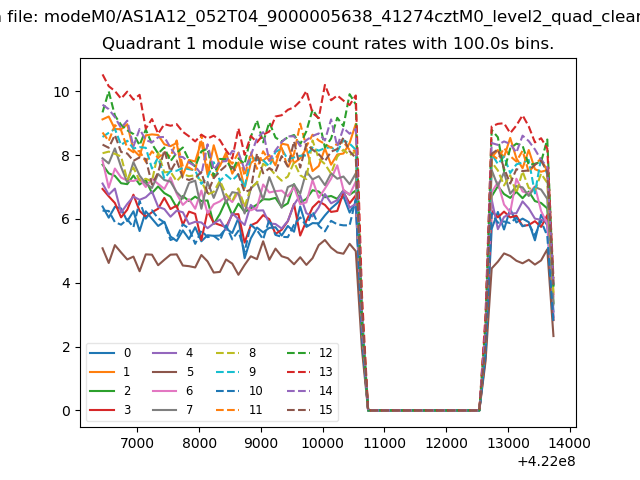
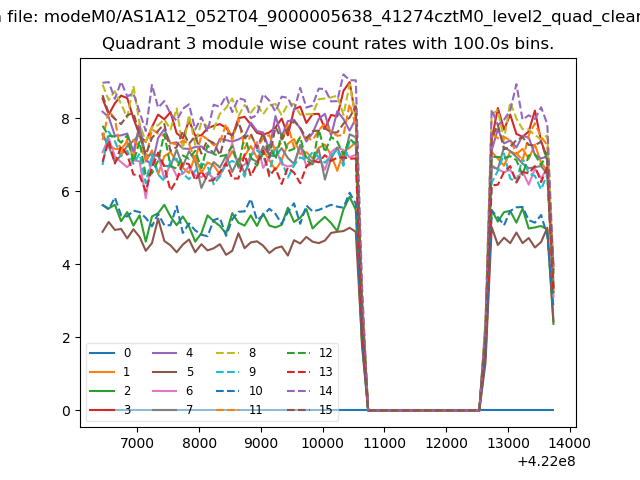
| Module-wise count rates for Quadrant A Data is divided into 100 sec bins |
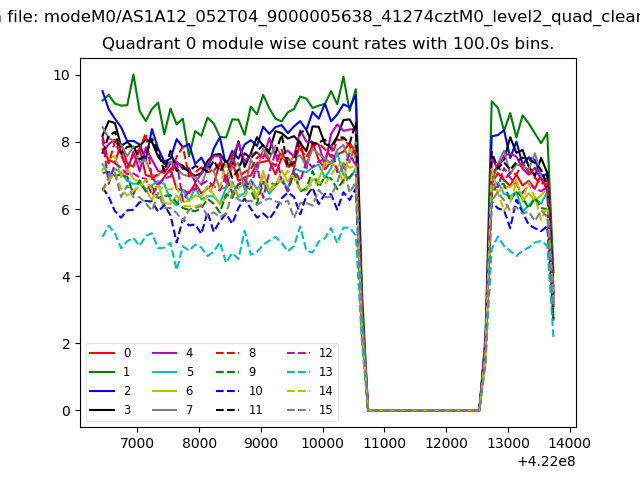 |
 |
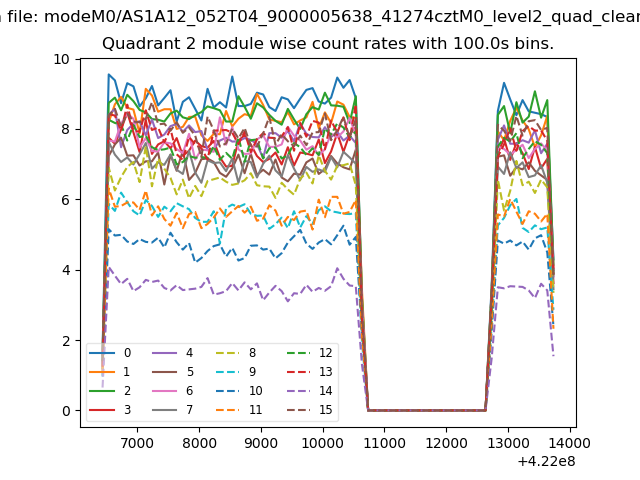
| Module-wise count rates for Quadrant B Data is divided into 100 sec bins |
 |
 |
| Module-wise count rates for Quadrant C Data is divided into 100 sec bins |
 |
 |
| Module-wise count rates for Quadrant D Data is divided into 100 sec bins |
 |
 |
| Parameter | Plot |
|---|---|
| CZT HV Monitor | 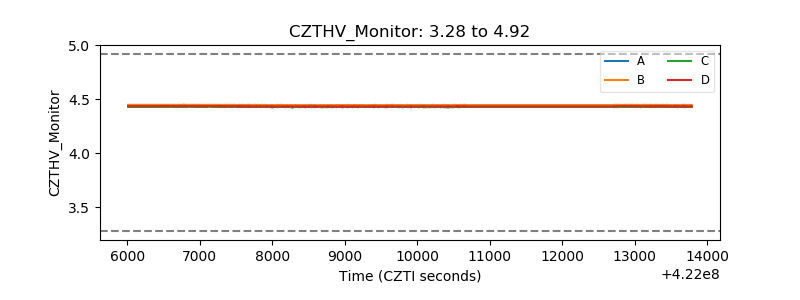 |
| D_VDD | 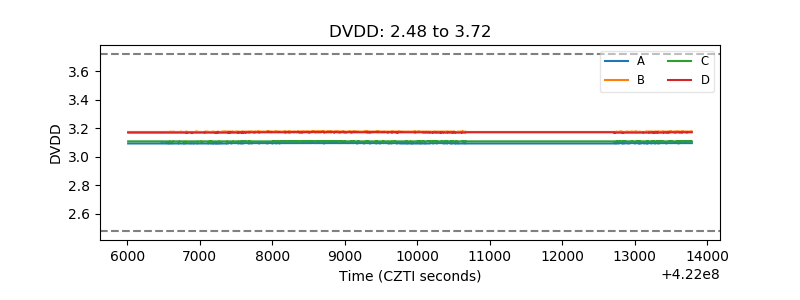 |
| Temperature 1 | 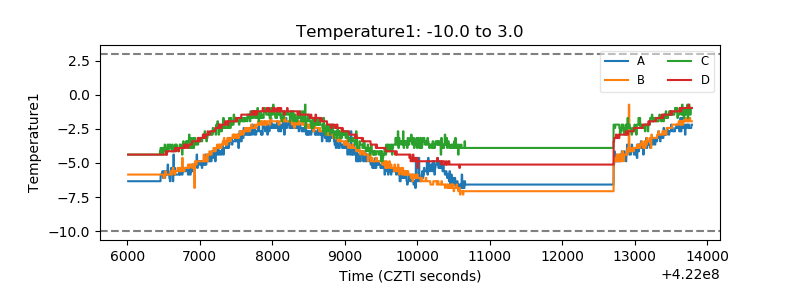 |
| Veto HV Monitor | 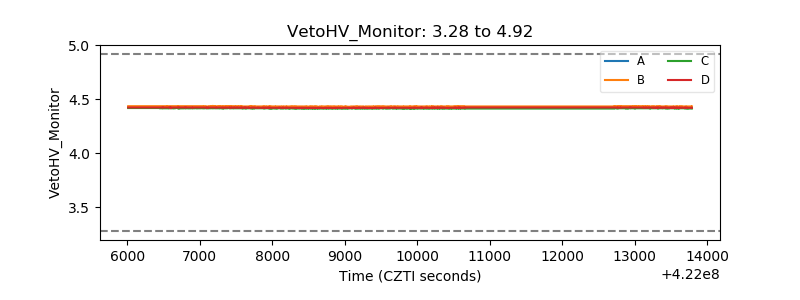 |
| Veto LLD | 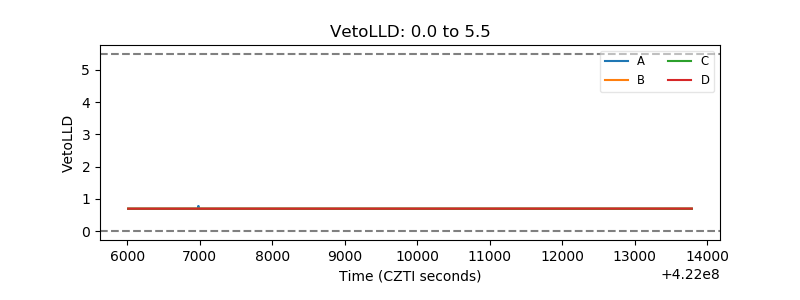 |
| Alpha Counter | 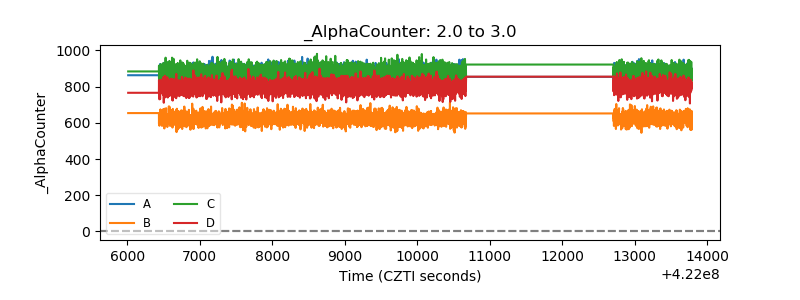 |
| _CPM_Rate | 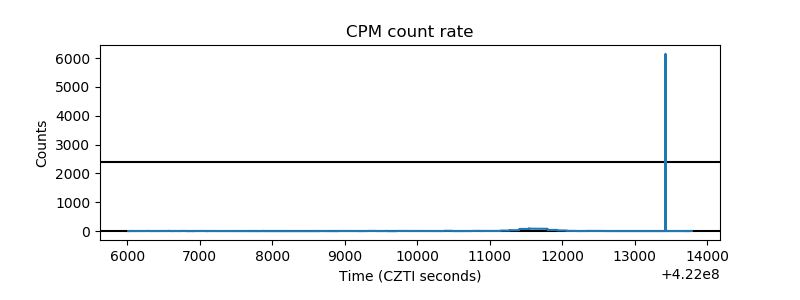 |
| CZT Counter | 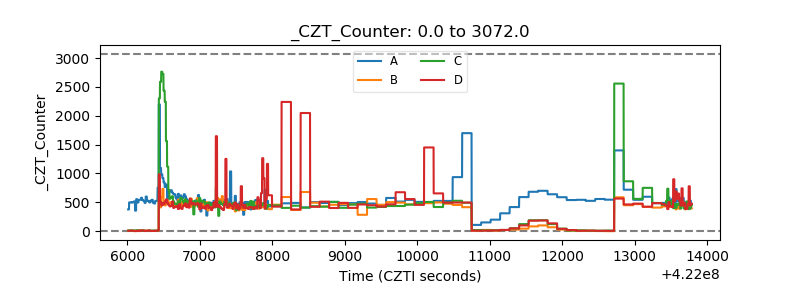 |
| +2.5 Volts monitor | 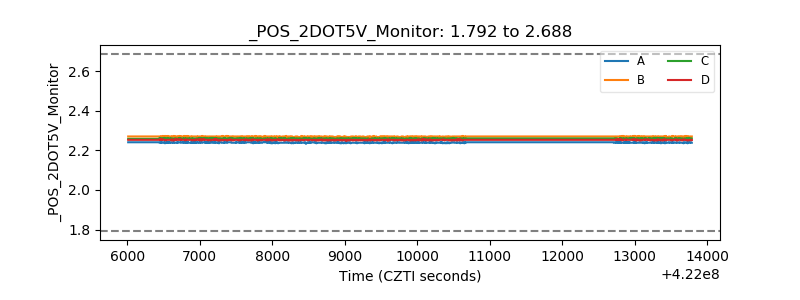 |
| +5 Volts monitor | 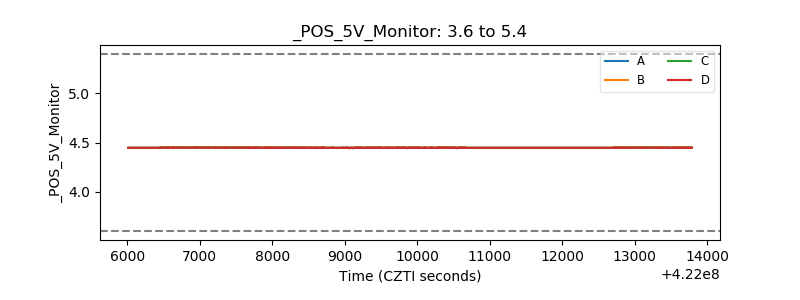 |
| _ROLL_ROT | 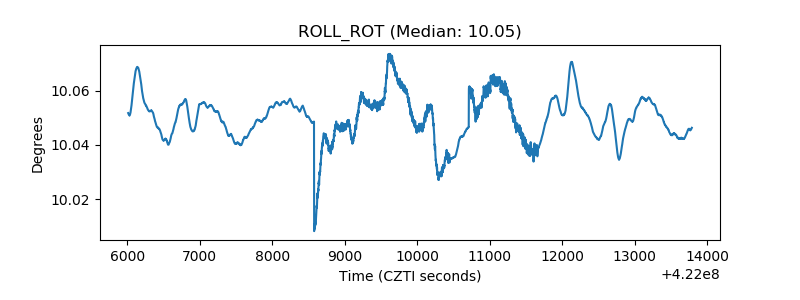 |
| _Roll_DEC | 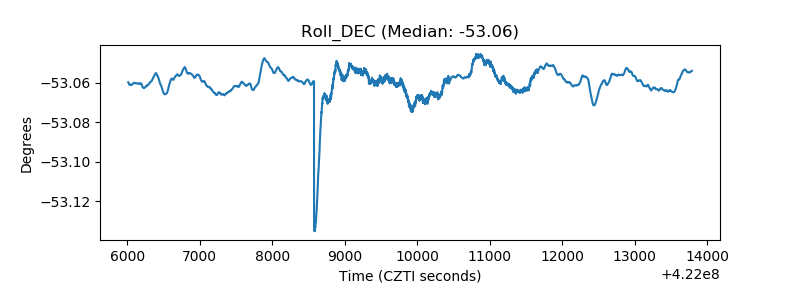 |
| _Roll_RA | 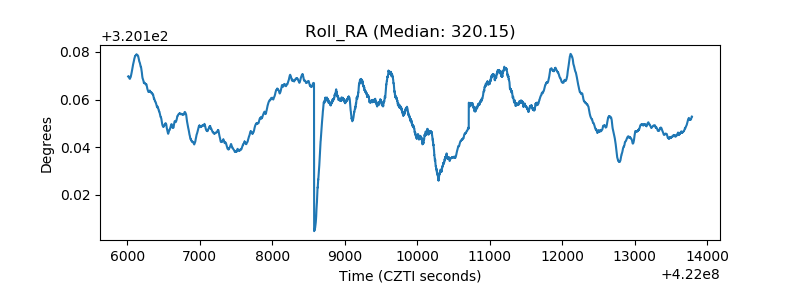 |
| Veto Counter | 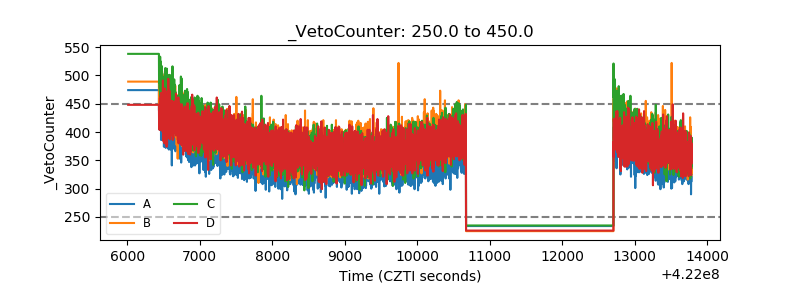 |