| Param | Original file | Final file |
|---|---|---|
| Filename | modeM0/AS1A12_052T04_9000005638_41275cztM0_level2.fits | modeM0/AS1A12_052T04_9000005638_41275cztM0_level2_quad_clean.evt |
| Size (bytes) | 295,032,960 | 87,779,520 |
| Size | 281.4 MB | 83.7 MB |
| Events in quadrant A | 2,749,505 | 583,637 |
| Events in quadrant B | 2,425,381 | 591,887 |
| Events in quadrant C | 2,600,786 | 573,669 |
| Events in quadrant D | 2,730,748 | 536,441 |
| Mode M9 | |||
|---|---|---|---|
| Quadrant | BADHDUFLAG | Total packets | Discarded packets |
| A | 0 | 17 | 0 |
| B | 0 | 17 | 0 |
| C | 0 | 17 | 0 |
| D | 0 | 17 | 0 |
| Mode SS | |||
|---|---|---|---|
| Quadrant | BADHDUFLAG | Total packets | Discarded packets |
| A | 0 | 108 | 0 |
| B | 0 | 108 | 0 |
| C | 0 | 108 | 0 |
| D | 0 | 108 | 0 |
| Mode M0 | |||
|---|---|---|---|
| Quadrant | BADHDUFLAG | Total packets | Discarded packets |
| A | 0 | 11198 | 2 |
| B | 0 | 10887 | 1 |
| C | 0 | 11167 | 1 |
| D | 0 | 11745 | 1 |
| Quadrant | Total seconds | Saturated seconds | Saturation percentage |
|---|---|---|---|
| A | 5319 | 5 | 0.094003% |
| B | 5319 | 9 | 0.169205% |
| C | 5319 | 53 | 0.996428% |
| D | 5319 | 30 | 0.564016% |
Noise dominated data is calculated using 1-second bins in cleaned event files. If a bin has >2000 counts, and if more than 50% of those come from <1% of pixels, then it is considered to be noise-dominated and hence unusable.
| Quadrant | # 1 sec bins | Bins with >0 counts | Bins with >2000 counts | High rate bins dominated by noise | Noise dominated (total time) | Noise dominated (detector-on time) | Marked lightcurve |
|---|---|---|---|---|---|---|---|
| A | 7052 | 5320 | 0 | 0 | 0.00% | 0.00% | 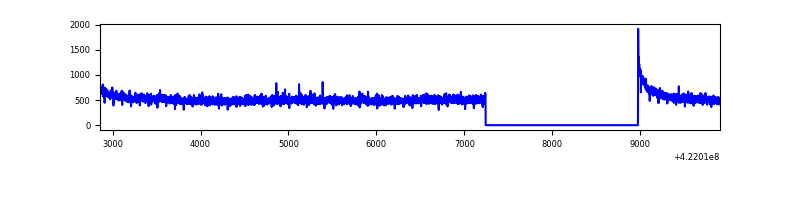 |
| B | 7052 | 5320 | 3 | 3 | 0.04% | 0.06% | 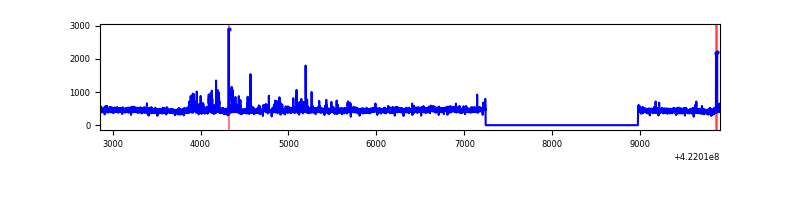 |
| C | 7052 | 5320 | 50 | 50 | 0.71% | 0.94% | 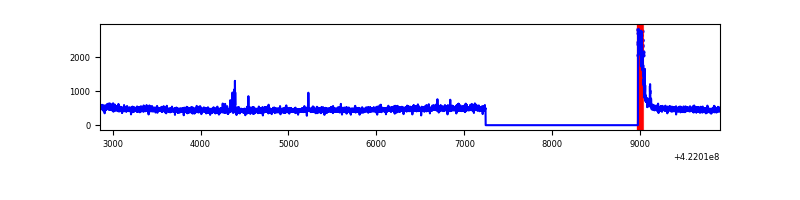 |
| D | 7052 | 5320 | 31 | 31 | 0.44% | 0.58% | 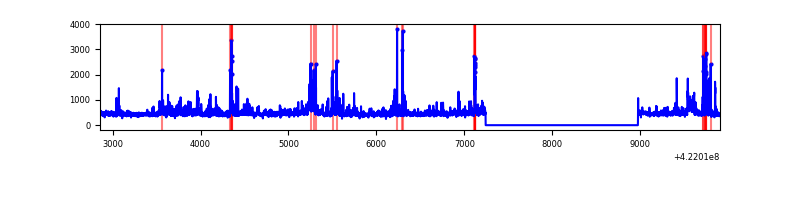 |
Top three noisy pixels from each quadrant. If the there are fewer than three noisy pixels in the level2.evt file, extra rows are filled as -1
| Pixel properties | Quadrant properties | ||||||
|---|---|---|---|---|---|---|---|
| Quadrant | DetID | PixID | Counts | Sigma | Mean | Median | Sigma |
| A | 10 | 83 | 471768 | 3957.29 | 578 | 564 | 119.1 |
| A | 12 | 189 | 25514 | 209.53 | 578 | 564 | 119.1 |
| A | 13 | 6 | 16178 | 131.13 | 578 | 564 | 119.1 |
| B | 0 | 245 | 77486 | 686.68 | 572 | 555 | 112.0 |
| B | 7 | 202 | 55071 | 486.61 | 572 | 555 | 112.0 |
| B | 0 | 186 | 14710 | 126.35 | 572 | 555 | 112.0 |
| C | 15 | 214 | 226459 | 1720.93 | 562 | 565 | 131.3 |
| C | 0 | 10 | 159455 | 1210.48 | 562 | 565 | 131.3 |
| C | 15 | 159 | 13180 | 96.11 | 562 | 565 | 131.3 |
| D | 1 | 52 | 157975 | 1117.33 | 569 | 552 | 140.9 |
| D | 5 | 222 | 84573 | 596.35 | 569 | 552 | 140.9 |
| D | 13 | 249 | 77788 | 548.19 | 569 | 552 | 140.9 |
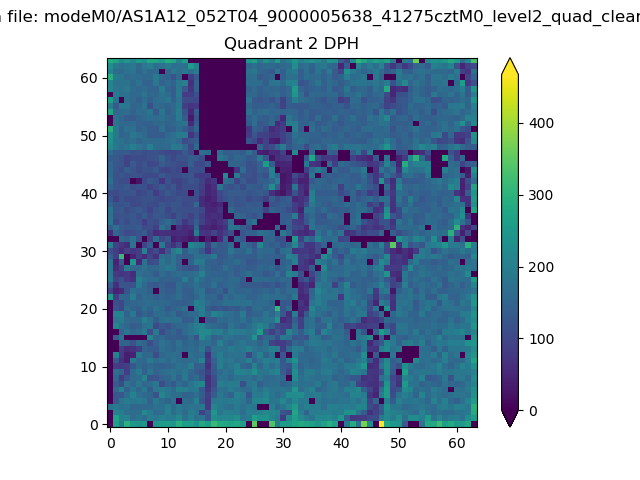
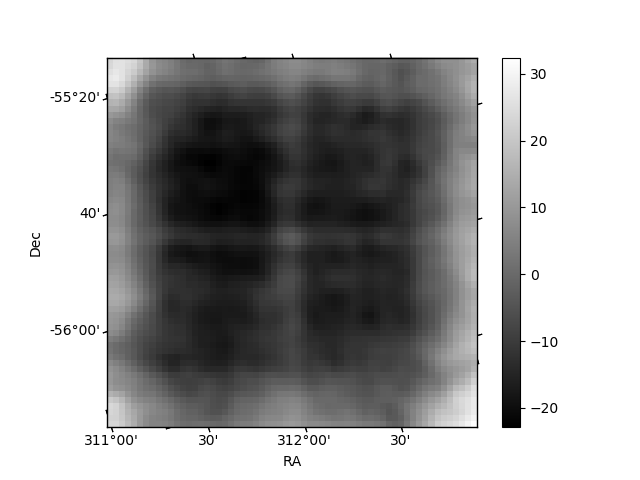
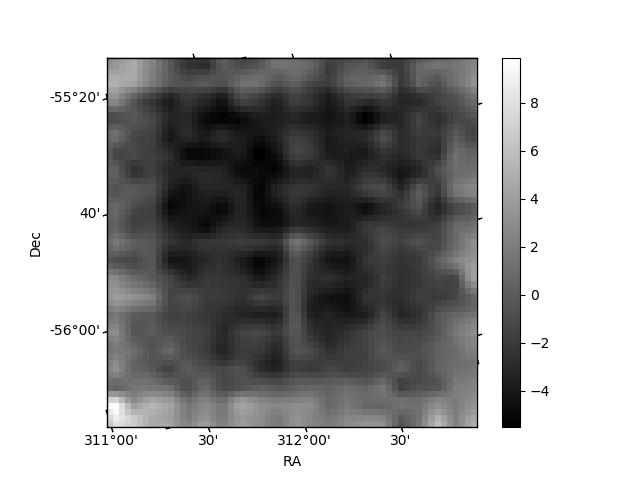
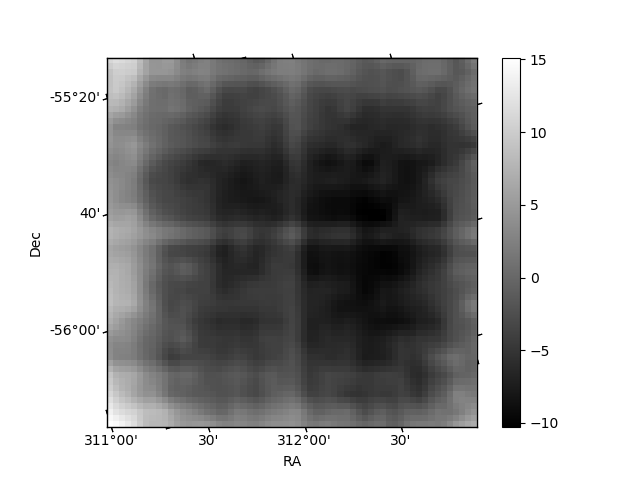
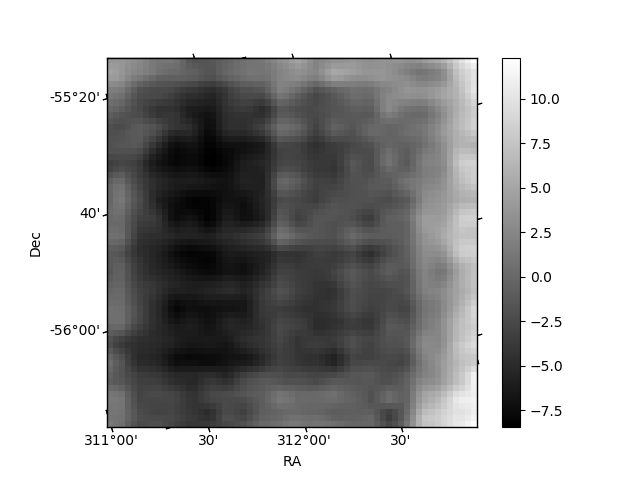
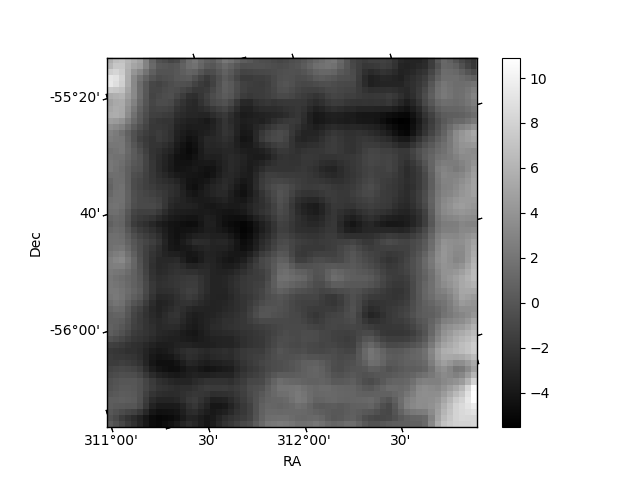
Histogram calculated using DETX and DETY for each event in the final _common_clean file
| Quadrant A | 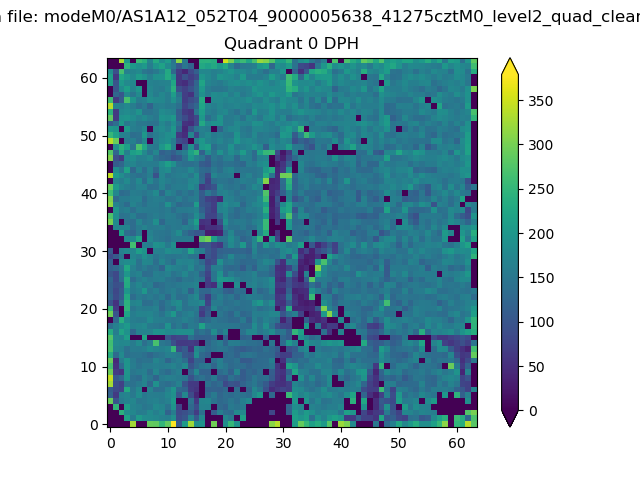 |
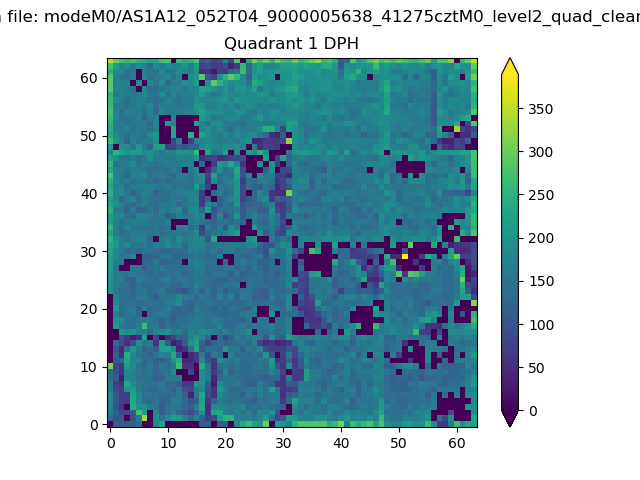 |
Quadrant B |
|---|---|---|---|
| Quadrant D | 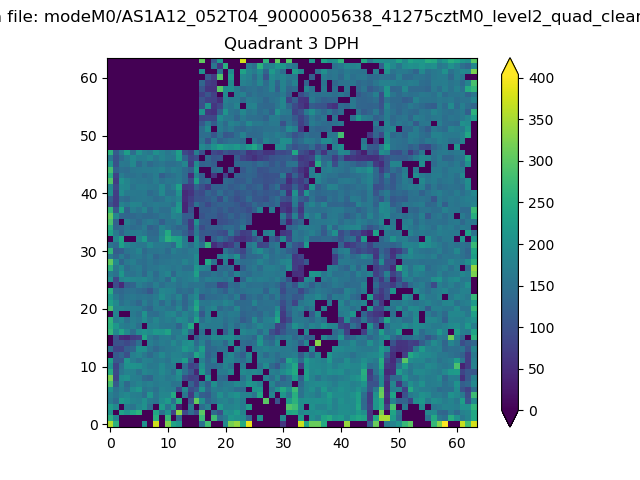 |
 |
Quadrant C |
| Plot type | Count rate plots | Images |
|---|---|---|
| Comparison with Poisson distribution Blue bars denote a histogram of data divided into 1 sec bins. Red curve is a Poisson curve with rate = median count rate of data. |
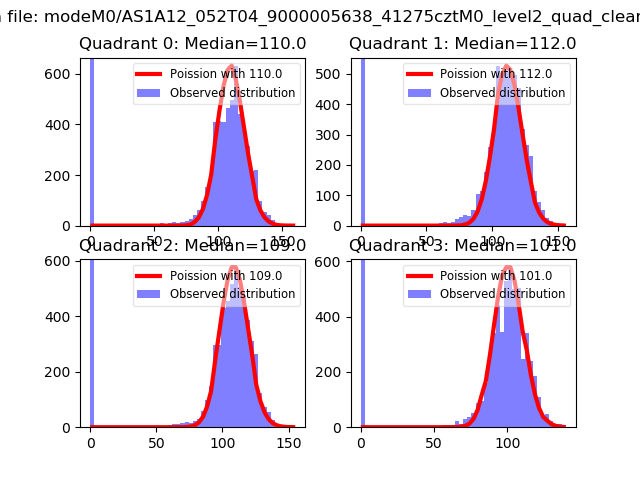 |
 |
| Quadrant-wise count rates Data is divided into 100 sec bins |
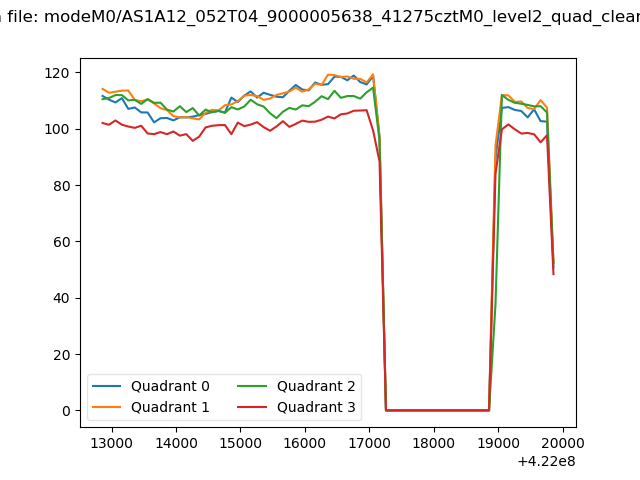 |
|
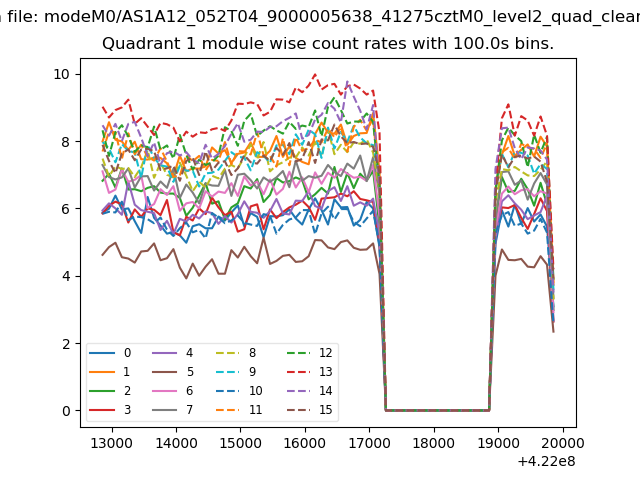
| Module-wise count rates for Quadrant A Data is divided into 100 sec bins |
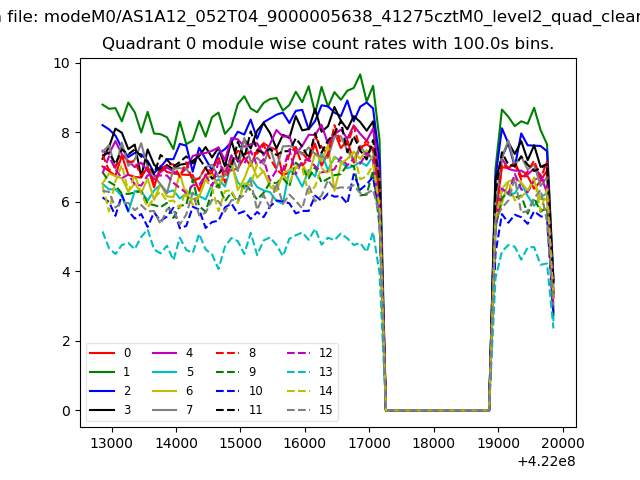 |
 |
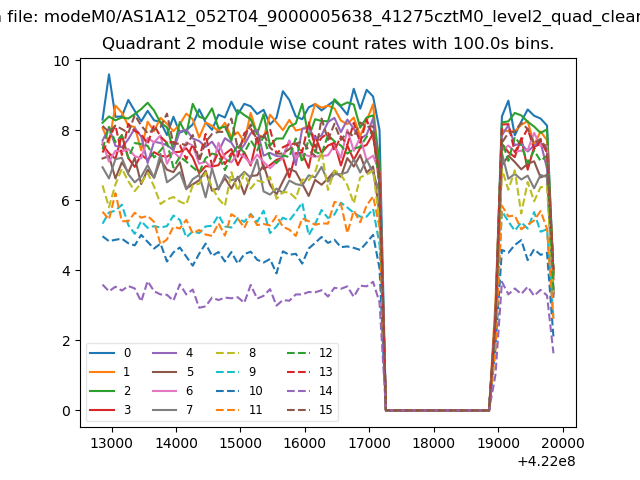
| Module-wise count rates for Quadrant B Data is divided into 100 sec bins |
 |
 |
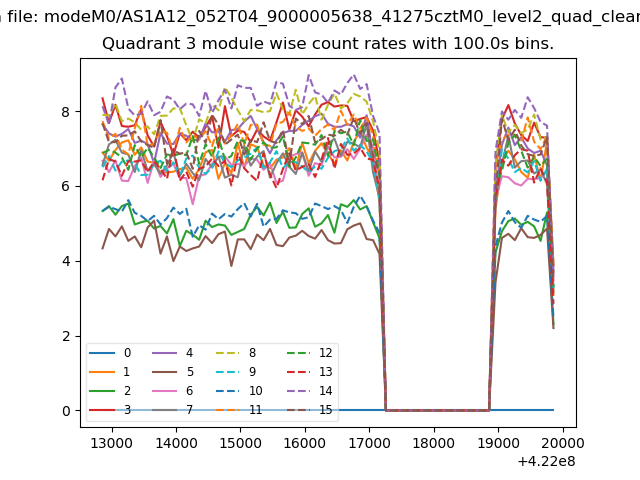
| Module-wise count rates for Quadrant C Data is divided into 100 sec bins |
 |
 |
| Module-wise count rates for Quadrant D Data is divided into 100 sec bins |
 |
 |
| Parameter | Plot |
|---|---|
| CZT HV Monitor | 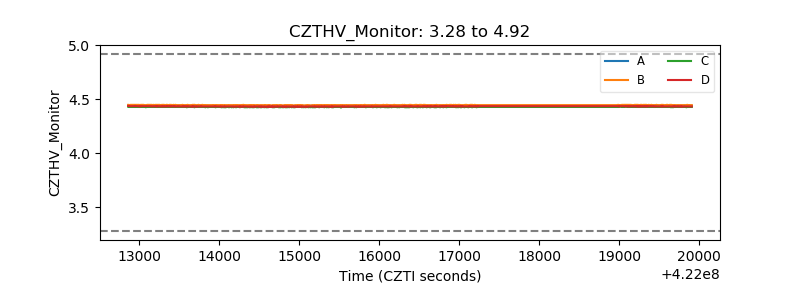 |
| D_VDD | 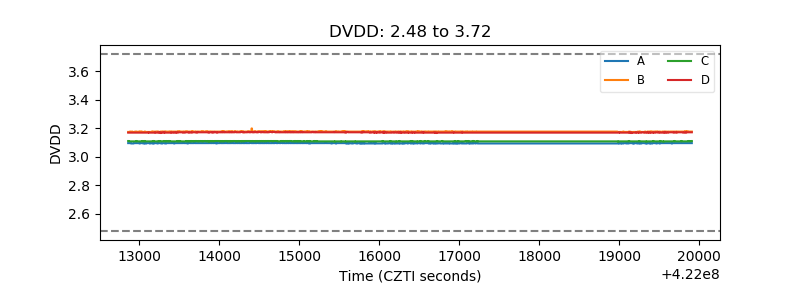 |
| Temperature 1 | 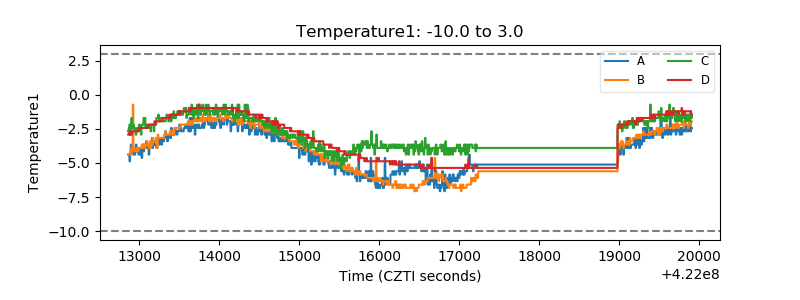 |
| Veto HV Monitor | 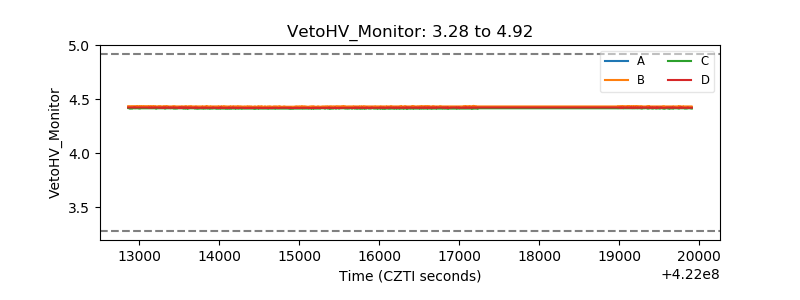 |
| Veto LLD | 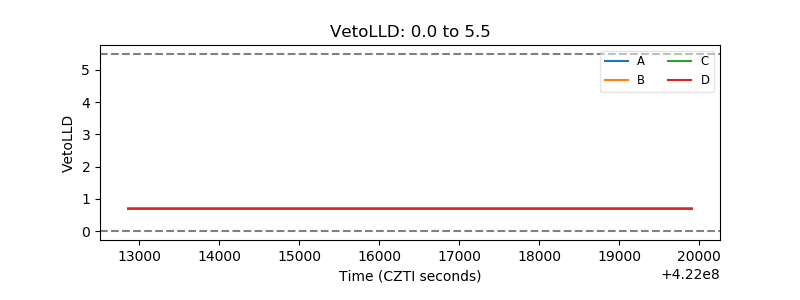 |
| Alpha Counter | 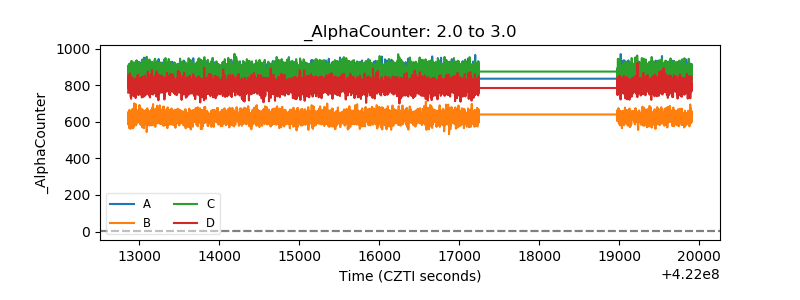 |
| _CPM_Rate | 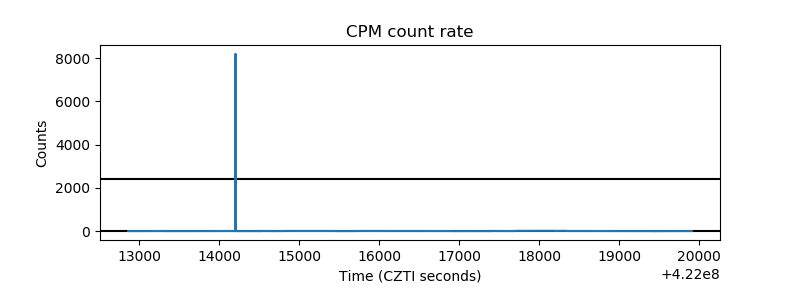 |
| CZT Counter | 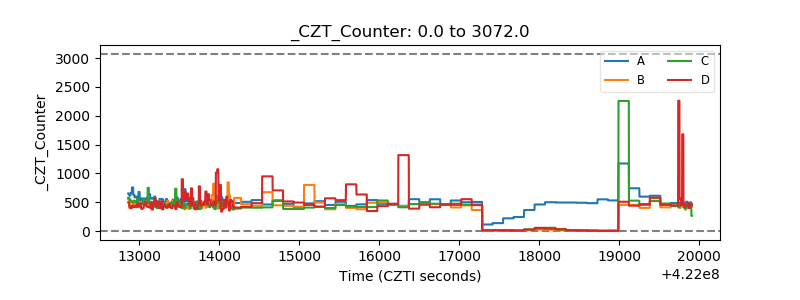 |
| +2.5 Volts monitor |  |
| +5 Volts monitor | 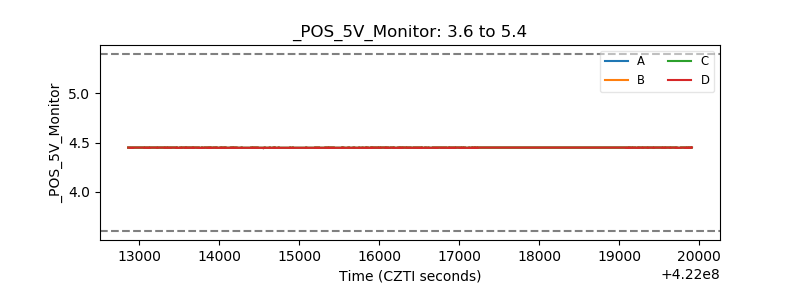 |
| _ROLL_ROT | 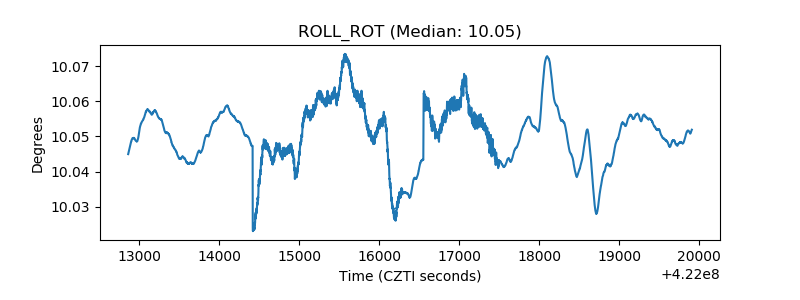 |
| _Roll_DEC | 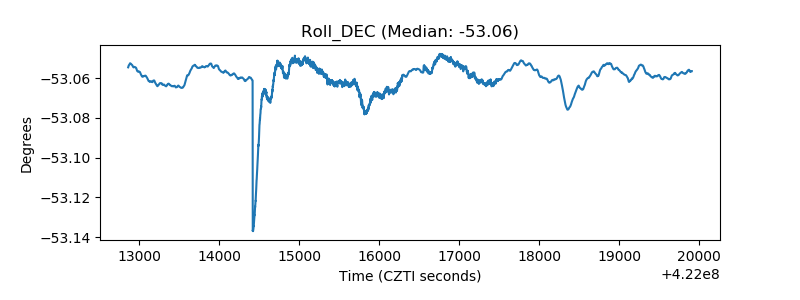 |
| _Roll_RA | 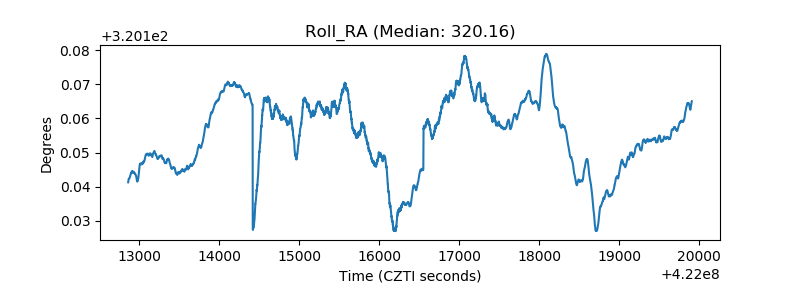 |
| Veto Counter | 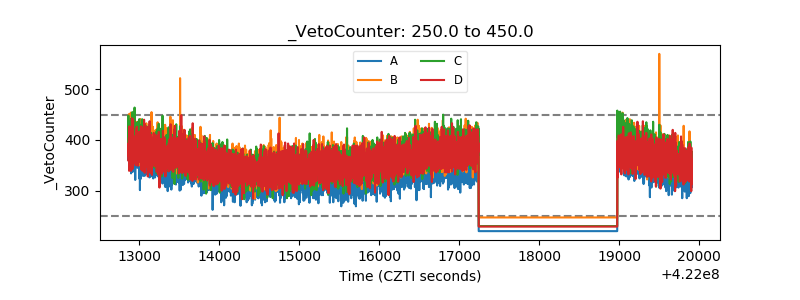 |