| Param | Original file | Final file |
|---|---|---|
| Filename | modeM0/AS1A12_052T04_9000005638_41276cztM0_level2.fits | modeM0/AS1A12_052T04_9000005638_41276cztM0_level2_quad_clean.evt |
| Size (bytes) | 441,106,560 | 88,827,840 |
| Size | 420.7 MB | 84.7 MB |
| Events in quadrant A | 3,160,135 | 632,621 |
| Events in quadrant B | 2,543,562 | 641,927 |
| Events in quadrant C | 6,780,909 | 436,984 |
| Events in quadrant D | 3,390,250 | 570,797 |
| Mode M9 | |||
|---|---|---|---|
| Quadrant | BADHDUFLAG | Total packets | Discarded packets |
| A | 0 | 15 | 0 |
| B | 0 | 15 | 0 |
| C | 0 | 15 | 0 |
| D | 0 | 16 | 0 |
| Mode SS | |||
|---|---|---|---|
| Quadrant | BADHDUFLAG | Total packets | Discarded packets |
| A | 0 | 120 | 0 |
| B | 0 | 120 | 0 |
| C | 0 | 120 | 0 |
| D | 0 | 120 | 0 |
| Mode M0 | |||
|---|---|---|---|
| Quadrant | BADHDUFLAG | Total packets | Discarded packets |
| A | 0 | 12841 | 3 |
| B | 0 | 11753 | 2 |
| C | 0 | 24080 | 2 |
| D | 0 | 14126 | 2 |
| Quadrant | Total seconds | Saturated seconds | Saturation percentage |
|---|---|---|---|
| A | 5822 | 32 | 0.549639% |
| B | 5822 | 15 | 0.257643% |
| C | 5822 | 1746 | 29.989694% |
| D | 5822 | 144 | 2.473377% |
Noise dominated data is calculated using 1-second bins in cleaned event files. If a bin has >2000 counts, and if more than 50% of those come from <1% of pixels, then it is considered to be noise-dominated and hence unusable.
| Quadrant | # 1 sec bins | Bins with >0 counts | Bins with >2000 counts | High rate bins dominated by noise | Noise dominated (total time) | Noise dominated (detector-on time) | Marked lightcurve |
|---|---|---|---|---|---|---|---|
| A | 7254 | 5823 | 25 | 25 | 0.34% | 0.43% | 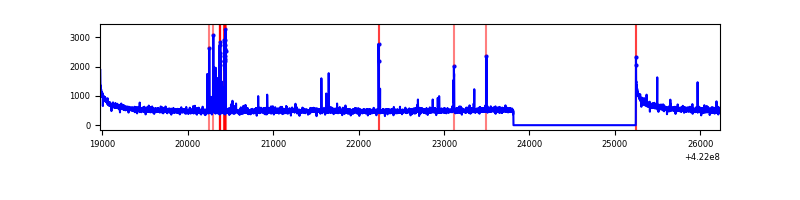 |
| B | 7254 | 5823 | 5 | 5 | 0.07% | 0.09% | 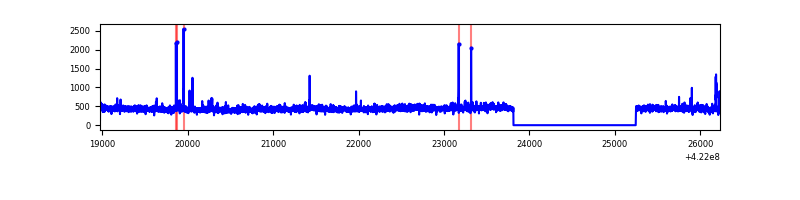 |
| C | 7254 | 5823 | 1715 | 1715 | 23.64% | 29.45% | 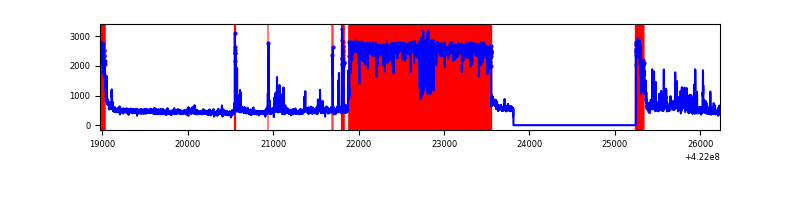 |
| D | 7254 | 5823 | 149 | 149 | 2.05% | 2.56% | 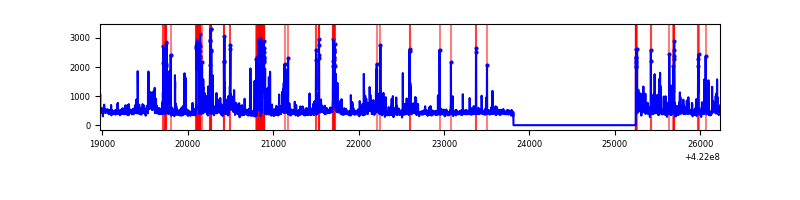 |
Top three noisy pixels from each quadrant. If the there are fewer than three noisy pixels in the level2.evt file, extra rows are filled as -1
| Pixel properties | Quadrant properties | ||||||
|---|---|---|---|---|---|---|---|
| Quadrant | DetID | PixID | Counts | Sigma | Mean | Median | Sigma |
| A | 10 | 83 | 551612 | 4270.96 | 629 | 615 | 129.0 |
| A | 6 | 10 | 149390 | 1153.21 | 629 | 615 | 129.0 |
| A | 12 | 189 | 18516 | 138.76 | 629 | 615 | 129.0 |
| B | 0 | 245 | 34228 | 275.16 | 623 | 604 | 122.2 |
| B | 5 | 255 | 20957 | 166.56 | 623 | 604 | 122.2 |
| B | 7 | 202 | 20201 | 160.37 | 623 | 604 | 122.2 |
| C | 9 | 54 | 4410506 | 40633.72 | 465 | 468 | 108.5 |
| C | 0 | 10 | 350287 | 3223.2 | 465 | 468 | 108.5 |
| C | 15 | 214 | 194471 | 1787.53 | 465 | 468 | 108.5 |
| D | 12 | 233 | 437495 | 2920.03 | 611 | 593 | 149.6 |
| D | 1 | 47 | 200492 | 1336.02 | 611 | 593 | 149.6 |
| D | 1 | 52 | 174649 | 1163.3 | 611 | 593 | 149.6 |
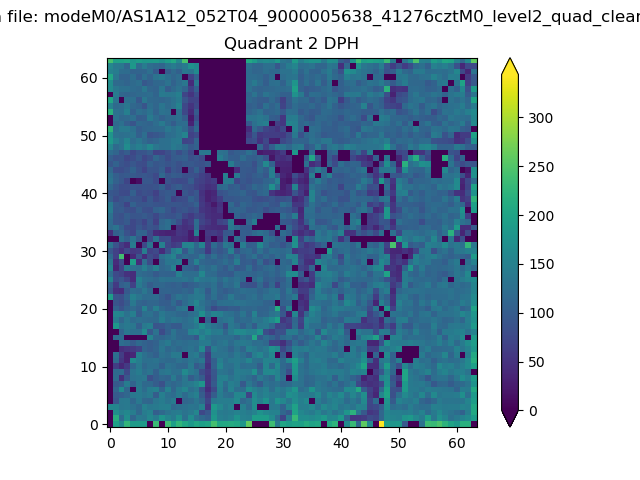
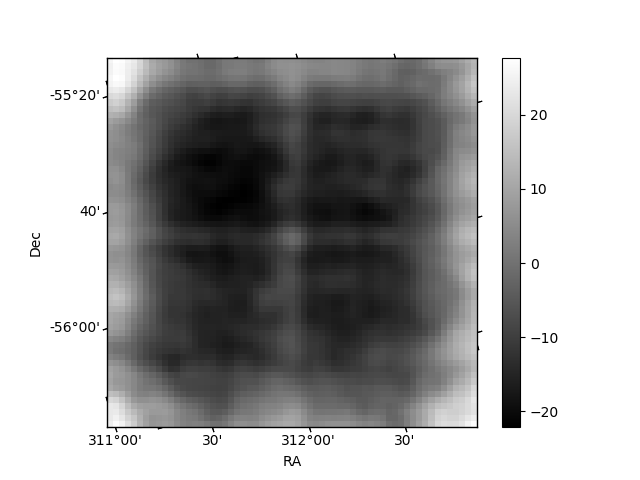
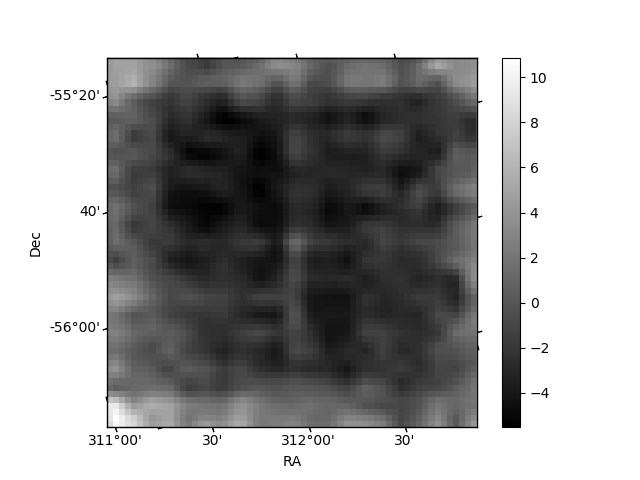
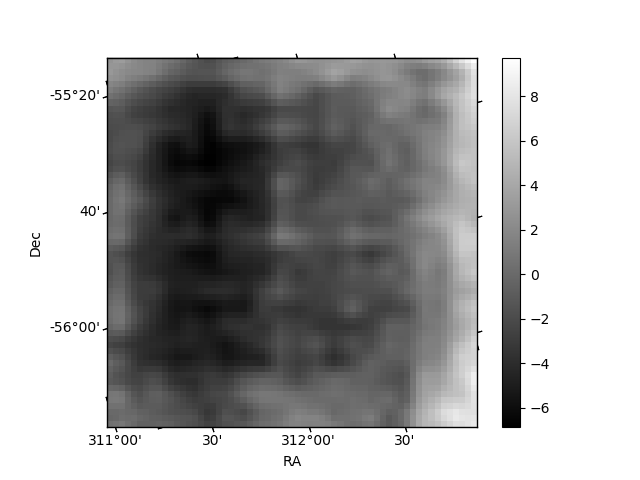
Histogram calculated using DETX and DETY for each event in the final _common_clean file
| Quadrant A | 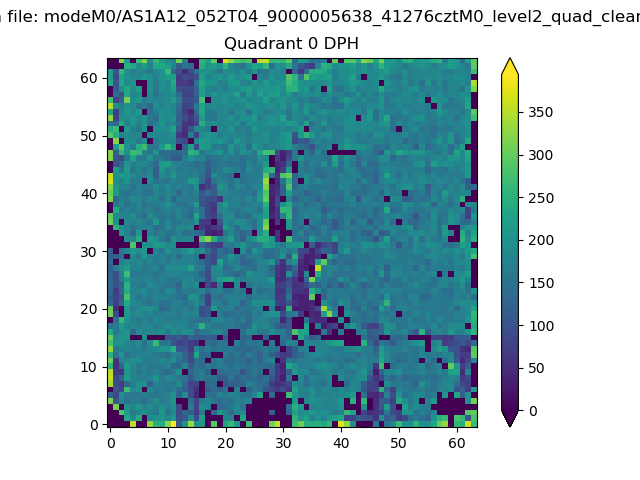 |
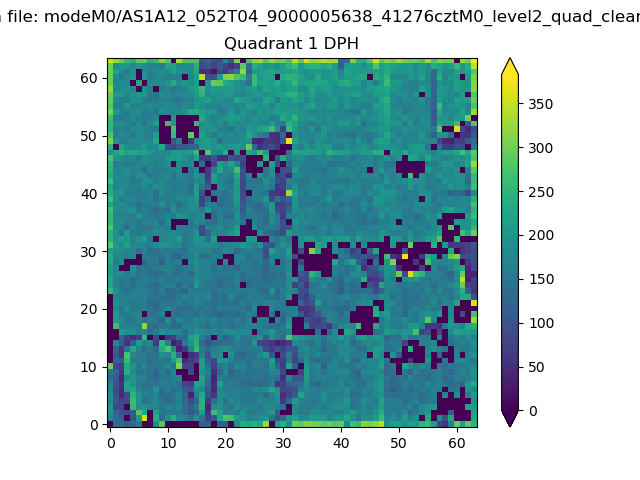 |
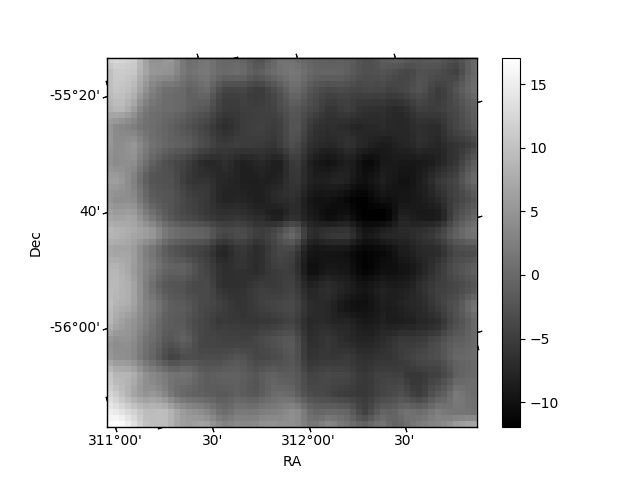
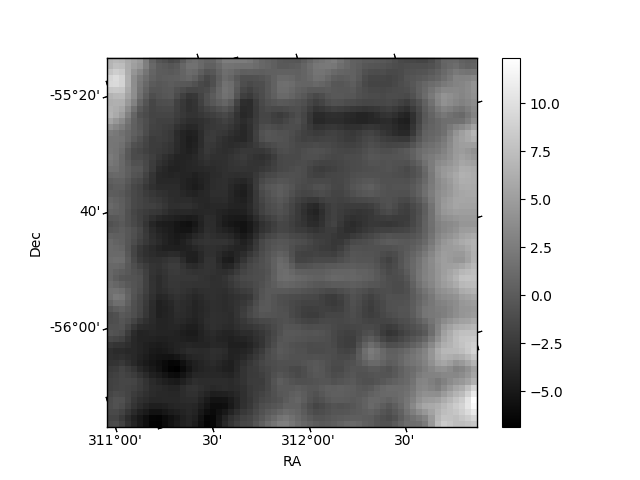
Quadrant B |
|---|---|---|---|
| Quadrant D | 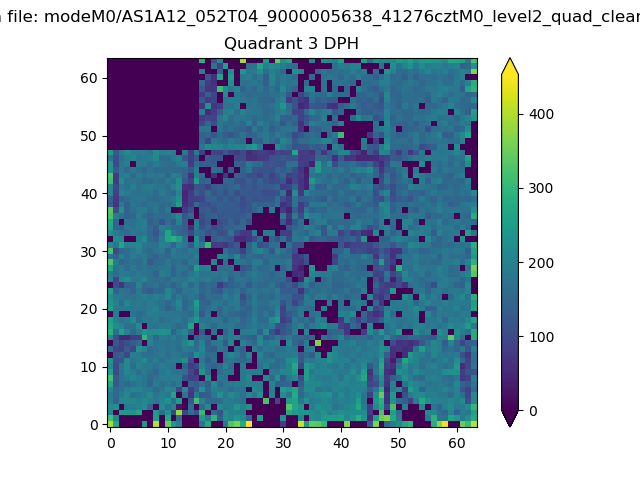 |
 |
Quadrant C |
| Plot type | Count rate plots | Images |
|---|---|---|
| Comparison with Poisson distribution Blue bars denote a histogram of data divided into 1 sec bins. Red curve is a Poisson curve with rate = median count rate of data. |
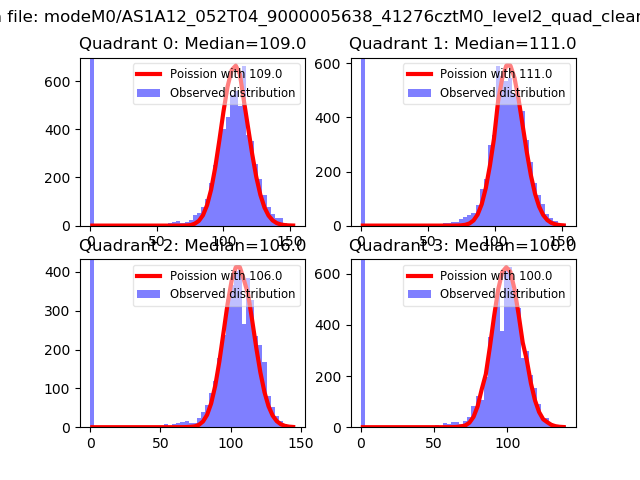 |
 |
| Quadrant-wise count rates Data is divided into 100 sec bins |
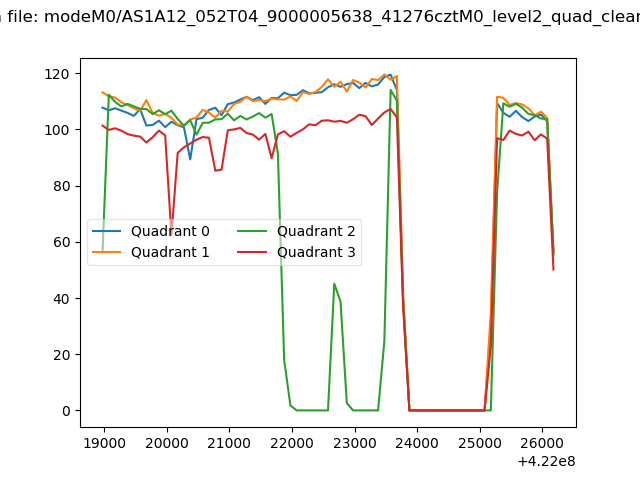 |
|
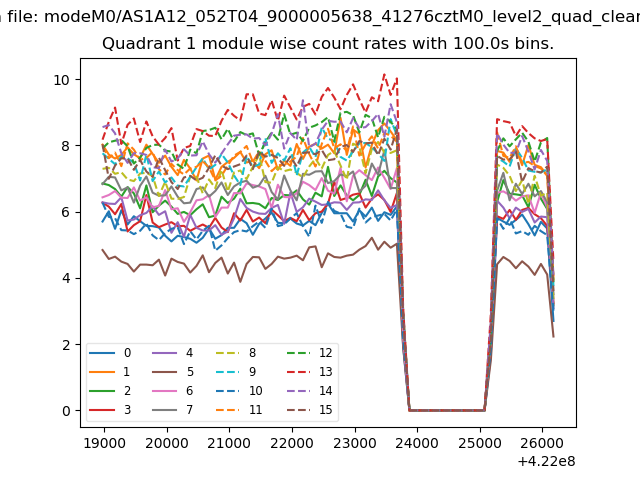
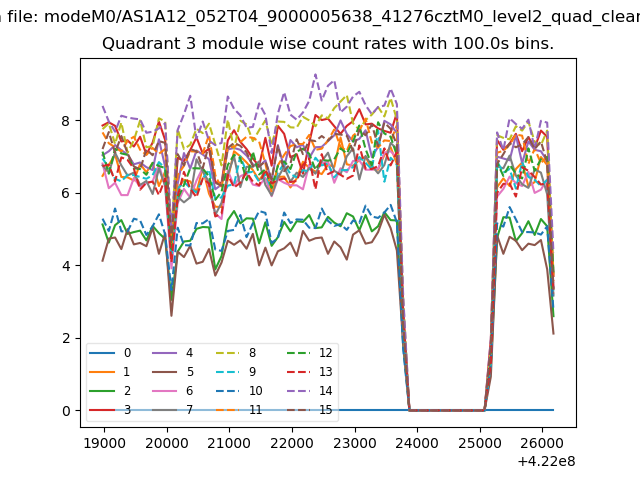
| Module-wise count rates for Quadrant A Data is divided into 100 sec bins |
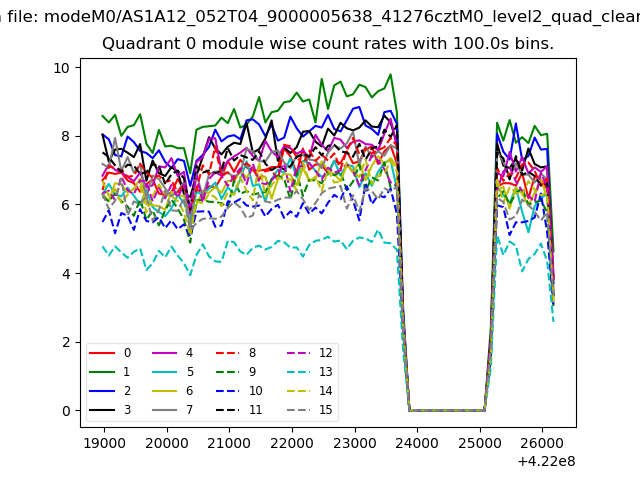 |
 |
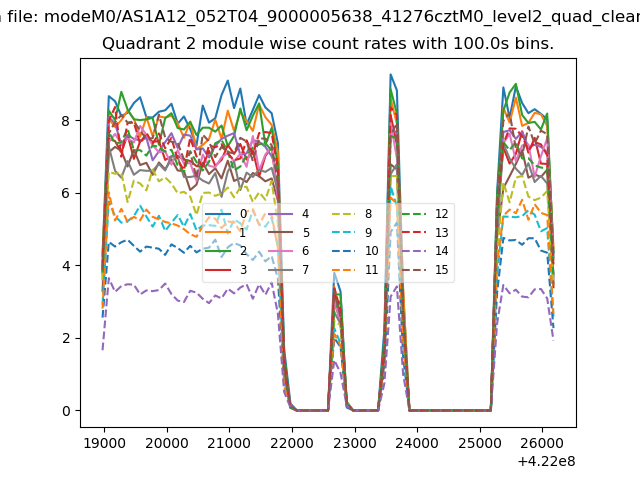
| Module-wise count rates for Quadrant B Data is divided into 100 sec bins |
 |
 |
| Module-wise count rates for Quadrant C Data is divided into 100 sec bins |
 |
 |
| Module-wise count rates for Quadrant D Data is divided into 100 sec bins |
 |
 |
| Parameter | Plot |
|---|---|
| CZT HV Monitor | 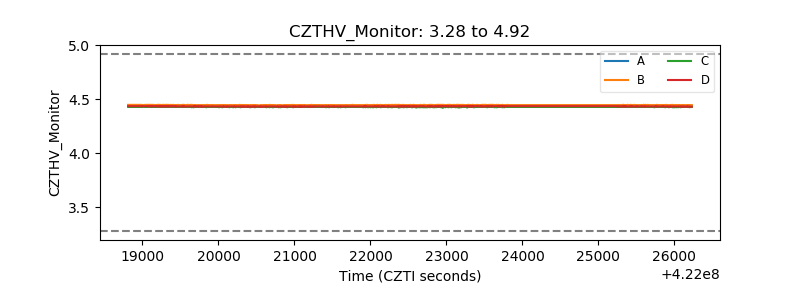 |
| D_VDD | 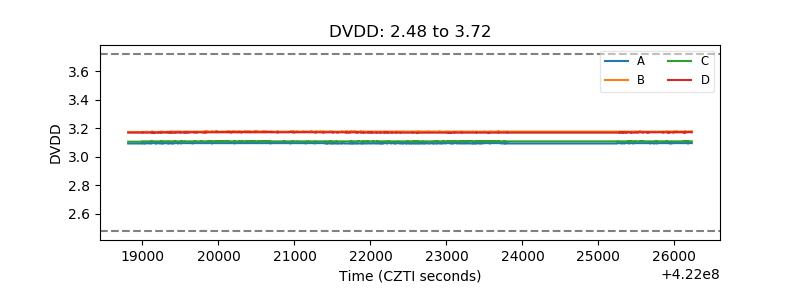 |
| Temperature 1 | 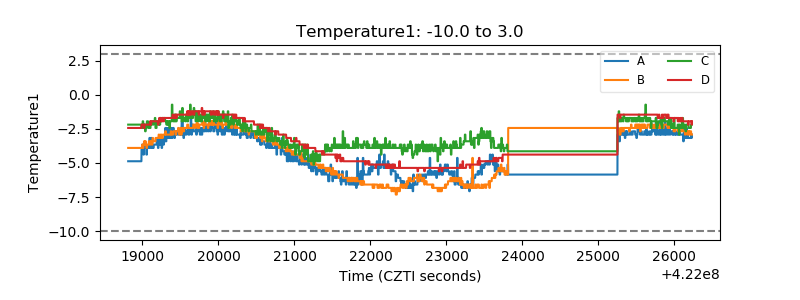 |
| Veto HV Monitor | 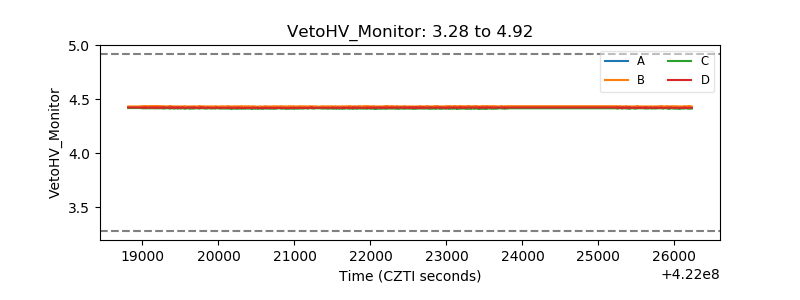 |
| Veto LLD | 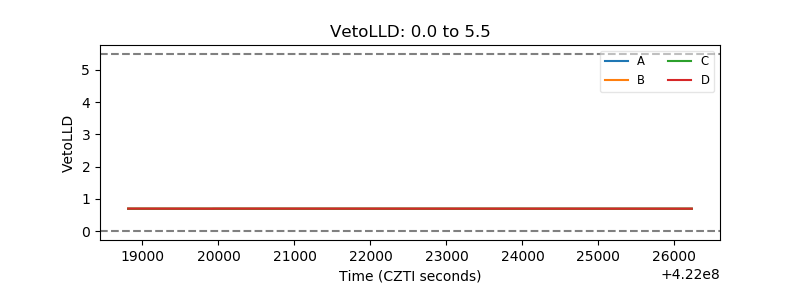 |
| Alpha Counter | 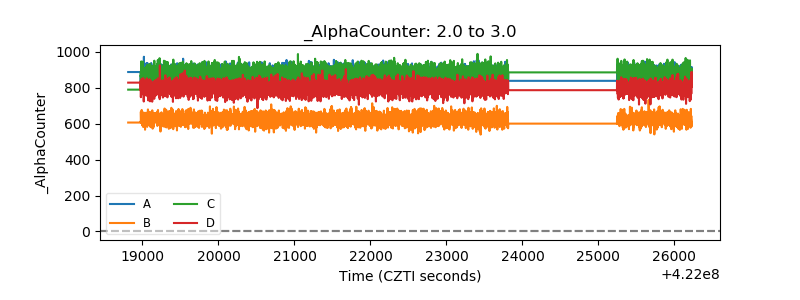 |
| _CPM_Rate | 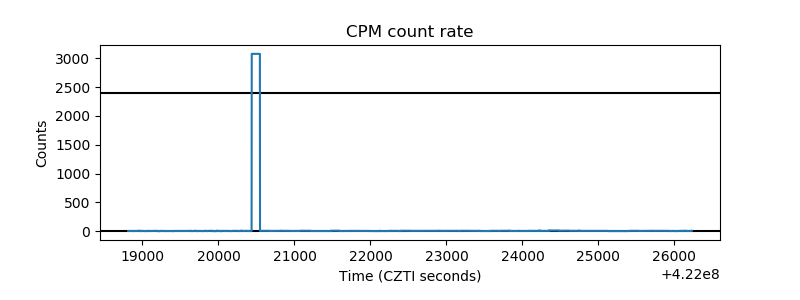 |
| CZT Counter | 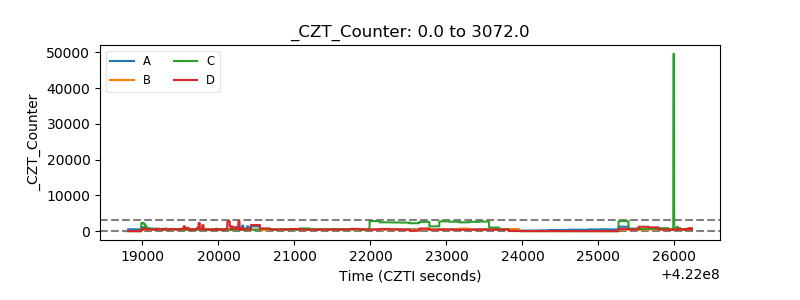 |
| +2.5 Volts monitor | 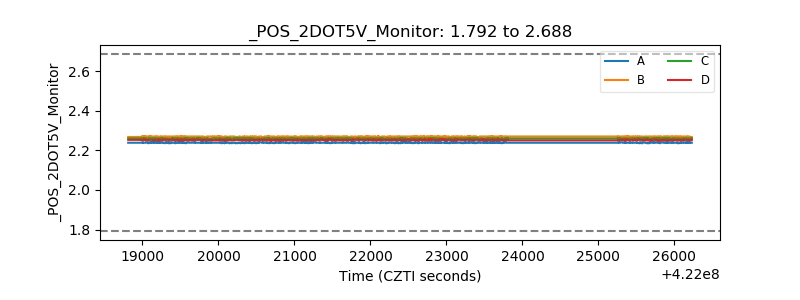 |
| +5 Volts monitor | 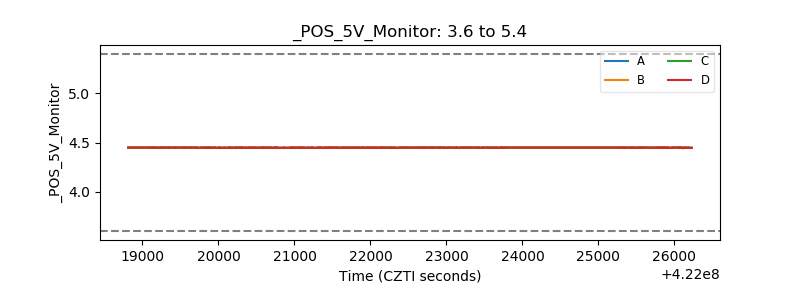 |
| _ROLL_ROT | 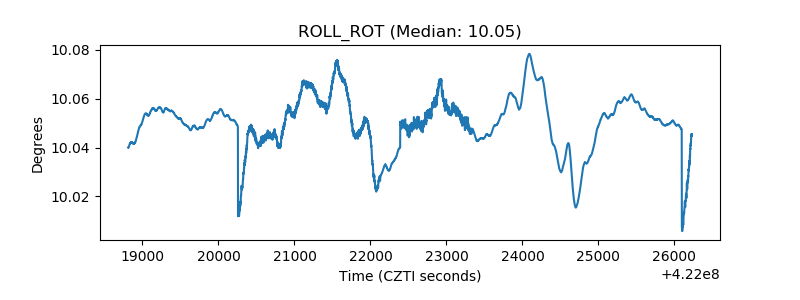 |
| _Roll_DEC | 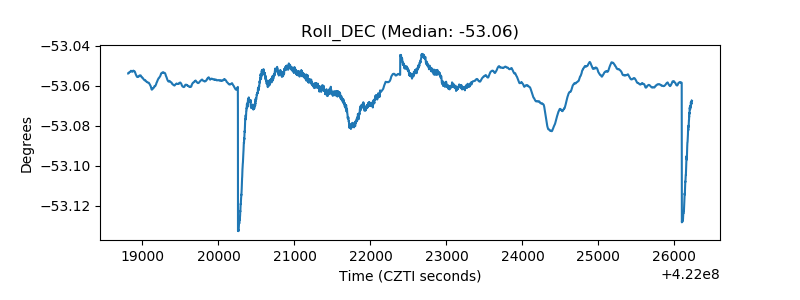 |
| _Roll_RA | 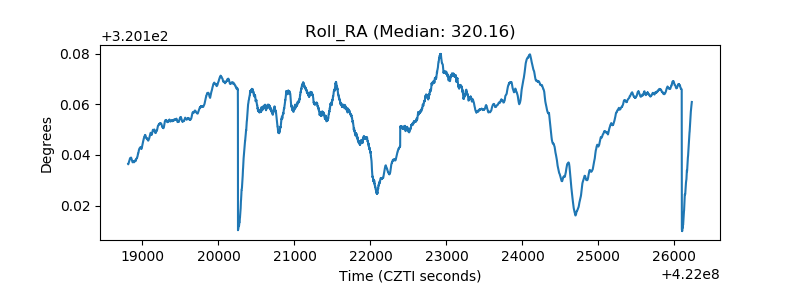 |
| Veto Counter | 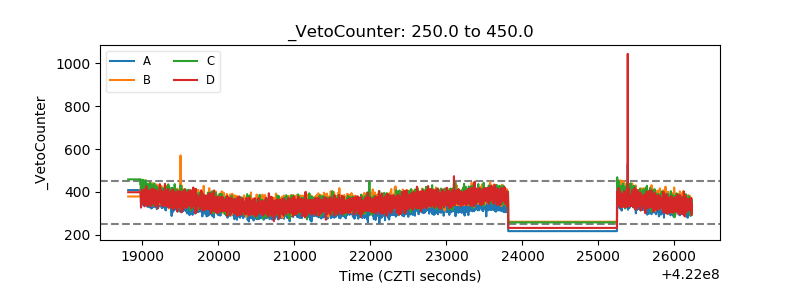 |