| Param | Original file | Final file |
|---|---|---|
| Filename | modeM0/AS1A12_052T04_9000005638_41280cztM0_level2.fits | modeM0/AS1A12_052T04_9000005638_41280cztM0_level2_quad_clean.evt |
| Size (bytes) | 1,011,202,560 | 244,895,040 |
| Size | 964.4 MB | 233.6 MB |
| Events in quadrant A | 7,982,502 | 1,681,958 |
| Events in quadrant B | 6,801,596 | 1,699,889 |
| Events in quadrant C | 8,253,042 | 1,613,287 |
| Events in quadrant D | 13,182,918 | 1,341,667 |
| Mode M9 | |||
|---|---|---|---|
| Quadrant | BADHDUFLAG | Total packets | Discarded packets |
| A | 0 | 48 | 0 |
| B | 0 | 48 | 0 |
| C | 0 | 48 | 0 |
| D | 0 | 49 | 0 |
| Mode SS | |||
|---|---|---|---|
| Quadrant | BADHDUFLAG | Total packets | Discarded packets |
| A | 0 | 316 | 0 |
| B | 0 | 316 | 0 |
| C | 0 | 316 | 0 |
| D | 0 | 316 | 0 |
| Mode M0 | |||
|---|---|---|---|
| Quadrant | BADHDUFLAG | Total packets | Discarded packets |
| A | 0 | 33280 | 5 |
| B | 0 | 31613 | 4 |
| C | 0 | 34480 | 4 |
| D | 0 | 50037 | 4 |
| Quadrant | Total seconds | Saturated seconds | Saturation percentage |
|---|---|---|---|
| A | 15633 | 31 | 0.198298% |
| B | 15633 | 26 | 0.166315% |
| C | 15633 | 408 | 2.609864% |
| D | 15633 | 1816 | 11.616452% |
Noise dominated data is calculated using 1-second bins in cleaned event files. If a bin has >2000 counts, and if more than 50% of those come from <1% of pixels, then it is considered to be noise-dominated and hence unusable.
| Quadrant | # 1 sec bins | Bins with >0 counts | Bins with >2000 counts | High rate bins dominated by noise | Noise dominated (total time) | Noise dominated (detector-on time) | Marked lightcurve |
|---|---|---|---|---|---|---|---|
| A | 19782 | 15636 | 13 | 13 | 0.07% | 0.08% | 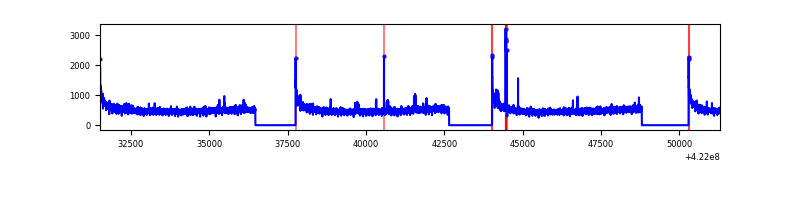 |
| B | 19782 | 15636 | 12 | 12 | 0.06% | 0.08% | 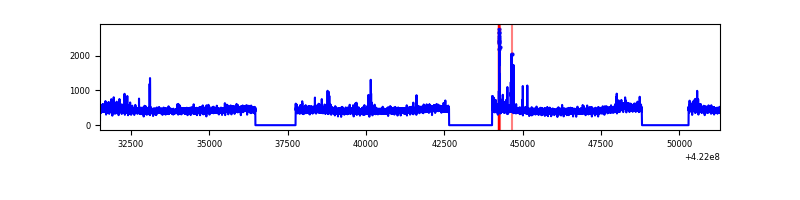 |
| C | 19782 | 15636 | 394 | 394 | 1.99% | 2.52% | 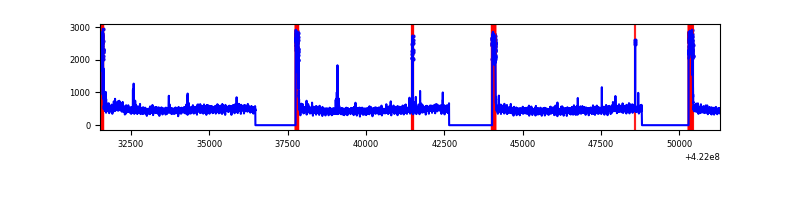 |
| D | 19782 | 15636 | 1912 | 1912 | 9.67% | 12.23% | 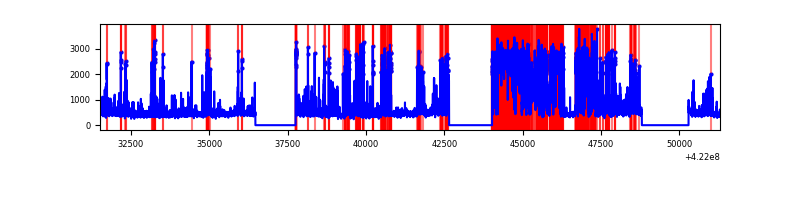 |
Top three noisy pixels from each quadrant. If the there are fewer than three noisy pixels in the level2.evt file, extra rows are filled as -1
| Pixel properties | Quadrant properties | ||||||
|---|---|---|---|---|---|---|---|
| Quadrant | DetID | PixID | Counts | Sigma | Mean | Median | Sigma |
| A | 10 | 83 | 1299992 | 3774.63 | 1695 | 1661 | 344.0 |
| A | 12 | 189 | 76297 | 216.99 | 1695 | 1661 | 344.0 |
| A | 6 | 10 | 25307 | 68.75 | 1695 | 1661 | 344.0 |
| B | 0 | 245 | 72648 | 220.06 | 1678 | 1631 | 322.7 |
| B | 5 | 255 | 47322 | 141.58 | 1678 | 1631 | 322.7 |
| B | 12 | 111 | 42306 | 126.04 | 1678 | 1631 | 322.7 |
| C | 0 | 10 | 1024678 | 2705.86 | 1636 | 1642 | 378.1 |
| C | 15 | 214 | 650193 | 1715.37 | 1636 | 1642 | 378.1 |
| C | 9 | 54 | 174183 | 456.36 | 1636 | 1642 | 378.1 |
| D | 1 | 52 | 5218110 | 13465.43 | 1582 | 1537 | 387.4 |
| D | 1 | 47 | 768366 | 1979.4 | 1582 | 1537 | 387.4 |
| D | 13 | 249 | 669246 | 1723.54 | 1582 | 1537 | 387.4 |
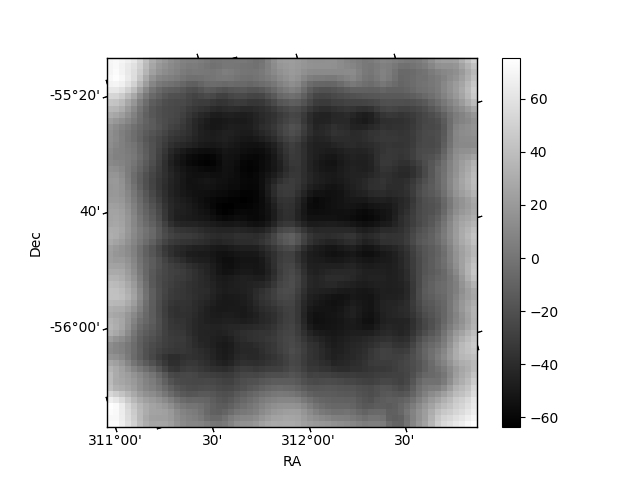
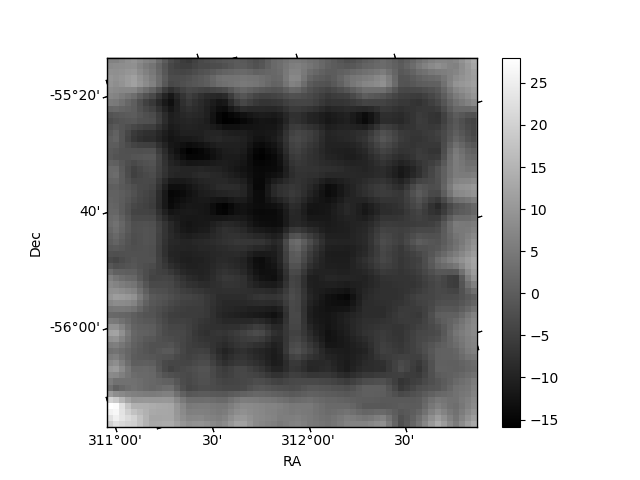
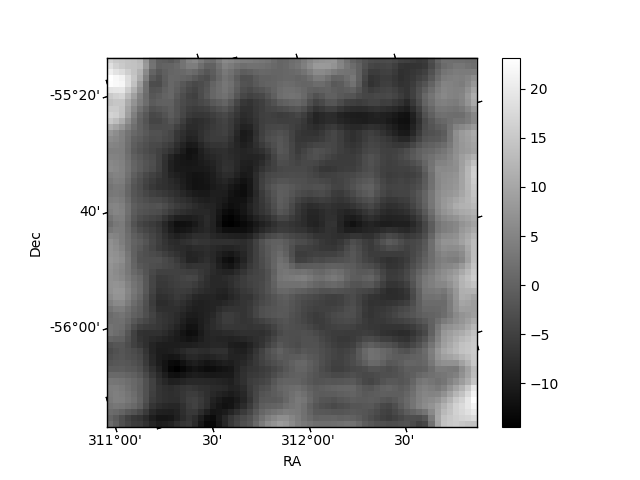
Histogram calculated using DETX and DETY for each event in the final _common_clean file
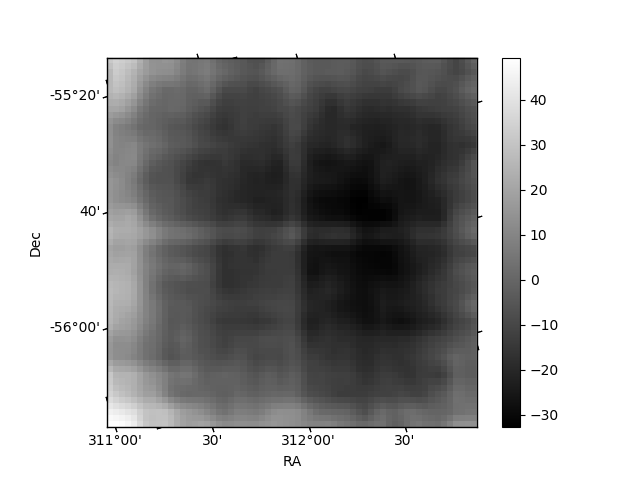
| Quadrant A | 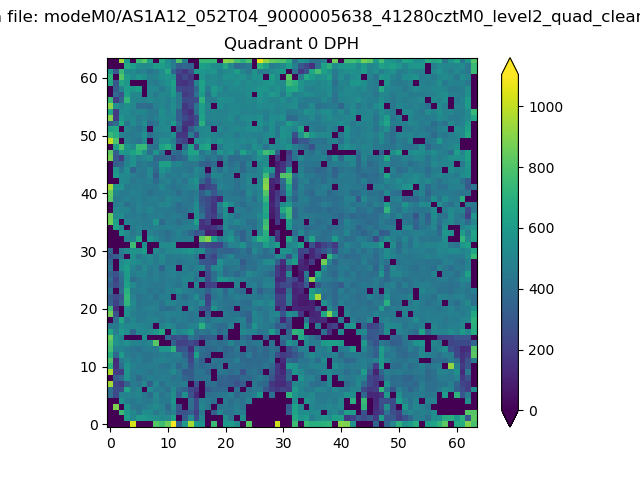 |
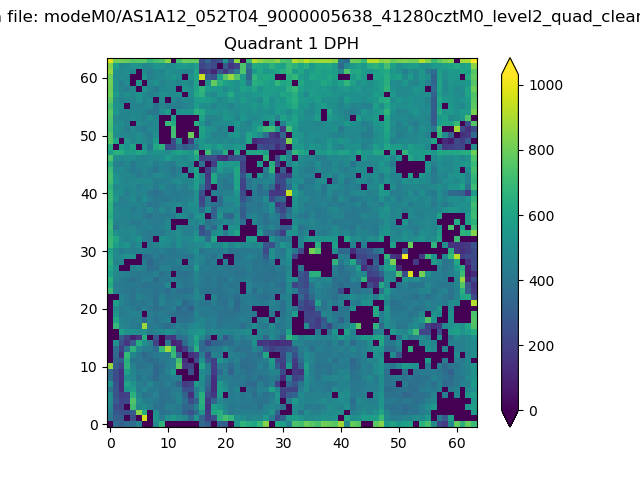 |
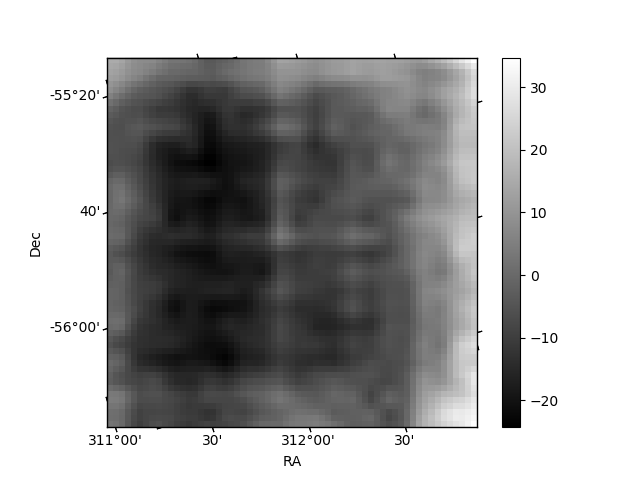
Quadrant B |
|---|---|---|---|
| Quadrant D | 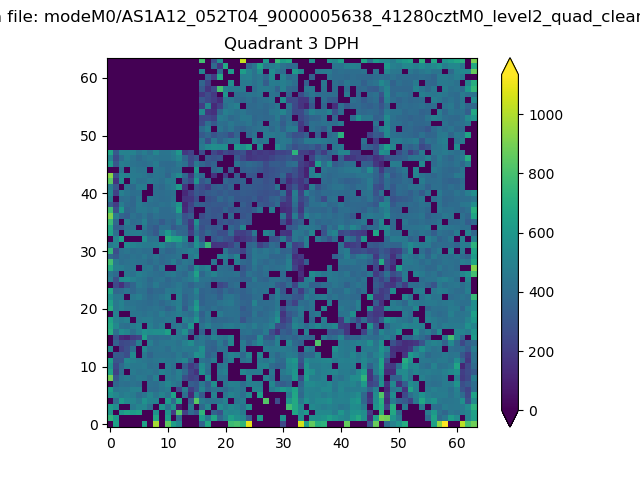 |
 |
Quadrant C |
| Plot type | Count rate plots | Images |
|---|---|---|
| Comparison with Poisson distribution Blue bars denote a histogram of data divided into 1 sec bins. Red curve is a Poisson curve with rate = median count rate of data. |
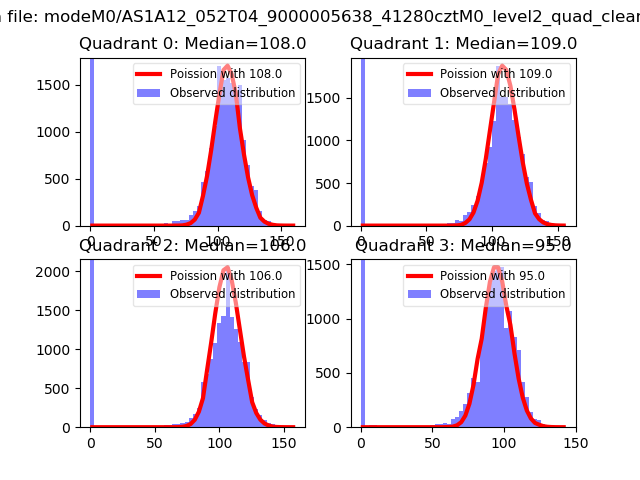 |
 |
| Quadrant-wise count rates Data is divided into 100 sec bins |
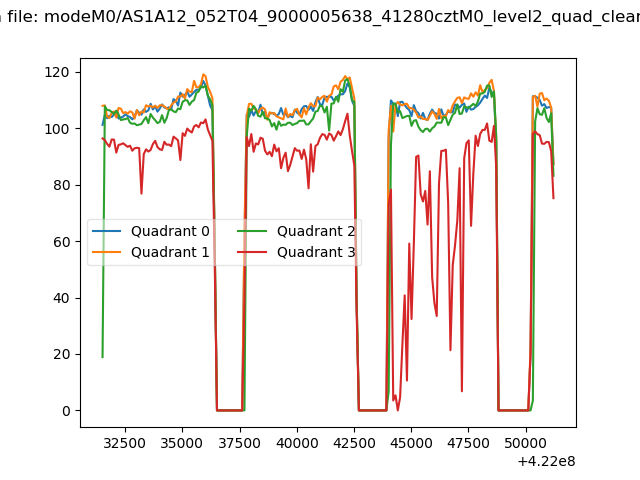 |
|
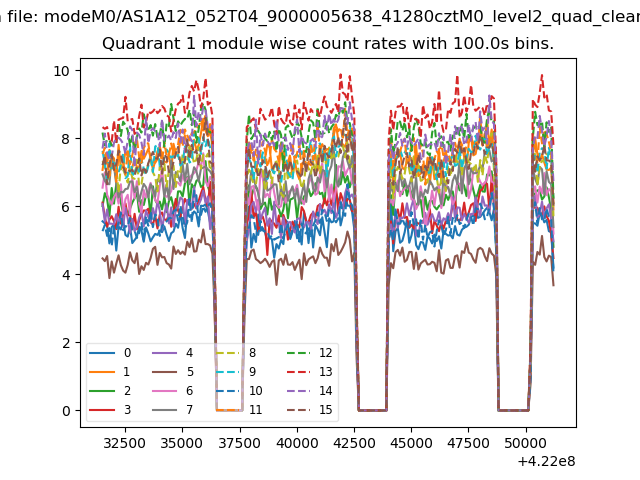
| Module-wise count rates for Quadrant A Data is divided into 100 sec bins |
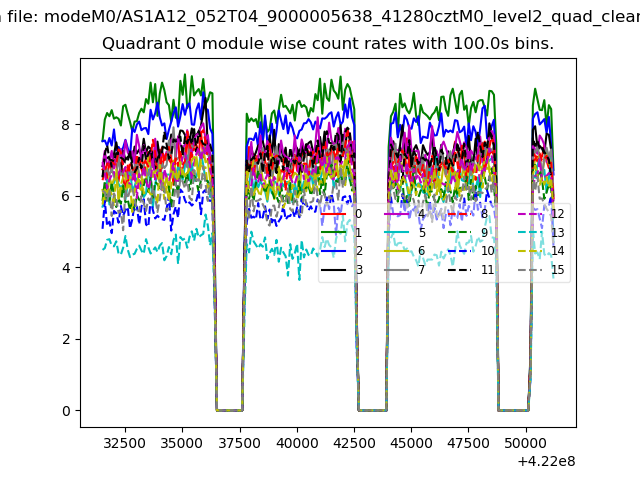 |
 |
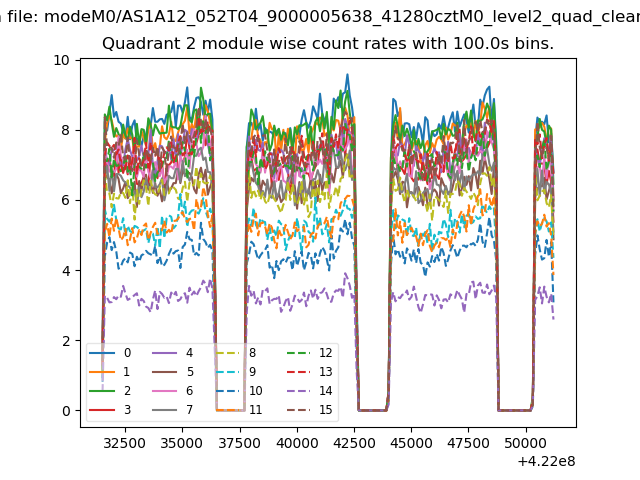
| Module-wise count rates for Quadrant B Data is divided into 100 sec bins |
 |
 |
| Module-wise count rates for Quadrant C Data is divided into 100 sec bins |
 |
 |
| Module-wise count rates for Quadrant D Data is divided into 100 sec bins |
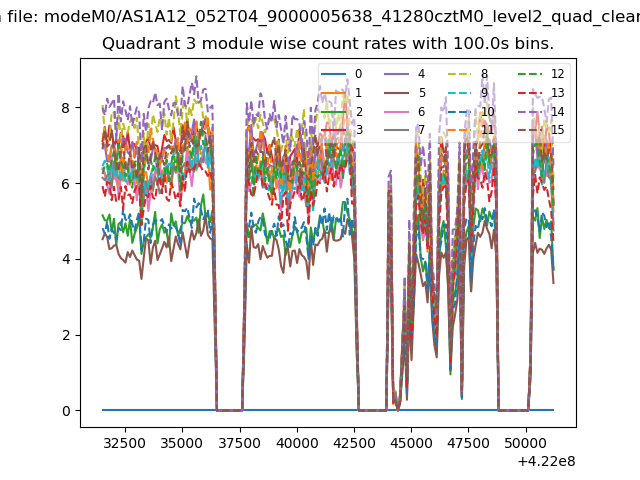 |
 |
| Parameter | Plot |
|---|---|
| CZT HV Monitor | 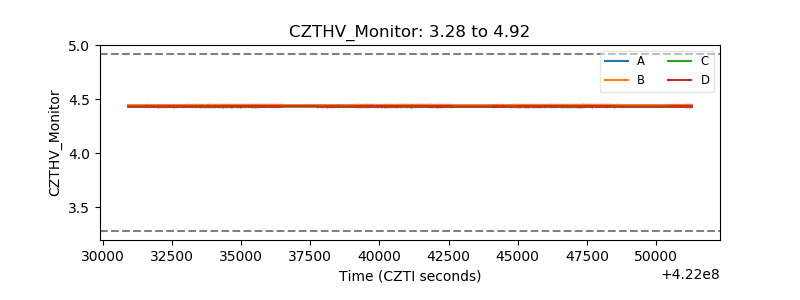 |
| D_VDD | 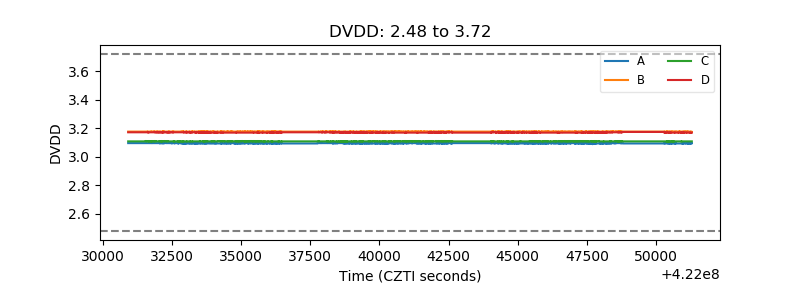 |
| Temperature 1 | 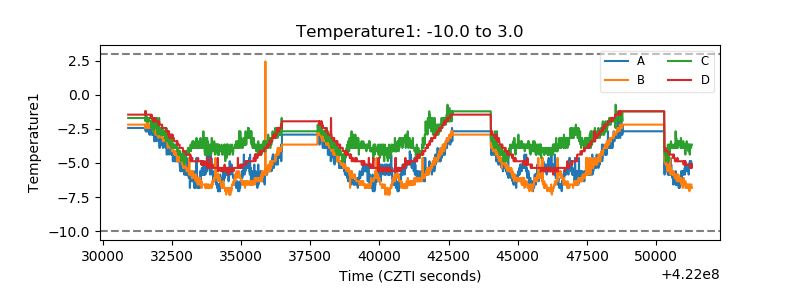 |
| Veto HV Monitor | 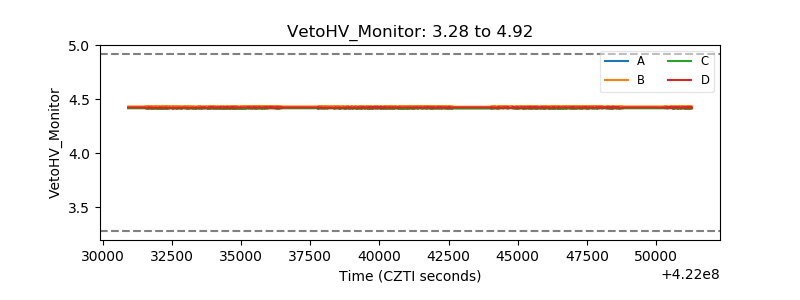 |
| Veto LLD | 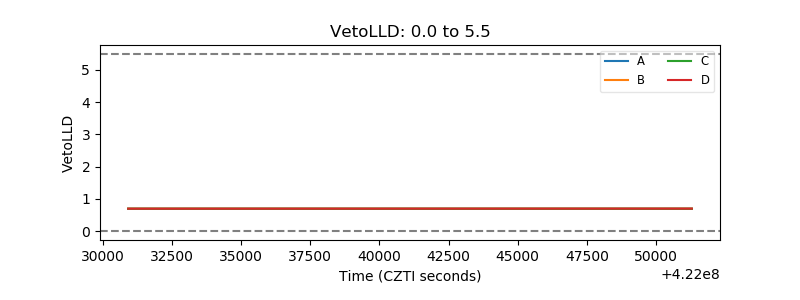 |
| Alpha Counter | 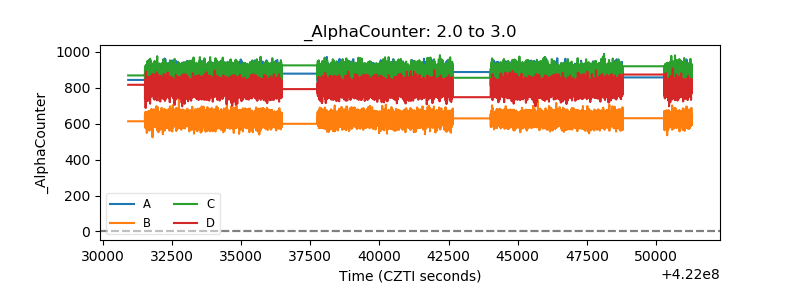 |
| _CPM_Rate | 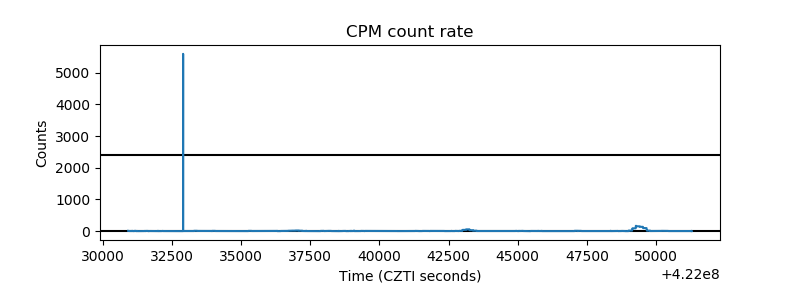 |
| CZT Counter | 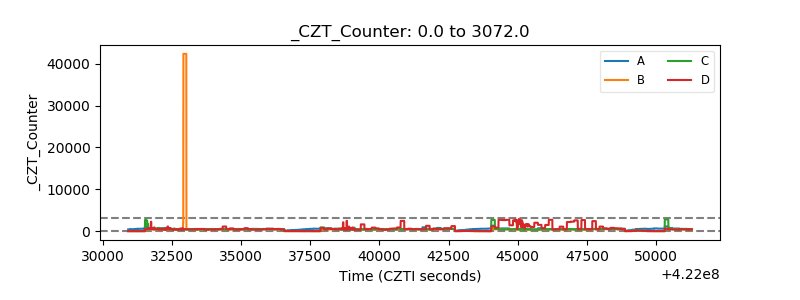 |
| +2.5 Volts monitor | 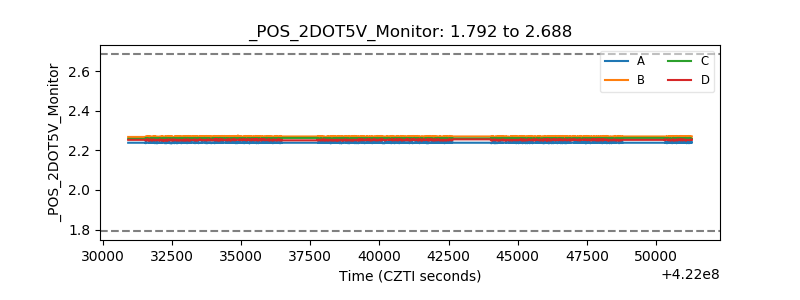 |
| +5 Volts monitor | 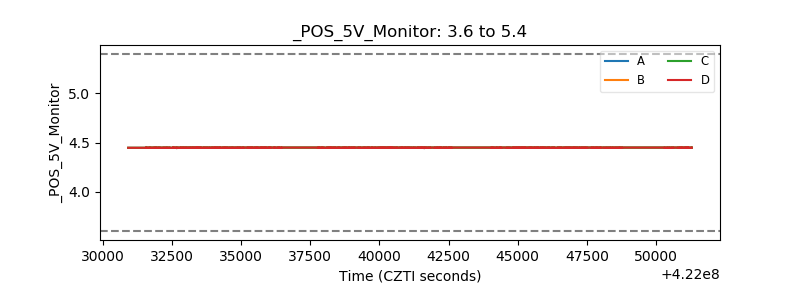 |
| _ROLL_ROT | 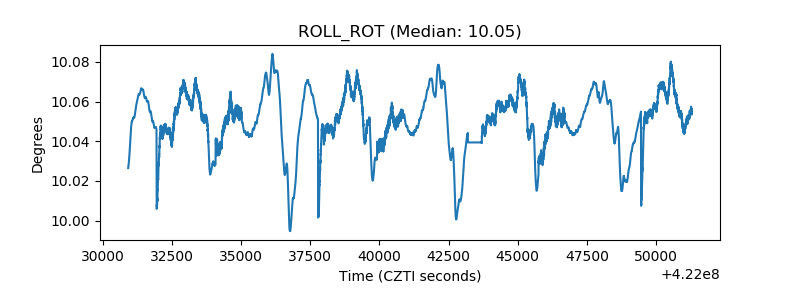 |
| _Roll_DEC | 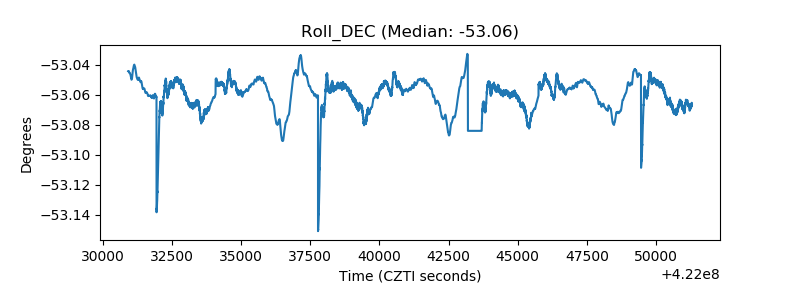 |
| _Roll_RA | 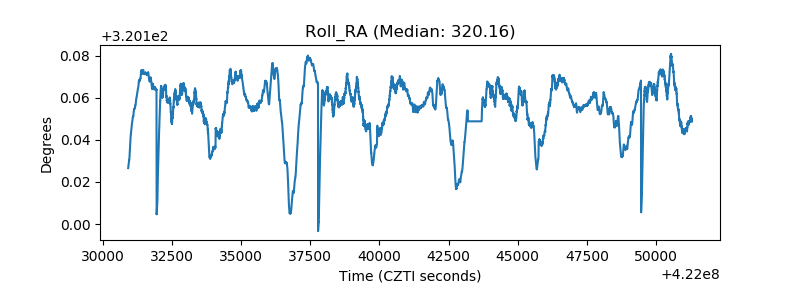 |
| Veto Counter | 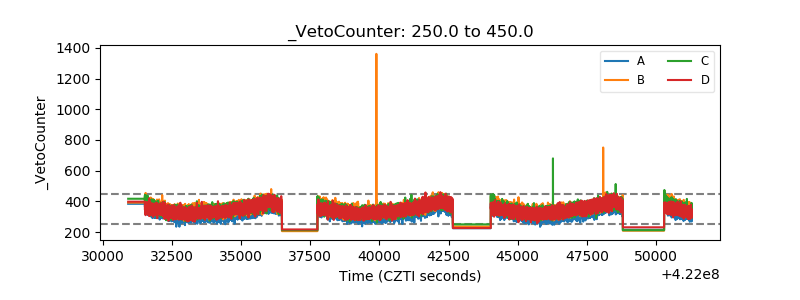 |