| Param | Original file | Final file |
|---|---|---|
| Filename | modeM0/AS1A12_052T04_9000005638_41283cztM0_level2.fits | modeM0/AS1A12_052T04_9000005638_41283cztM0_level2_quad_clean.evt |
| Size (bytes) | 313,320,960 | 85,849,920 |
| Size | 298.8 MB | 81.9 MB |
| Events in quadrant A | 2,737,094 | 579,409 |
| Events in quadrant B | 2,329,276 | 589,744 |
| Events in quadrant C | 3,011,165 | 536,133 |
| Events in quadrant D | 3,107,527 | 523,186 |
| Mode M9 | |||
|---|---|---|---|
| Quadrant | BADHDUFLAG | Total packets | Discarded packets |
| A | 0 | 23 | 0 |
| B | 0 | 23 | 0 |
| C | 0 | 23 | 0 |
| D | 0 | 24 | 0 |
| Mode SS | |||
|---|---|---|---|
| Quadrant | BADHDUFLAG | Total packets | Discarded packets |
| A | 0 | 108 | 0 |
| B | 0 | 108 | 0 |
| C | 0 | 108 | 0 |
| D | 0 | 108 | 0 |
| Mode M0 | |||
|---|---|---|---|
| Quadrant | BADHDUFLAG | Total packets | Discarded packets |
| A | 0 | 11465 | 2 |
| B | 0 | 10726 | 2 |
| C | 0 | 12334 | 2 |
| D | 0 | 12844 | 2 |
| Quadrant | Total seconds | Saturated seconds | Saturation percentage |
|---|---|---|---|
| A | 5296 | 12 | 0.226586% |
| B | 5296 | 9 | 0.169940% |
| C | 5296 | 250 | 4.720544% |
| D | 5296 | 61 | 1.151813% |
Noise dominated data is calculated using 1-second bins in cleaned event files. If a bin has >2000 counts, and if more than 50% of those come from <1% of pixels, then it is considered to be noise-dominated and hence unusable.
| Quadrant | # 1 sec bins | Bins with >0 counts | Bins with >2000 counts | High rate bins dominated by noise | Noise dominated (total time) | Noise dominated (detector-on time) | Marked lightcurve |
|---|---|---|---|---|---|---|---|
| A | 6909 | 5297 | 4 | 4 | 0.06% | 0.08% | 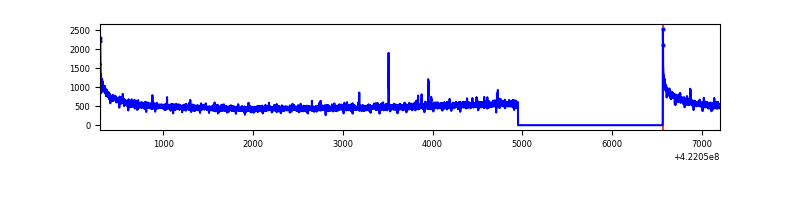 |
| B | 6909 | 5297 | 1 | 1 | 0.01% | 0.02% | 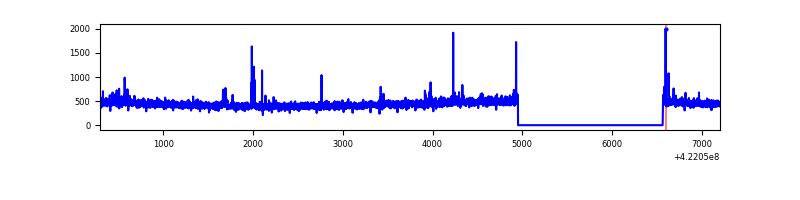 |
| C | 6909 | 5297 | 241 | 241 | 3.49% | 4.55% | 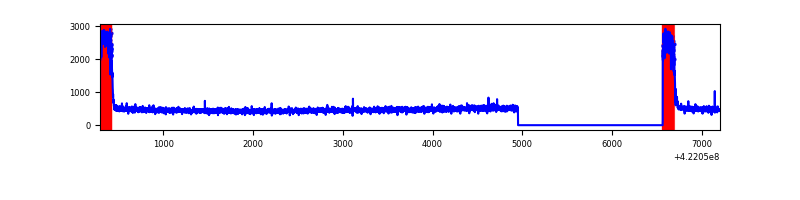 |
| D | 6909 | 5297 | 51 | 51 | 0.74% | 0.96% | 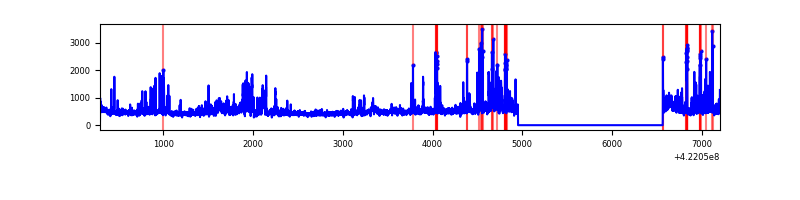 |
Top three noisy pixels from each quadrant. If the there are fewer than three noisy pixels in the level2.evt file, extra rows are filled as -1
| Pixel properties | Quadrant properties | ||||||
|---|---|---|---|---|---|---|---|
| Quadrant | DetID | PixID | Counts | Sigma | Mean | Median | Sigma |
| A | 10 | 83 | 490686 | 4170.64 | 575 | 563 | 117.5 |
| A | 2 | 79 | 18050 | 148.8 | 575 | 563 | 117.5 |
| A | 3 | 137 | 6436 | 49.98 | 575 | 563 | 117.5 |
| B | 7 | 202 | 20628 | 178.38 | 572 | 554 | 112.5 |
| B | 12 | 111 | 14333 | 122.44 | 572 | 554 | 112.5 |
| B | 11 | 111 | 13429 | 114.41 | 572 | 554 | 112.5 |
| C | 0 | 10 | 636825 | 4901.31 | 552 | 556 | 129.8 |
| C | 15 | 214 | 222495 | 1709.64 | 552 | 556 | 129.8 |
| C | 13 | 61 | 3765 | 24.72 | 552 | 556 | 129.8 |
| D | 1 | 52 | 401894 | 2898.53 | 561 | 544 | 138.5 |
| D | 2 | 249 | 163012 | 1173.34 | 561 | 544 | 138.5 |
| D | 12 | 79 | 145793 | 1048.98 | 561 | 544 | 138.5 |
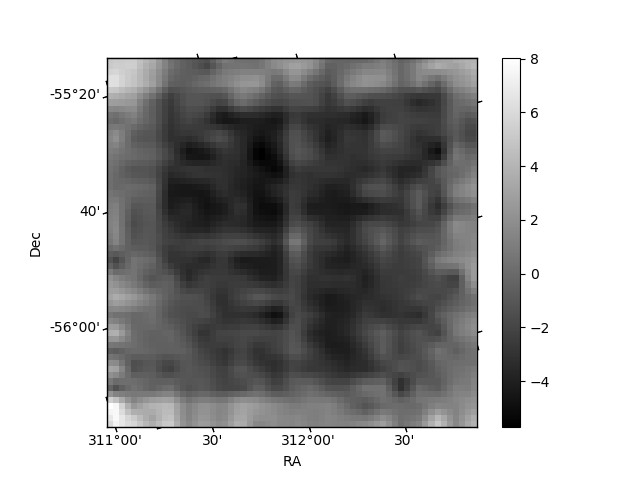
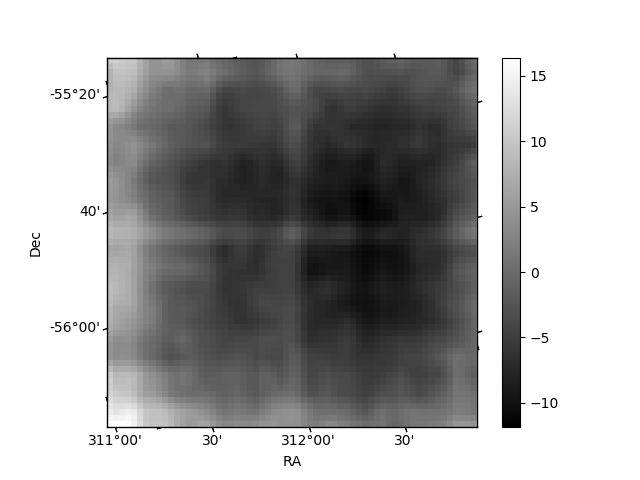
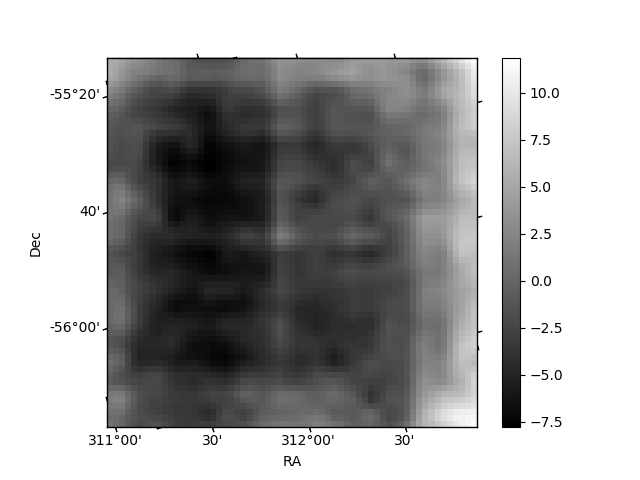
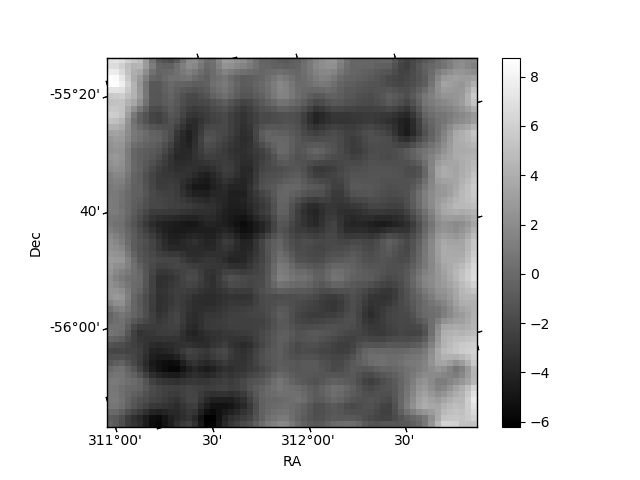
Histogram calculated using DETX and DETY for each event in the final _common_clean file
| Quadrant A | 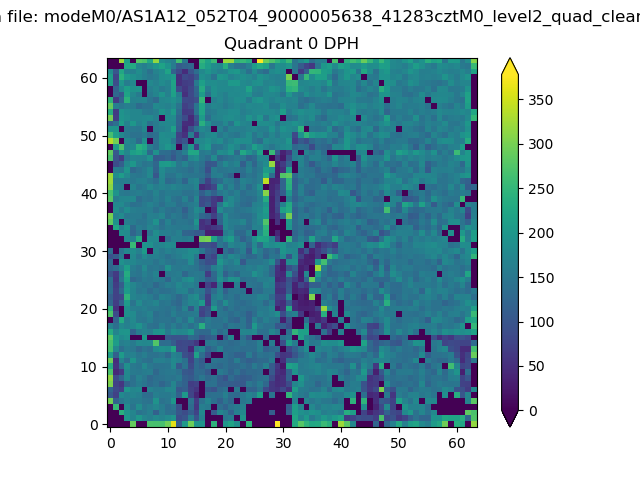 |
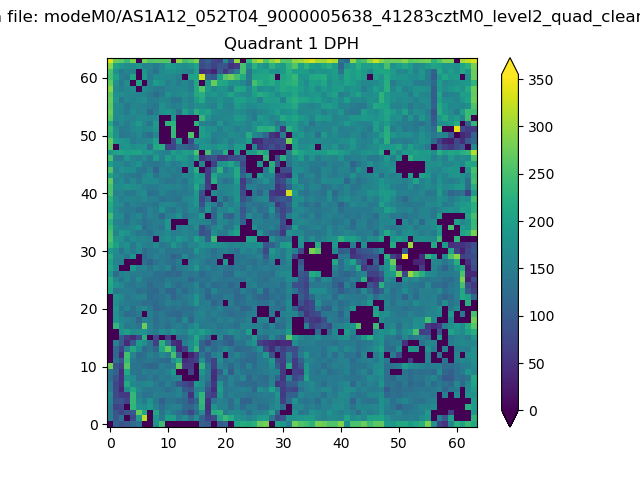 |
Quadrant B |
|---|---|---|---|
| Quadrant D | 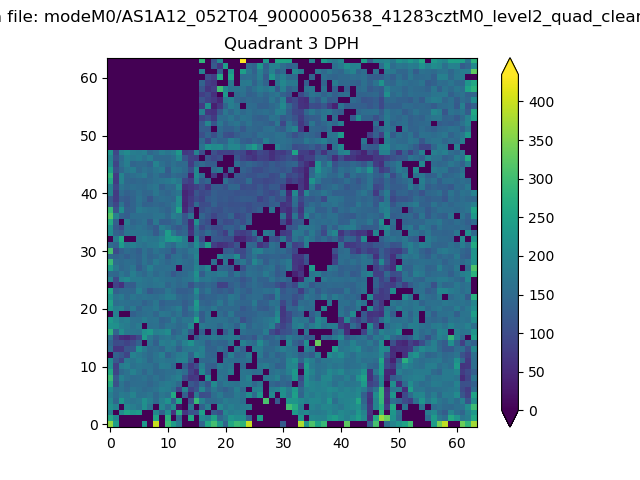 |
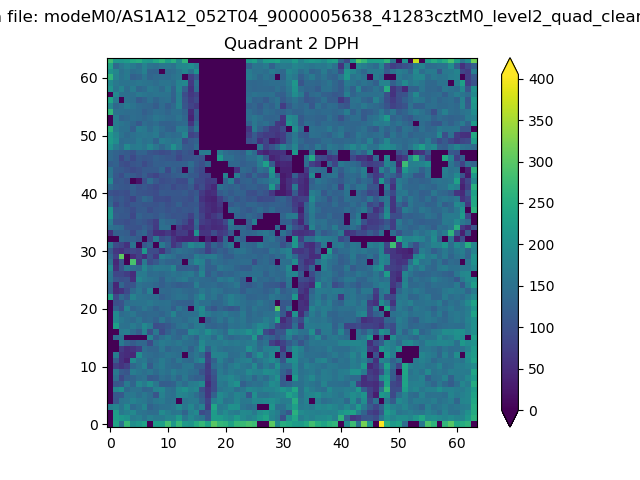 |
Quadrant C |
| Plot type | Count rate plots | Images |
|---|---|---|
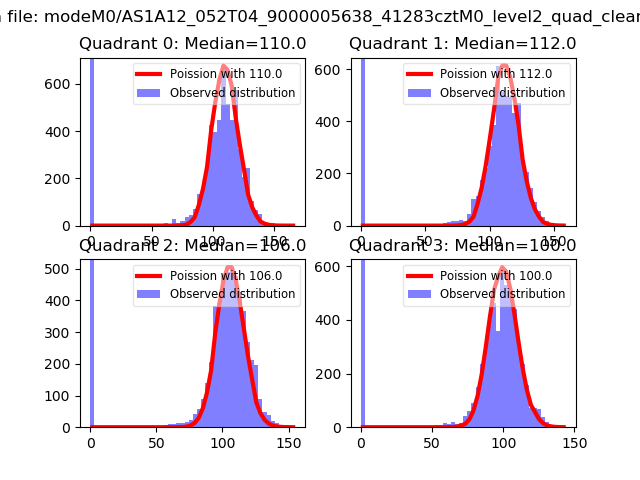
| Comparison with Poisson distribution Blue bars denote a histogram of data divided into 1 sec bins. Red curve is a Poisson curve with rate = median count rate of data. |
 |
 |
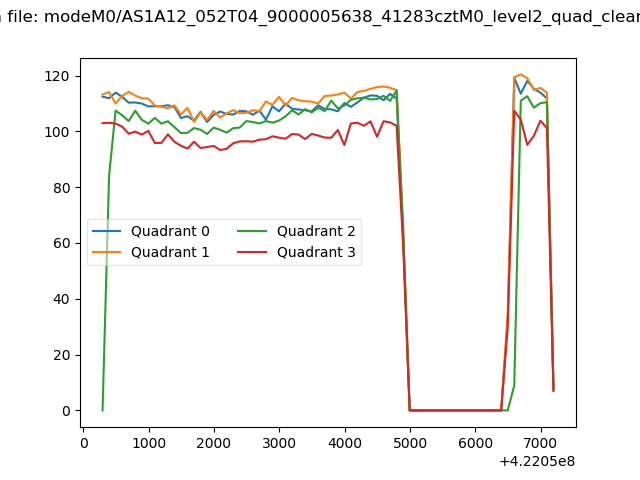
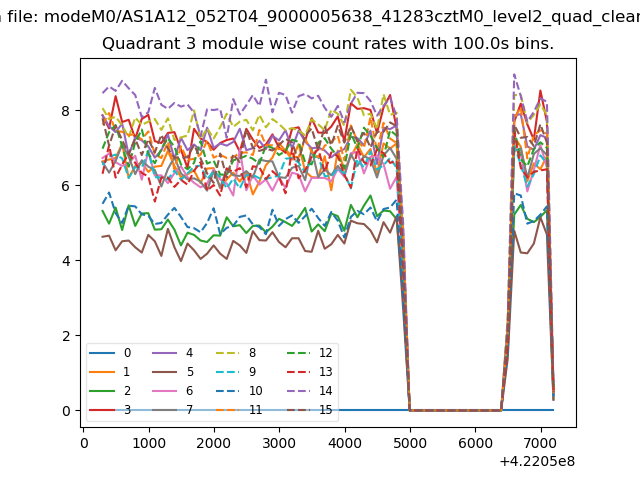
| Quadrant-wise count rates Data is divided into 100 sec bins |
 |
|
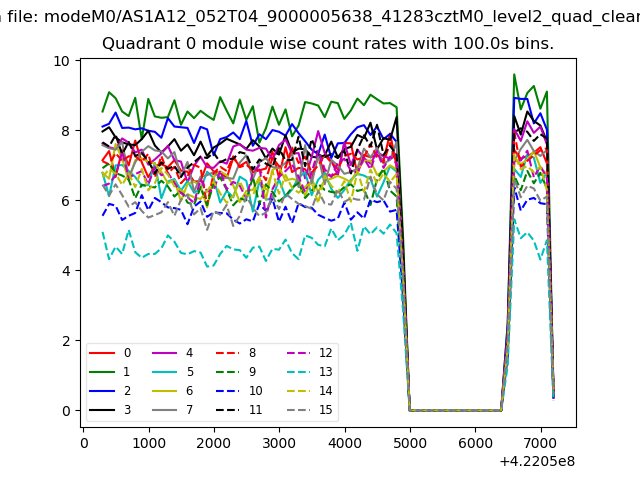
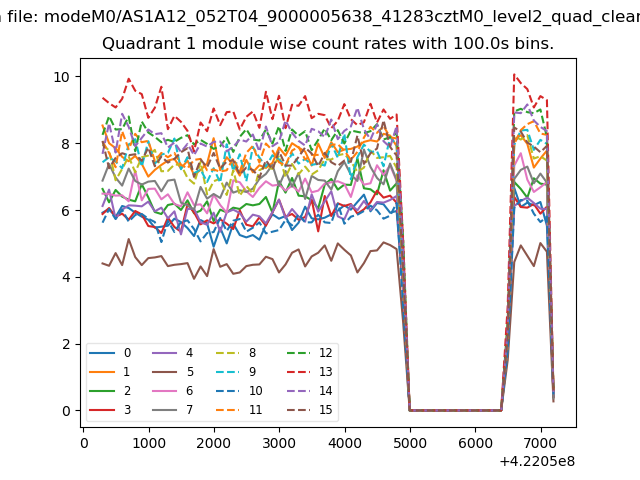
| Module-wise count rates for Quadrant A Data is divided into 100 sec bins |
 |
 |
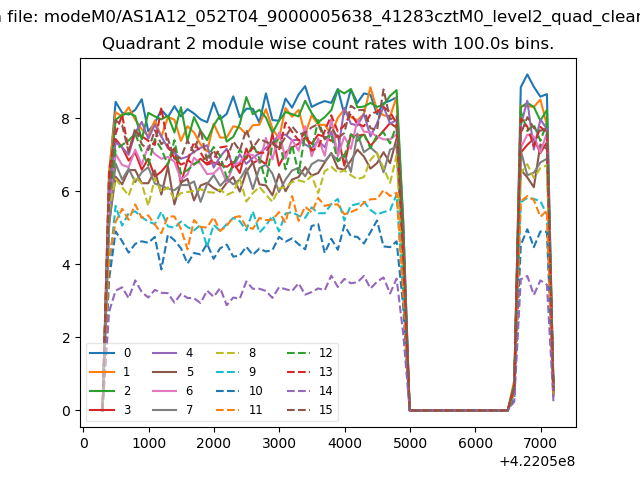
| Module-wise count rates for Quadrant B Data is divided into 100 sec bins |
 |
 |
| Module-wise count rates for Quadrant C Data is divided into 100 sec bins |
 |
 |
| Module-wise count rates for Quadrant D Data is divided into 100 sec bins |
 |
 |
| Parameter | Plot |
|---|---|
| CZT HV Monitor | 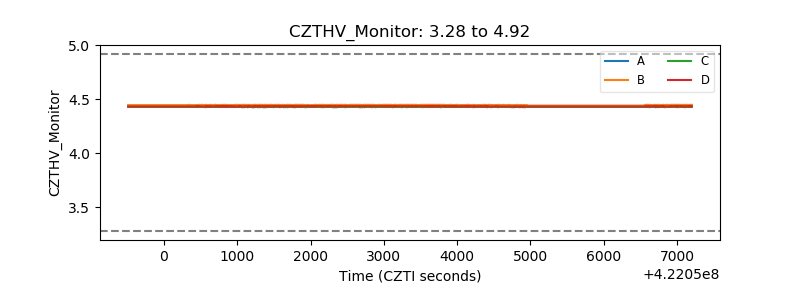 |
| D_VDD | 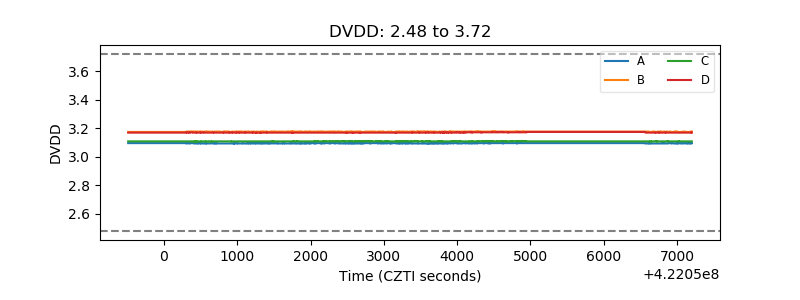 |
| Temperature 1 | 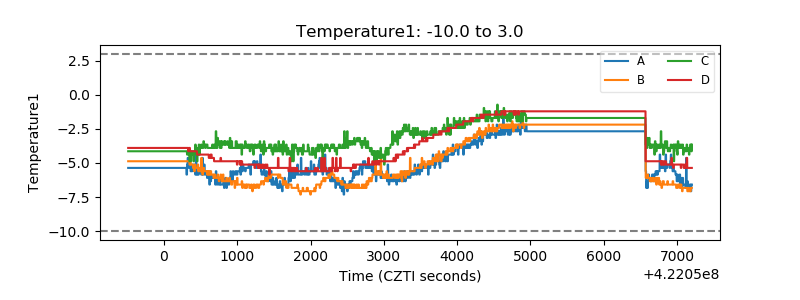 |
| Veto HV Monitor | 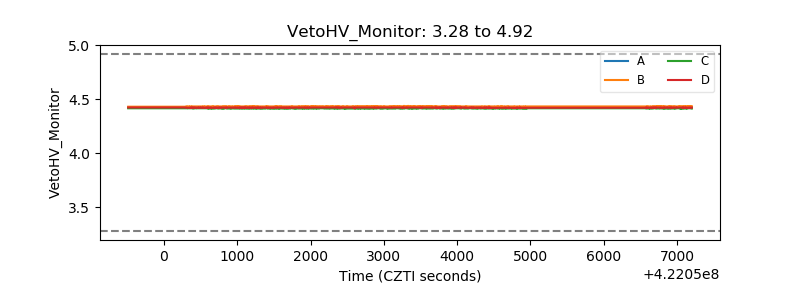 |
| Veto LLD | 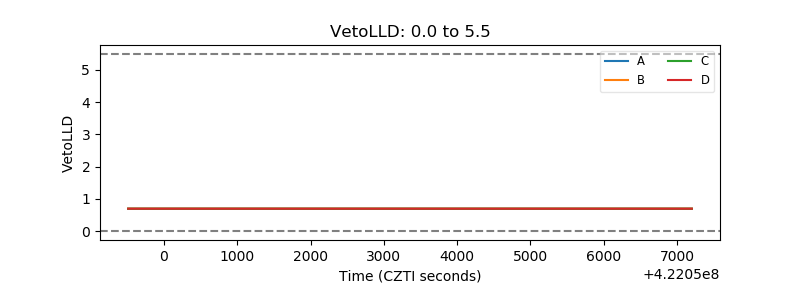 |
| Alpha Counter | 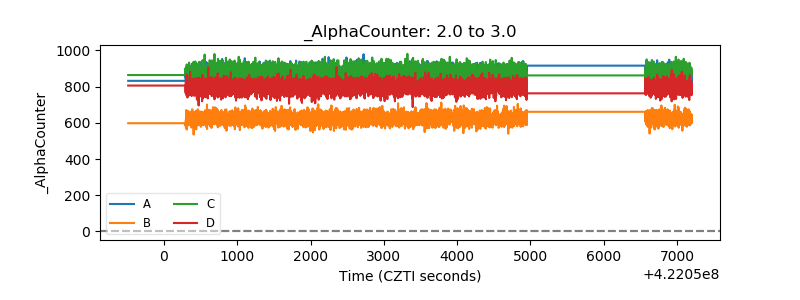 |
| _CPM_Rate | 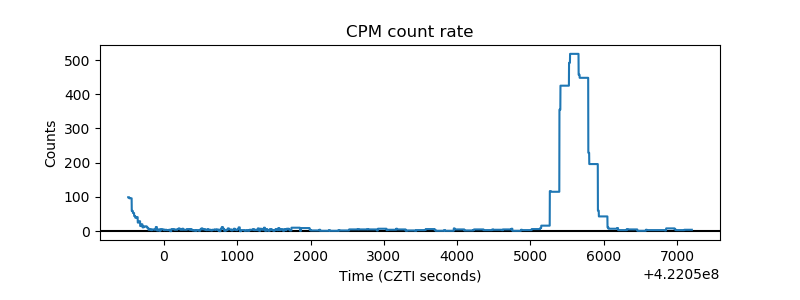 |
| CZT Counter | 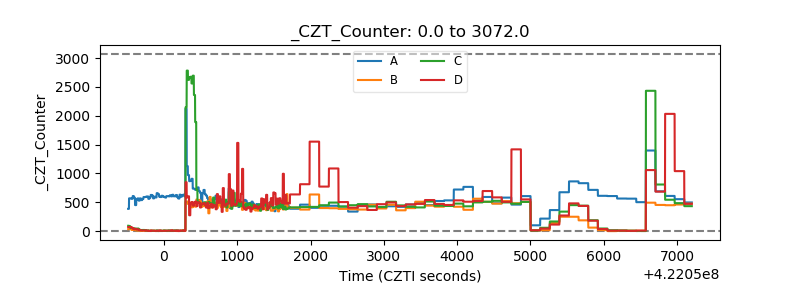 |
| +2.5 Volts monitor |  |
| +5 Volts monitor | 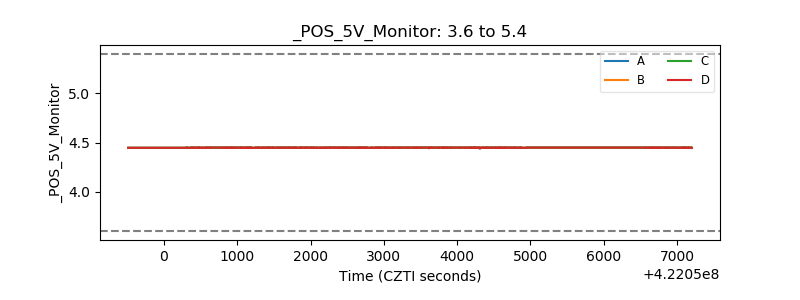 |
| _ROLL_ROT | 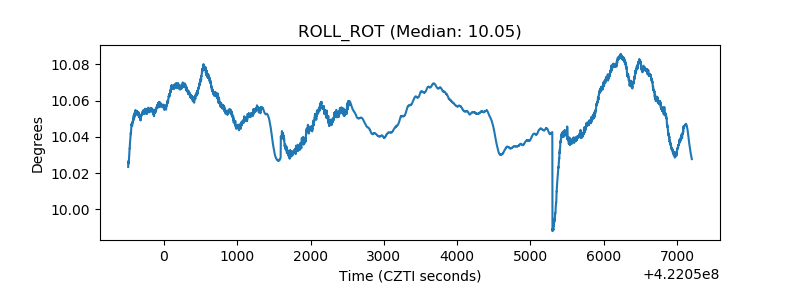 |
| _Roll_DEC | 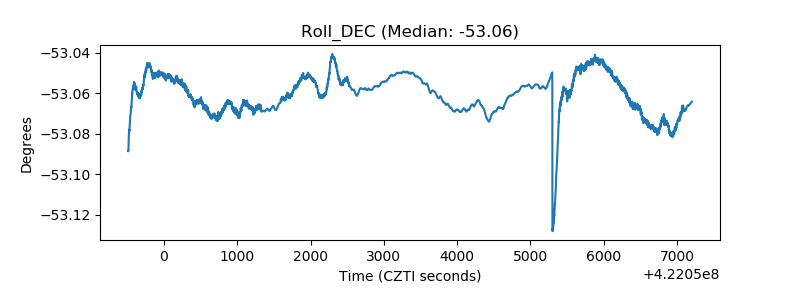 |
| _Roll_RA | 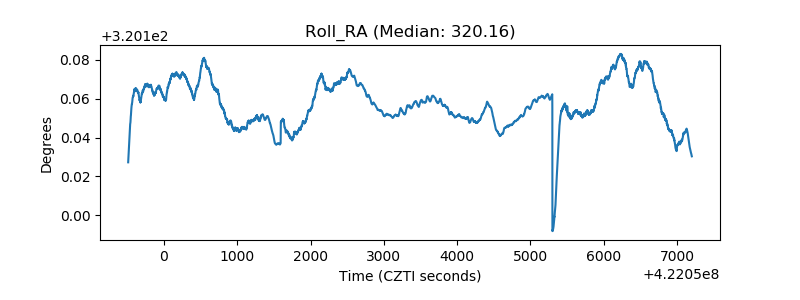 |
| Veto Counter | 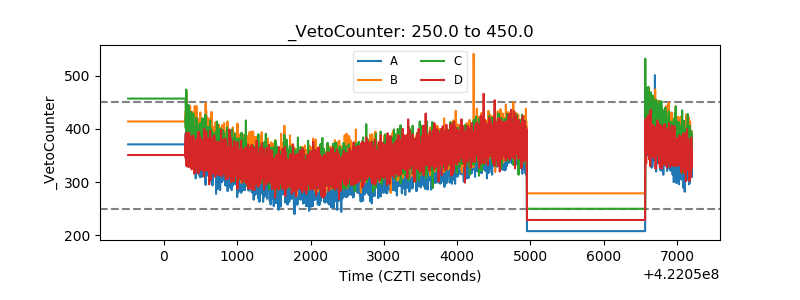 |