| Param | Original file | Final file |
|---|---|---|
| Filename | modeM0/AS1A12_011T42_9000005640_41284cztM0_level2.fits | modeM0/AS1A12_011T42_9000005640_41284cztM0_level2_quad_clean.evt |
| Size (bytes) | 317,018,880 | 87,684,480 |
| Size | 302.3 MB | 83.6 MB |
| Events in quadrant A | 2,762,378 | 595,245 |
| Events in quadrant B | 2,420,987 | 614,989 |
| Events in quadrant C | 3,081,768 | 552,478 |
| Events in quadrant D | 3,061,915 | 525,731 |
| Mode SS | |||
|---|---|---|---|
| Quadrant | BADHDUFLAG | Total packets | Discarded packets |
| A | 0 | 108 | 0 |
| B | 0 | 108 | 0 |
| C | 0 | 108 | 0 |
| D | 0 | 108 | 0 |
| Mode M9 | |||
|---|---|---|---|
| Quadrant | BADHDUFLAG | Total packets | Discarded packets |
| A | 0 | 27 | 0 |
| B | 0 | 27 | 0 |
| C | 0 | 27 | 0 |
| D | 0 | 28 | 0 |
| Mode M0 | |||
|---|---|---|---|
| Quadrant | BADHDUFLAG | Total packets | Discarded packets |
| A | 0 | 11305 | 3 |
| B | 0 | 10782 | 2 |
| C | 0 | 12384 | 2 |
| D | 0 | 12686 | 2 |
| Quadrant | Total seconds | Saturated seconds | Saturation percentage |
|---|---|---|---|
| A | 5231 | 10 | 0.191168% |
| B | 5231 | 4 | 0.076467% |
| C | 5231 | 250 | 4.779201% |
| D | 5231 | 129 | 2.466068% |
Noise dominated data is calculated using 1-second bins in cleaned event files. If a bin has >2000 counts, and if more than 50% of those come from <1% of pixels, then it is considered to be noise-dominated and hence unusable.
| Quadrant | # 1 sec bins | Bins with >0 counts | Bins with >2000 counts | High rate bins dominated by noise | Noise dominated (total time) | Noise dominated (detector-on time) | Marked lightcurve |
|---|---|---|---|---|---|---|---|
| A | 7084 | 5232 | 3 | 3 | 0.04% | 0.06% | 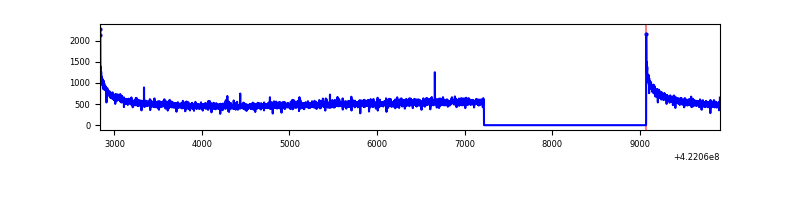 |
| B | 7084 | 5232 | 0 | 0 | 0.00% | 0.00% | 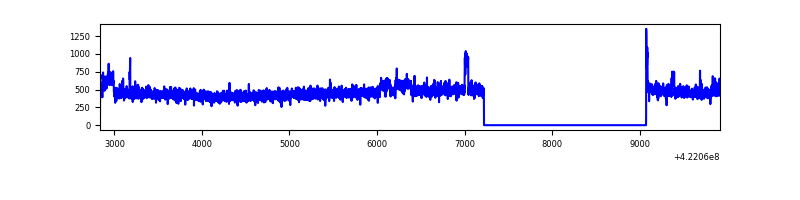 |
| C | 7084 | 5232 | 247 | 247 | 3.49% | 4.72% | 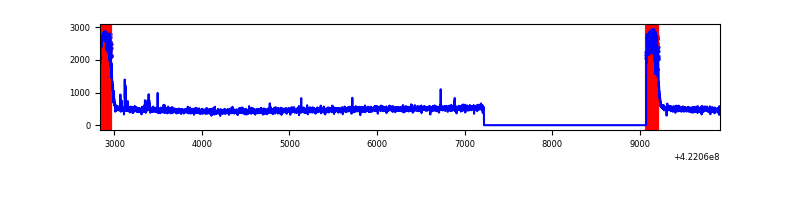 |
| D | 7084 | 5232 | 132 | 132 | 1.86% | 2.52% | 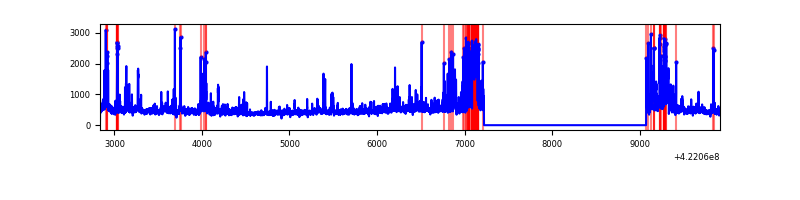 |
Top three noisy pixels from each quadrant. If the there are fewer than three noisy pixels in the level2.evt file, extra rows are filled as -1
| Pixel properties | Quadrant properties | ||||||
|---|---|---|---|---|---|---|---|
| Quadrant | DetID | PixID | Counts | Sigma | Mean | Median | Sigma |
| A | 10 | 83 | 483013 | 3998.32 | 588 | 577 | 120.7 |
| A | 3 | 137 | 6465 | 48.8 | 588 | 577 | 120.7 |
| A | 13 | 254 | 6141 | 46.11 | 588 | 577 | 120.7 |
| B | 7 | 202 | 103755 | 898.42 | 586 | 569 | 114.9 |
| B | 12 | 111 | 14606 | 122.22 | 586 | 569 | 114.9 |
| B | 11 | 111 | 13570 | 113.2 | 586 | 569 | 114.9 |
| C | 0 | 10 | 680254 | 5179.6 | 556 | 562 | 131.2 |
| C | 15 | 214 | 220704 | 1677.59 | 556 | 562 | 131.2 |
| C | 15 | 159 | 14900 | 109.26 | 556 | 562 | 131.2 |
| D | 2 | 249 | 362987 | 2633.19 | 562 | 547 | 137.6 |
| D | 1 | 52 | 232840 | 1687.65 | 562 | 547 | 137.6 |
| D | 5 | 222 | 136934 | 990.88 | 562 | 547 | 137.6 |
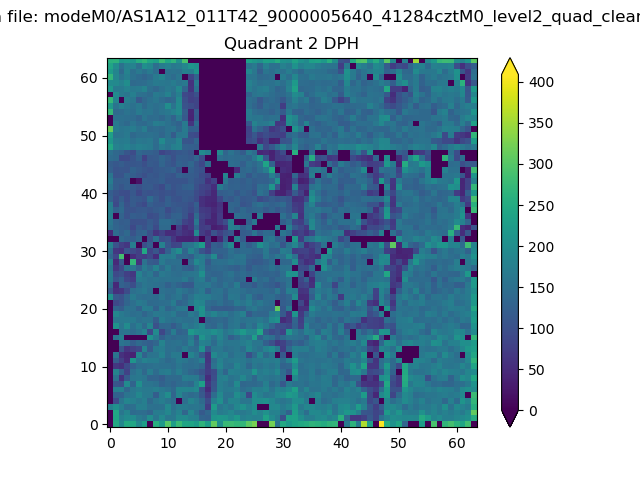
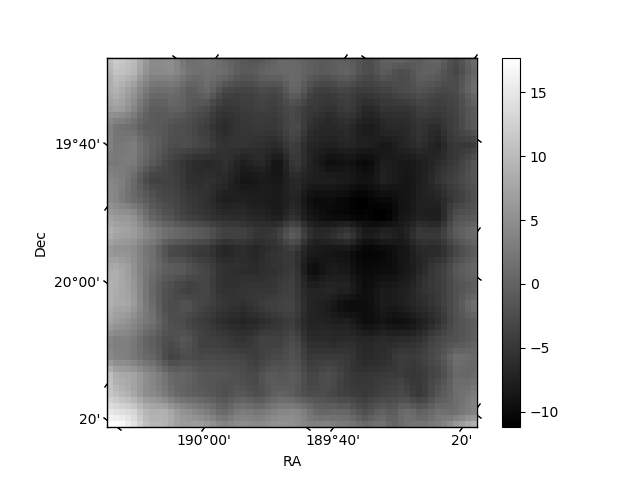
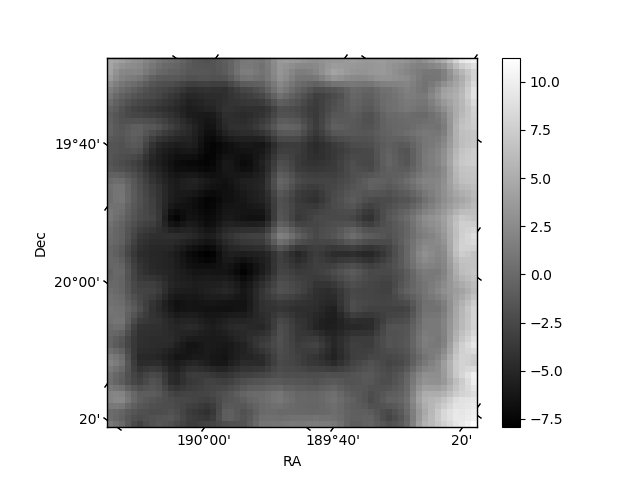
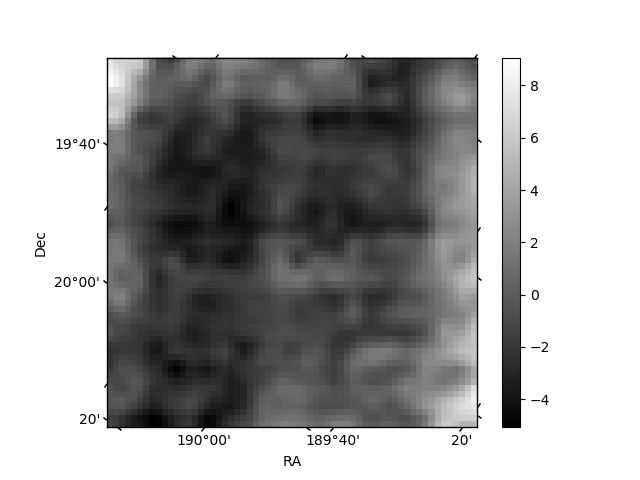
Histogram calculated using DETX and DETY for each event in the final _common_clean file
| Quadrant A | 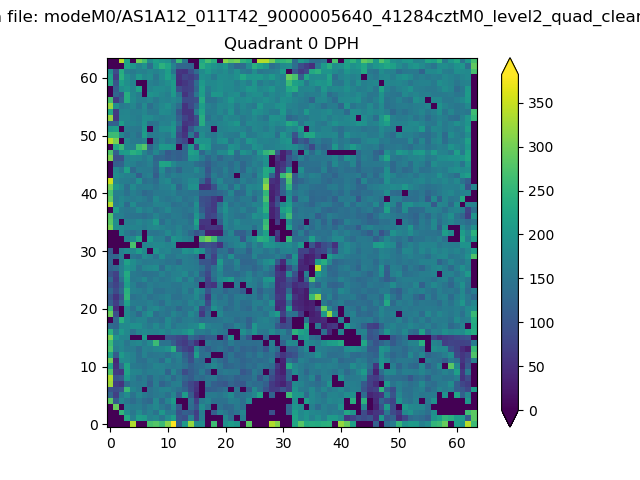 |
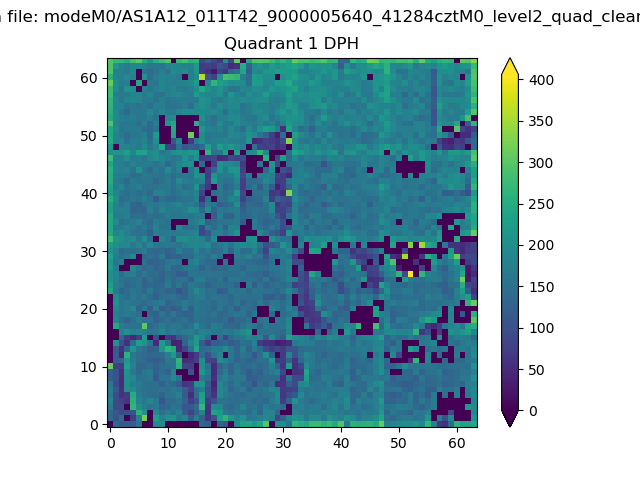 |
Quadrant B |
|---|---|---|---|
| Quadrant D | 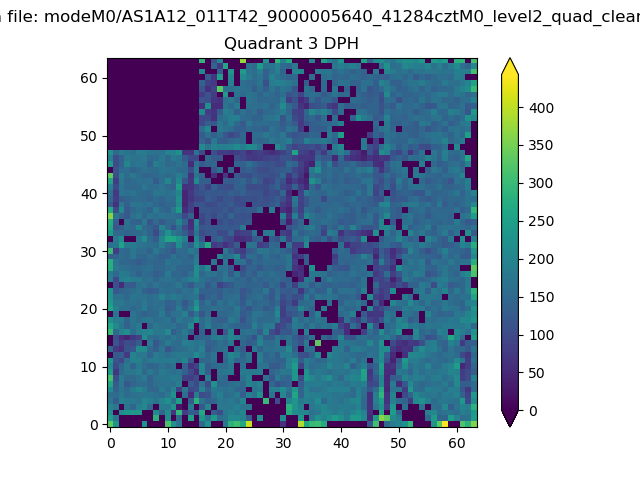 |
 |
Quadrant C |
| Plot type | Count rate plots | Images |
|---|---|---|
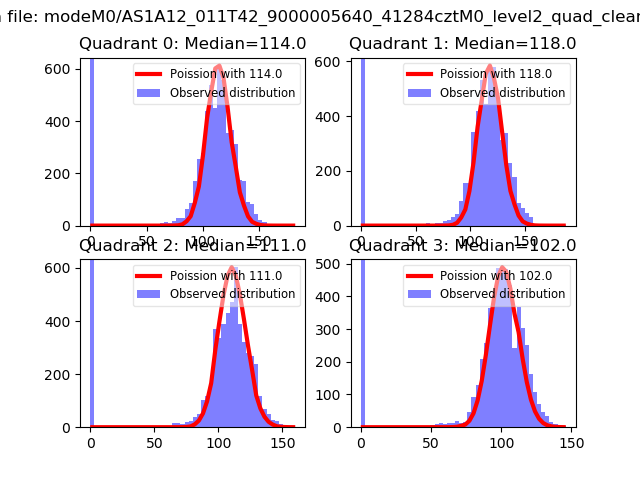
| Comparison with Poisson distribution Blue bars denote a histogram of data divided into 1 sec bins. Red curve is a Poisson curve with rate = median count rate of data. |
 |
 |
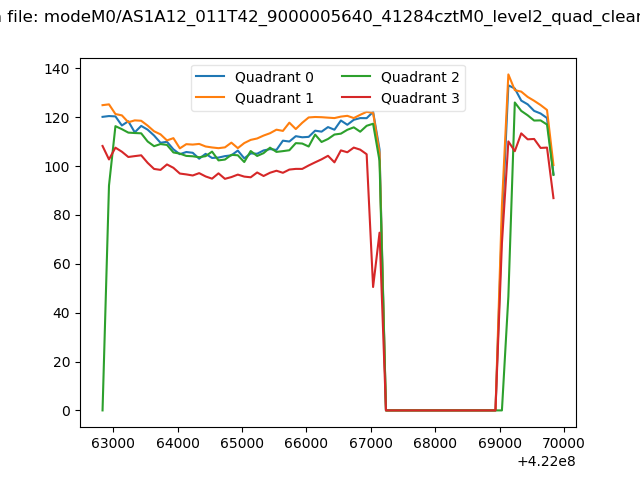
| Quadrant-wise count rates Data is divided into 100 sec bins |
 |
|
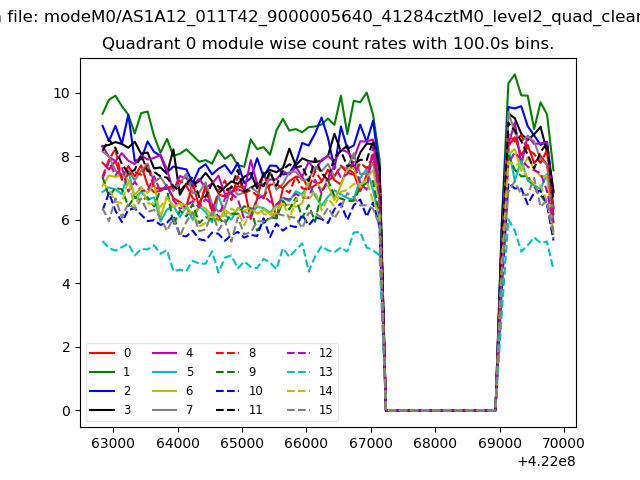
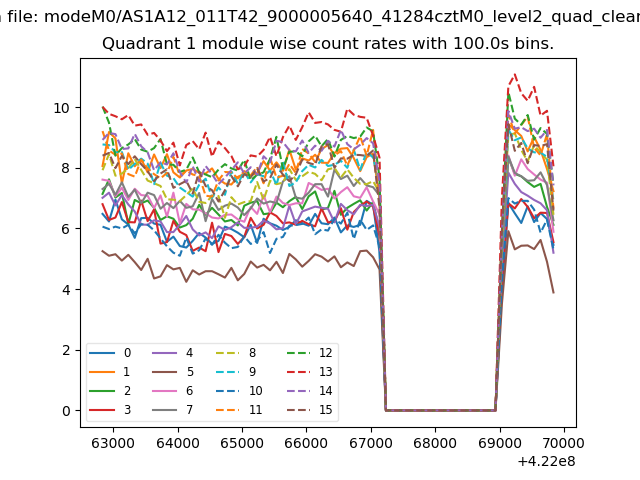
| Module-wise count rates for Quadrant A Data is divided into 100 sec bins |
 |
 |
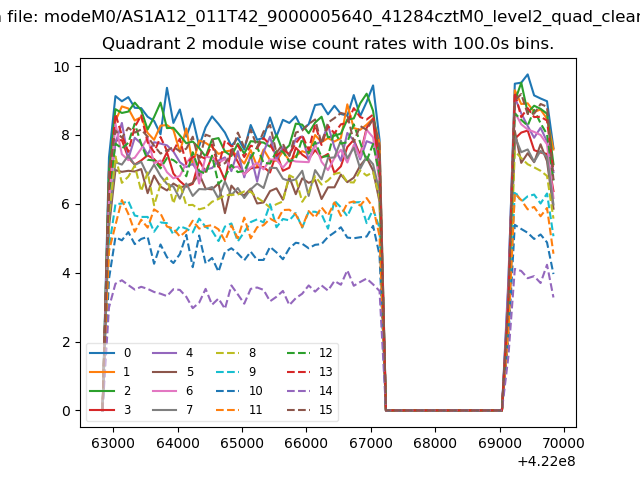
| Module-wise count rates for Quadrant B Data is divided into 100 sec bins |
 |
 |
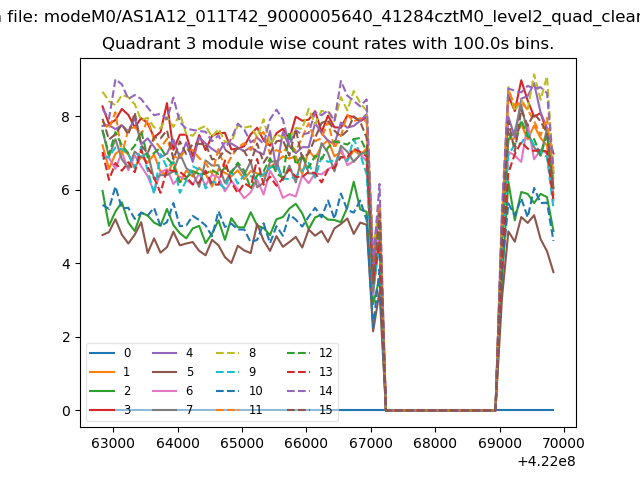
| Module-wise count rates for Quadrant C Data is divided into 100 sec bins |
 |
 |
| Module-wise count rates for Quadrant D Data is divided into 100 sec bins |
 |
 |
| Parameter | Plot |
|---|---|
| CZT HV Monitor | 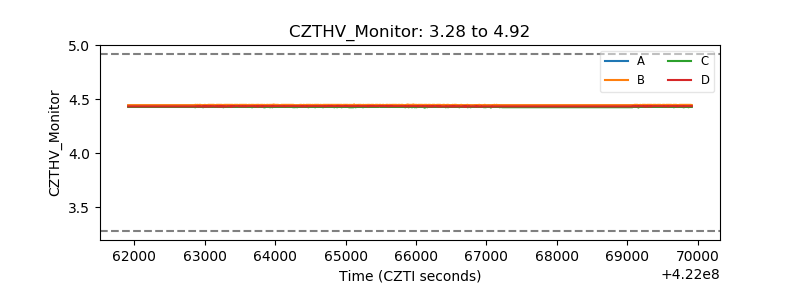 |
| D_VDD | 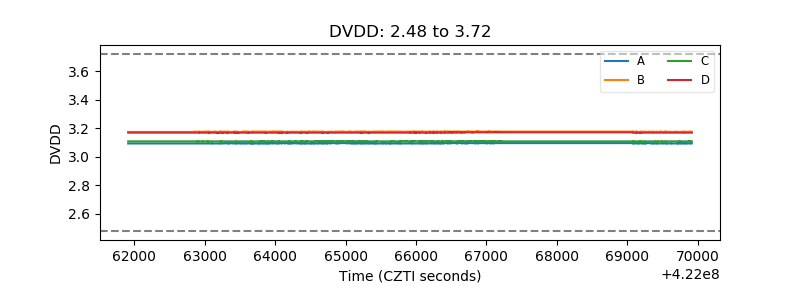 |
| Temperature 1 | 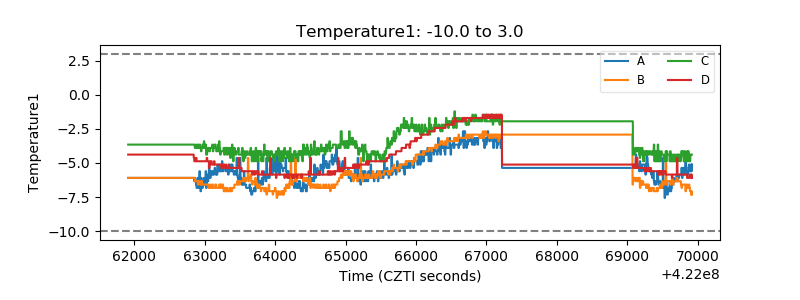 |
| Veto HV Monitor | 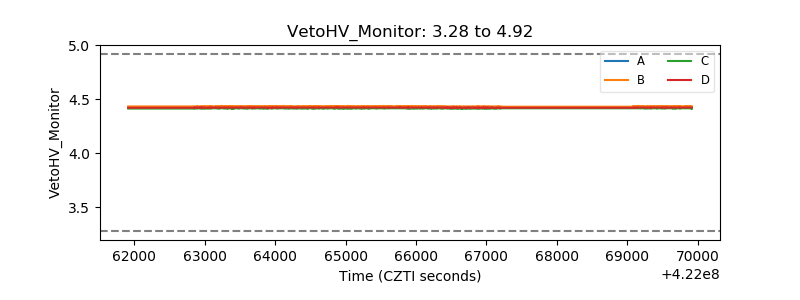 |
| Veto LLD | 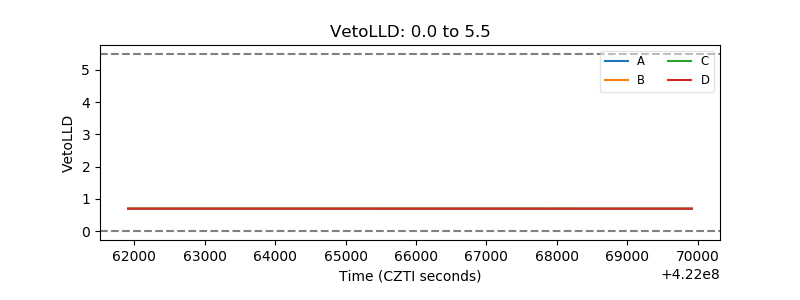 |
| Alpha Counter | 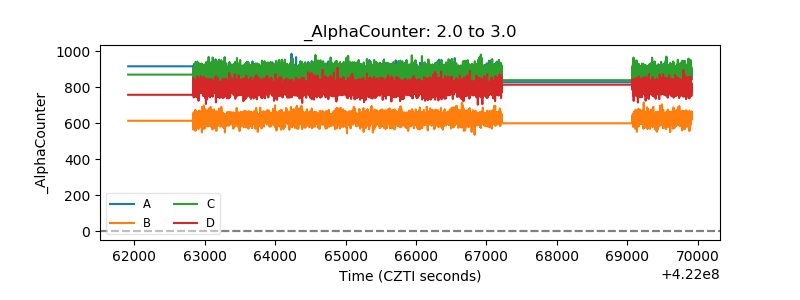 |
| _CPM_Rate | 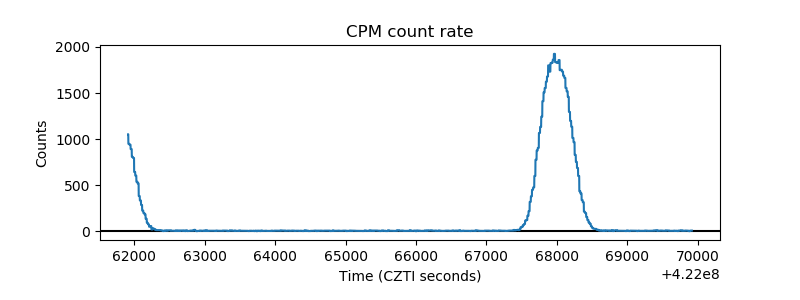 |
| CZT Counter | 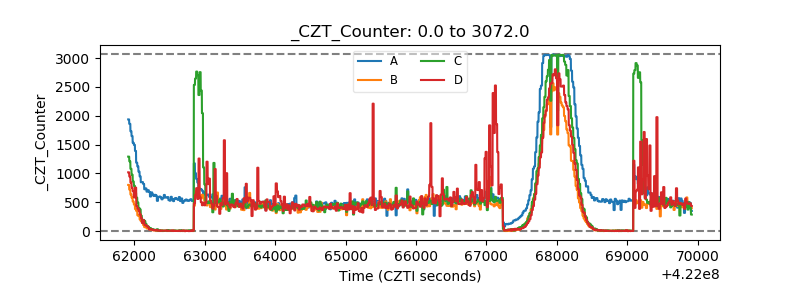 |
| +2.5 Volts monitor |  |
| +5 Volts monitor |  |
| _ROLL_ROT |  |
| _Roll_DEC | 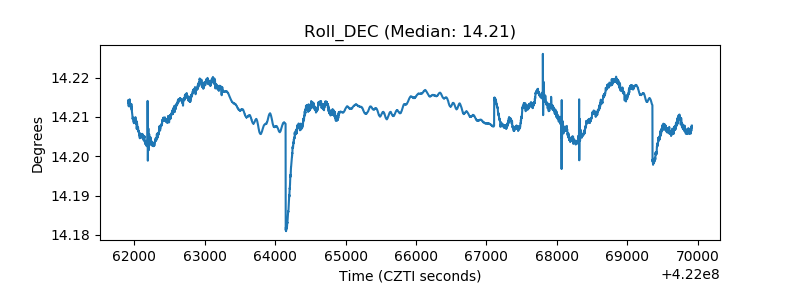 |
| _Roll_RA |  |
| Veto Counter |  |