| Param | Original file | Final file |
|---|---|---|
| Filename | modeM0/AS1A12_011T42_9000005640_41287cztM0_level2.fits | modeM0/AS1A12_011T42_9000005640_41287cztM0_level2_quad_clean.evt |
| Size (bytes) | 341,242,560 | 91,002,240 |
| Size | 325.4 MB | 86.8 MB |
| Events in quadrant A | 2,900,365 | 629,022 |
| Events in quadrant B | 2,445,592 | 656,763 |
| Events in quadrant C | 3,094,511 | 583,915 |
| Events in quadrant D | 3,788,441 | 524,282 |
| Mode SS | |||
|---|---|---|---|
| Quadrant | BADHDUFLAG | Total packets | Discarded packets |
| A | 0 | 104 | 0 |
| B | 0 | 104 | 0 |
| C | 0 | 104 | 0 |
| D | 0 | 104 | 0 |
| Mode M9 | |||
|---|---|---|---|
| Quadrant | BADHDUFLAG | Total packets | Discarded packets |
| A | 0 | 30 | 0 |
| B | 0 | 30 | 0 |
| C | 0 | 30 | 0 |
| D | 0 | 31 | 0 |
| Mode M0 | |||
|---|---|---|---|
| Quadrant | BADHDUFLAG | Total packets | Discarded packets |
| A | 0 | 11500 | 3 |
| B | 0 | 10445 | 2 |
| C | 0 | 12112 | 2 |
| D | 0 | 14668 | 2 |
| Quadrant | Total seconds | Saturated seconds | Saturation percentage |
|---|---|---|---|
| A | 5169 | 14 | 0.270845% |
| B | 5169 | 8 | 0.154769% |
| C | 5169 | 209 | 4.043335% |
| D | 5169 | 404 | 7.815825% |
Noise dominated data is calculated using 1-second bins in cleaned event files. If a bin has >2000 counts, and if more than 50% of those come from <1% of pixels, then it is considered to be noise-dominated and hence unusable.
| Quadrant | # 1 sec bins | Bins with >0 counts | Bins with >2000 counts | High rate bins dominated by noise | Noise dominated (total time) | Noise dominated (detector-on time) | Marked lightcurve |
|---|---|---|---|---|---|---|---|
| A | 7292 | 5170 | 4 | 4 | 0.05% | 0.08% | 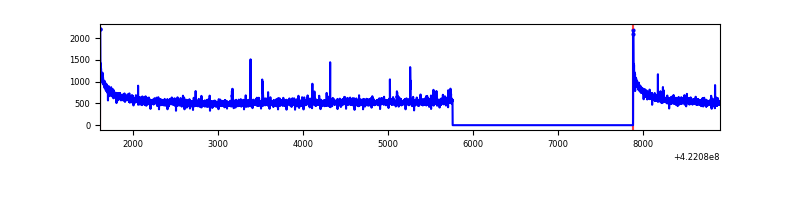 |
| B | 7292 | 5170 | 1 | 1 | 0.01% | 0.02% | 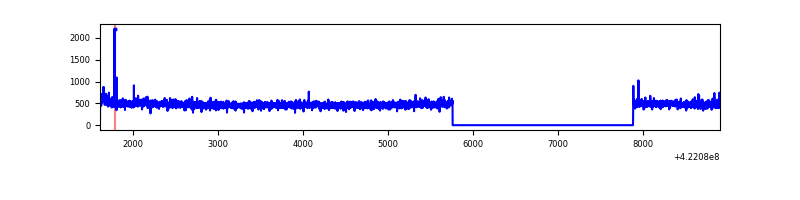 |
| C | 7292 | 5170 | 208 | 208 | 2.85% | 4.02% | 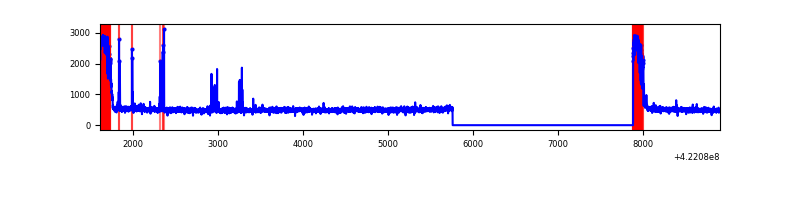 |
| D | 7292 | 5170 | 406 | 406 | 5.57% | 7.85% | 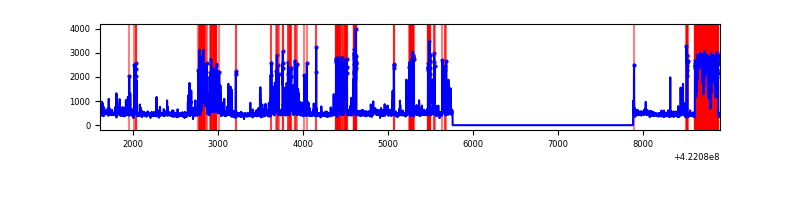 |
Top three noisy pixels from each quadrant. If the there are fewer than three noisy pixels in the level2.evt file, extra rows are filled as -1
| Pixel properties | Quadrant properties | ||||||
|---|---|---|---|---|---|---|---|
| Quadrant | DetID | PixID | Counts | Sigma | Mean | Median | Sigma |
| A | 10 | 83 | 490029 | 3891.19 | 616 | 605 | 125.8 |
| A | 2 | 79 | 23834 | 184.68 | 616 | 605 | 125.8 |
| A | 12 | 189 | 6558 | 47.33 | 616 | 605 | 125.8 |
| B | 0 | 229 | 25847 | 216.43 | 611 | 595 | 116.7 |
| B | 12 | 111 | 14661 | 120.56 | 611 | 595 | 116.7 |
| B | 11 | 111 | 13901 | 114.05 | 611 | 595 | 116.7 |
| C | 0 | 10 | 552274 | 4091.29 | 579 | 582 | 134.8 |
| C | 15 | 214 | 220203 | 1628.69 | 579 | 582 | 134.8 |
| C | 15 | 159 | 45370 | 332.14 | 579 | 582 | 134.8 |
| D | 1 | 52 | 1180852 | 8499.3 | 571 | 556 | 138.9 |
| D | 5 | 222 | 236112 | 1696.24 | 571 | 556 | 138.9 |
| D | 2 | 249 | 123901 | 888.21 | 571 | 556 | 138.9 |
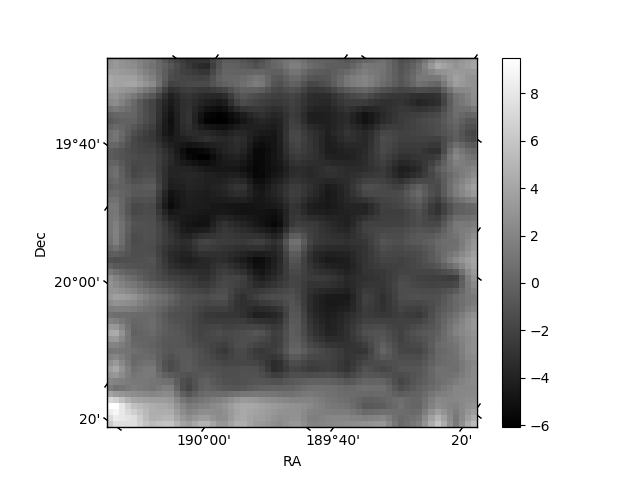
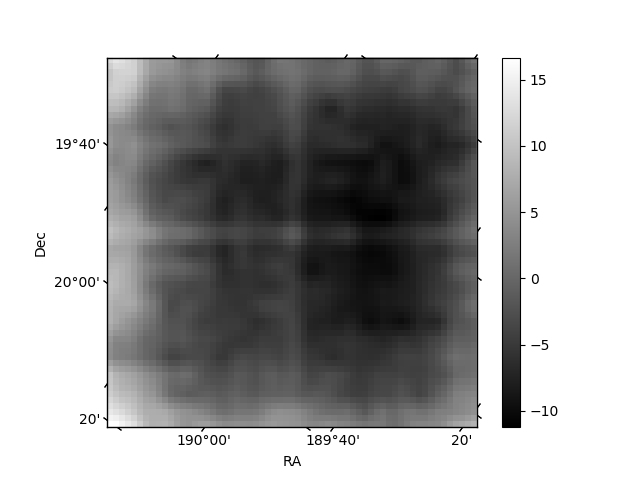
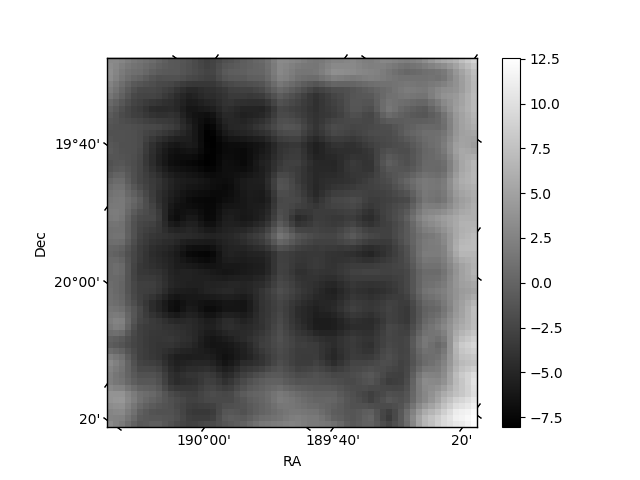
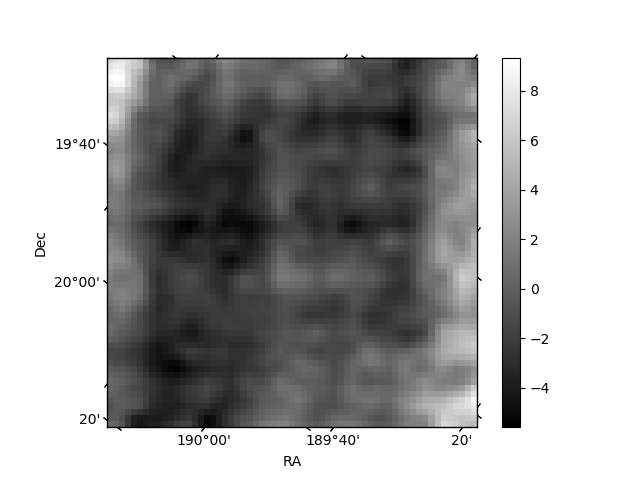
Histogram calculated using DETX and DETY for each event in the final _common_clean file
| Quadrant A | 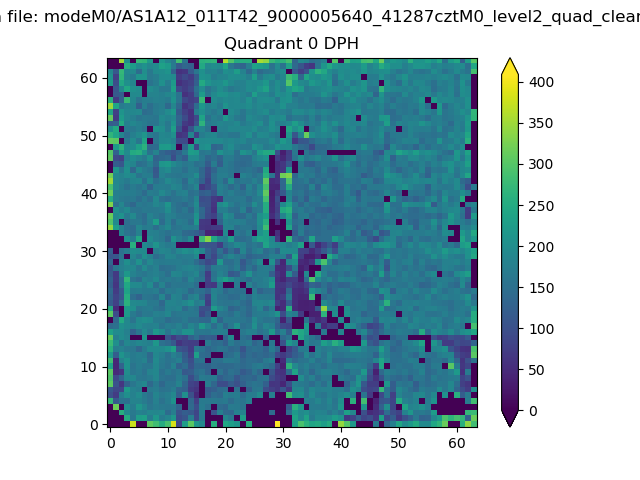 |
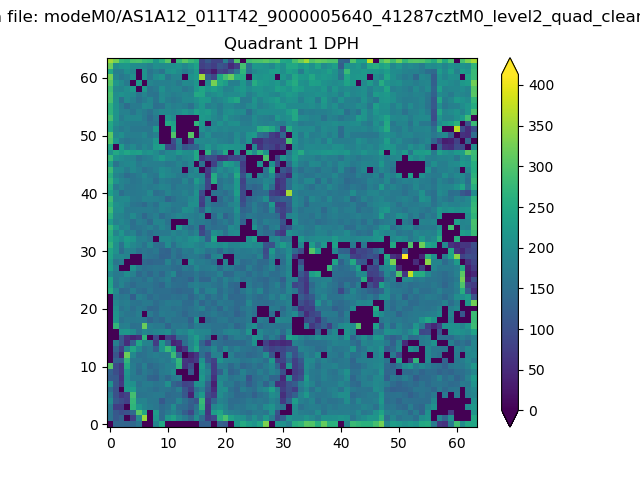 |
Quadrant B |
|---|---|---|---|
| Quadrant D |  |
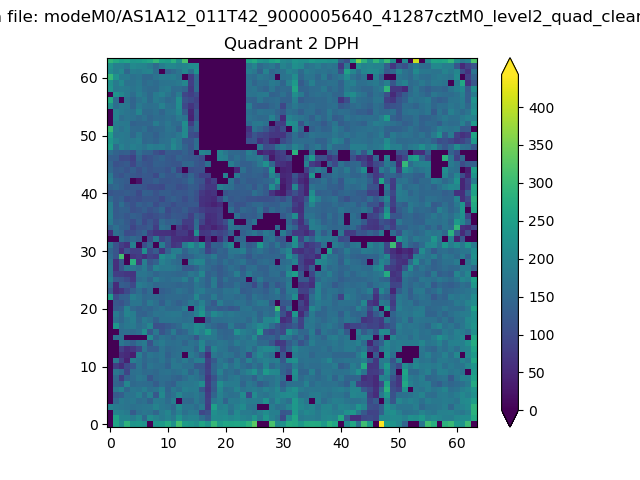 |
Quadrant C |
| Plot type | Count rate plots | Images |
|---|---|---|
| Comparison with Poisson distribution Blue bars denote a histogram of data divided into 1 sec bins. Red curve is a Poisson curve with rate = median count rate of data. |
 |
 |
| Quadrant-wise count rates Data is divided into 100 sec bins |
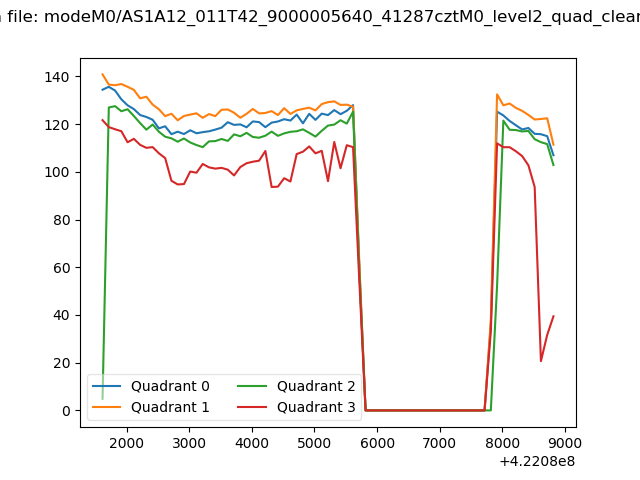 |
|
| Module-wise count rates for Quadrant A Data is divided into 100 sec bins |
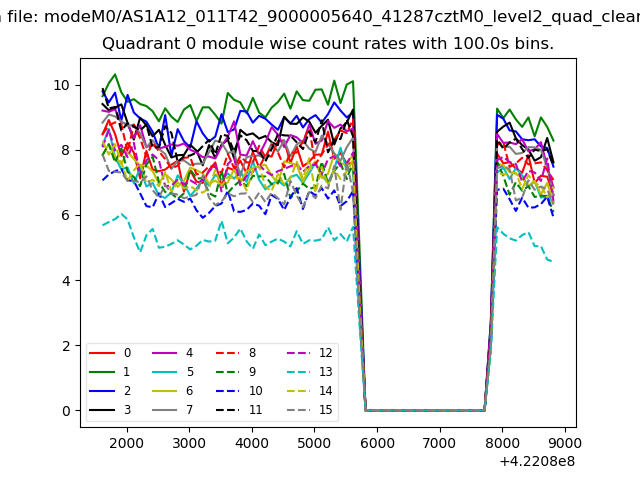 |
 |
| Module-wise count rates for Quadrant B Data is divided into 100 sec bins |
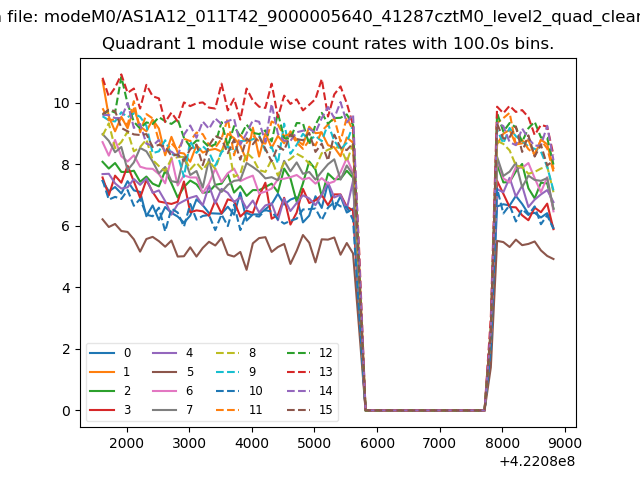 |
 |
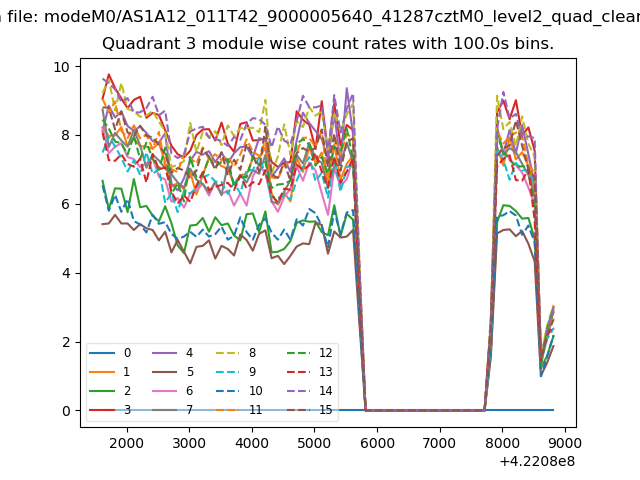
| Module-wise count rates for Quadrant C Data is divided into 100 sec bins |
 |
 |
| Module-wise count rates for Quadrant D Data is divided into 100 sec bins |
 |
 |
| Parameter | Plot |
|---|---|
| CZT HV Monitor | 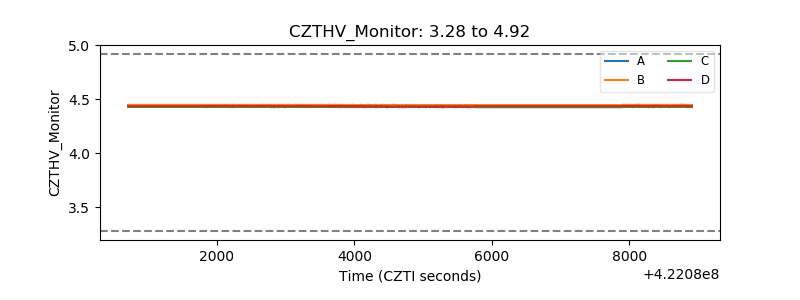 |
| D_VDD | 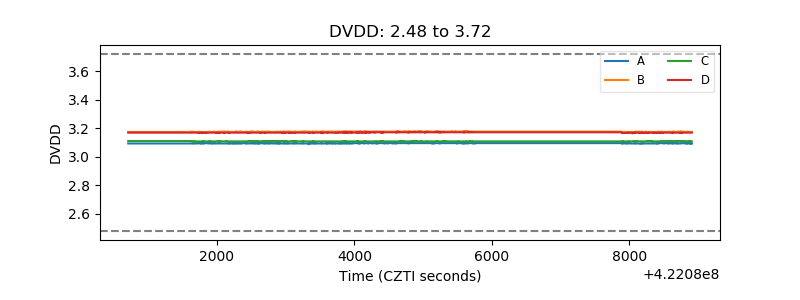 |
| Temperature 1 | 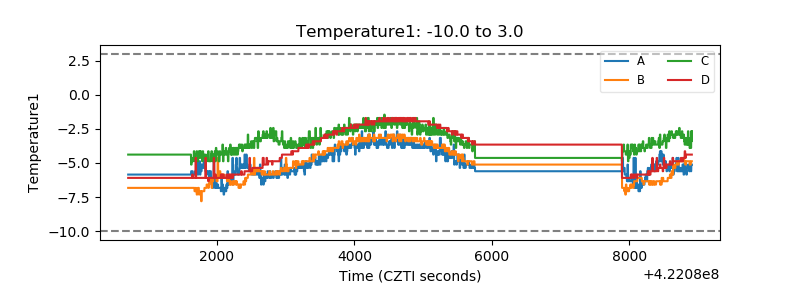 |
| Veto HV Monitor | 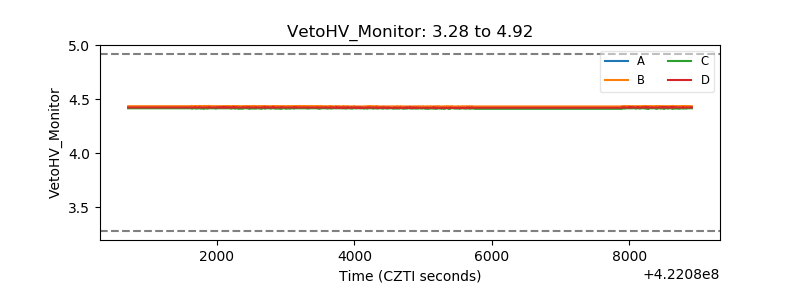 |
| Veto LLD | 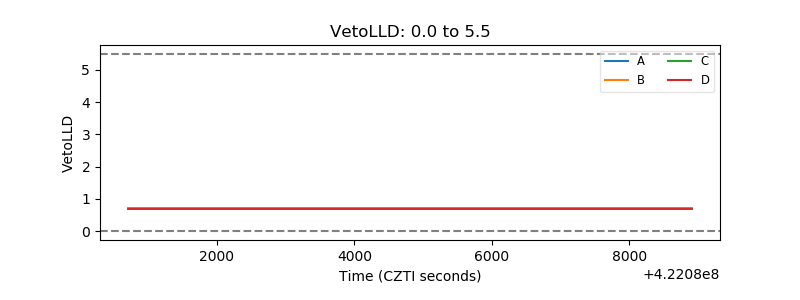 |
| Alpha Counter | 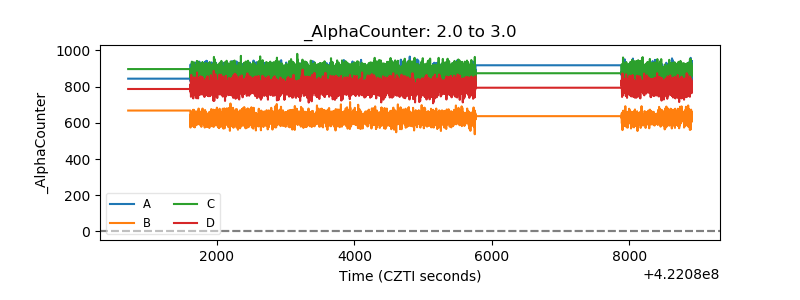 |
| _CPM_Rate | 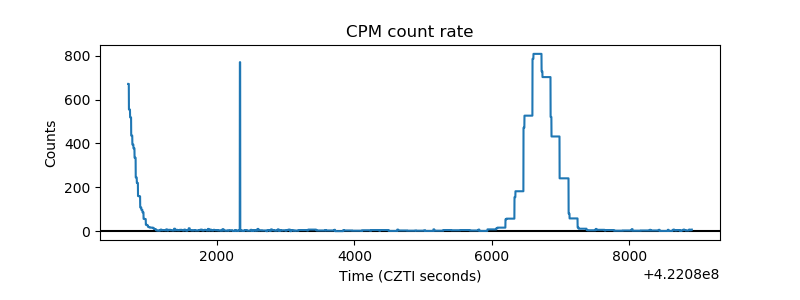 |
| CZT Counter | 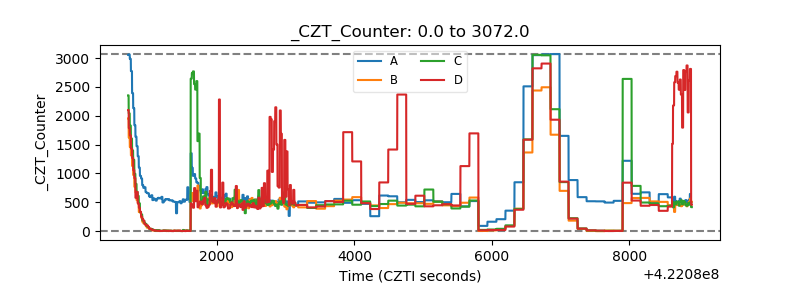 |
| +2.5 Volts monitor |  |
| +5 Volts monitor | 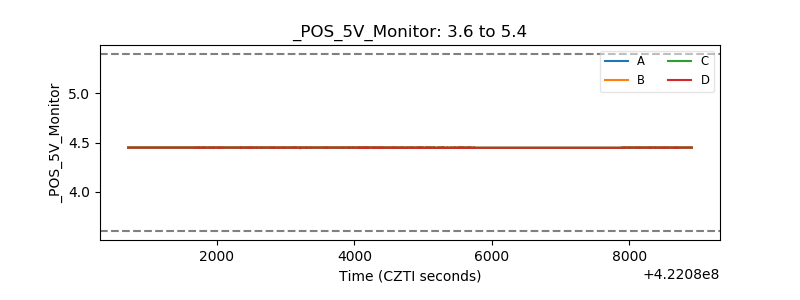 |
| _ROLL_ROT | 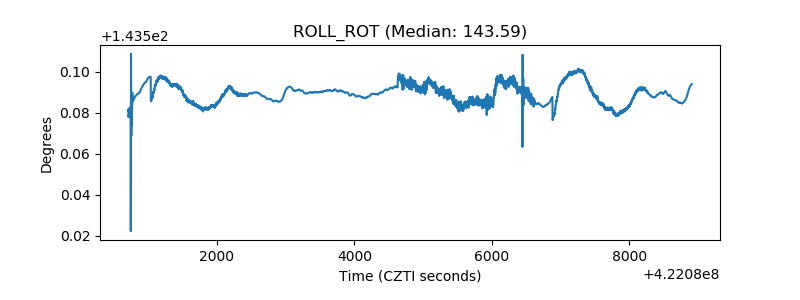 |
| _Roll_DEC | 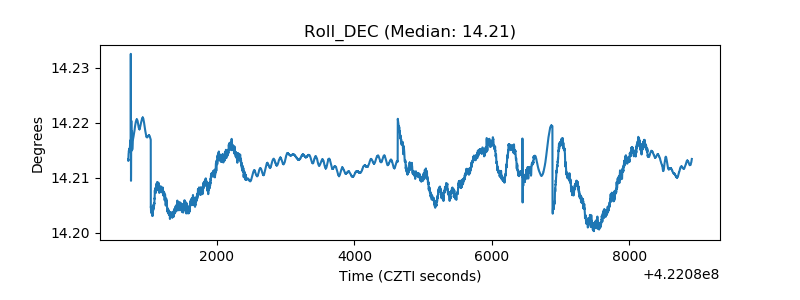 |
| _Roll_RA | 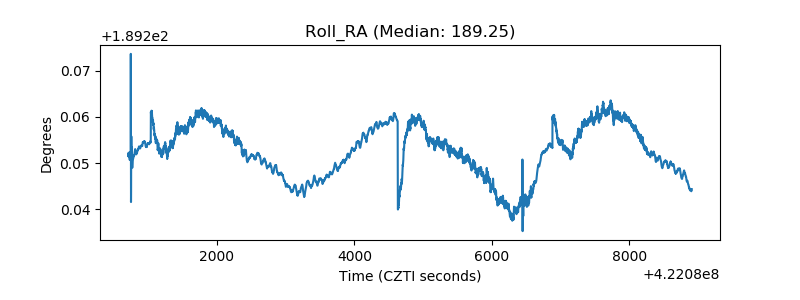 |
| Veto Counter | 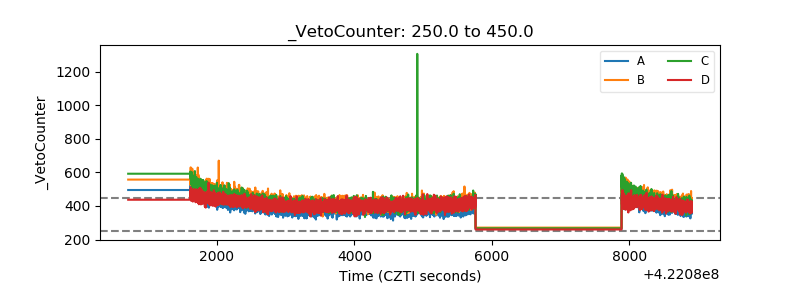 |