| Param | Original file | Final file |
|---|---|---|
| Filename | modeM0/AS1A12_011T42_9000005640_41288cztM0_level2.fits | modeM0/AS1A12_011T42_9000005640_41288cztM0_level2_quad_clean.evt |
| Size (bytes) | 384,393,600 | 84,821,760 |
| Size | 366.6 MB | 80.9 MB |
| Events in quadrant A | 2,850,547 | 597,529 |
| Events in quadrant B | 2,383,343 | 621,299 |
| Events in quadrant C | 2,936,709 | 559,191 |
| Events in quadrant D | 5,660,464 | 432,487 |
| Mode SS | |||
|---|---|---|---|
| Quadrant | BADHDUFLAG | Total packets | Discarded packets |
| A | 0 | 104 | 0 |
| B | 0 | 104 | 0 |
| C | 0 | 104 | 0 |
| D | 0 | 104 | 0 |
| Mode M9 | |||
|---|---|---|---|
| Quadrant | BADHDUFLAG | Total packets | Discarded packets |
| A | 0 | 39 | 0 |
| B | 0 | 39 | 0 |
| C | 0 | 39 | 0 |
| D | 0 | 40 | 0 |
| Mode M0 | |||
|---|---|---|---|
| Quadrant | BADHDUFLAG | Total packets | Discarded packets |
| A | 0 | 11258 | 3 |
| B | 0 | 10329 | 2 |
| C | 0 | 11720 | 2 |
| D | 0 | 20215 | 2 |
| Quadrant | Total seconds | Saturated seconds | Saturation percentage |
|---|---|---|---|
| A | 5109 | 13 | 0.254453% |
| B | 5109 | 7 | 0.137013% |
| C | 5109 | 184 | 3.601488% |
| D | 5109 | 1085 | 21.237033% |
Noise dominated data is calculated using 1-second bins in cleaned event files. If a bin has >2000 counts, and if more than 50% of those come from <1% of pixels, then it is considered to be noise-dominated and hence unusable.
| Quadrant | # 1 sec bins | Bins with >0 counts | Bins with >2000 counts | High rate bins dominated by noise | Noise dominated (total time) | Noise dominated (detector-on time) | Marked lightcurve |
|---|---|---|---|---|---|---|---|
| A | 7202 | 5110 | 4 | 4 | 0.06% | 0.08% | 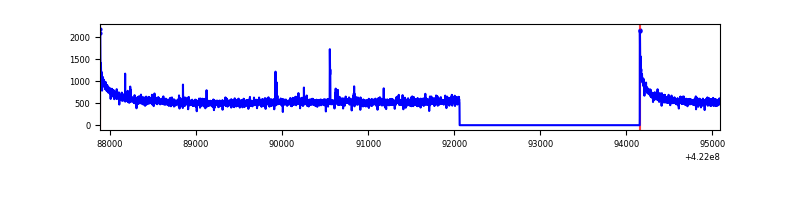 |
| B | 7202 | 5110 | 1 | 1 | 0.01% | 0.02% | 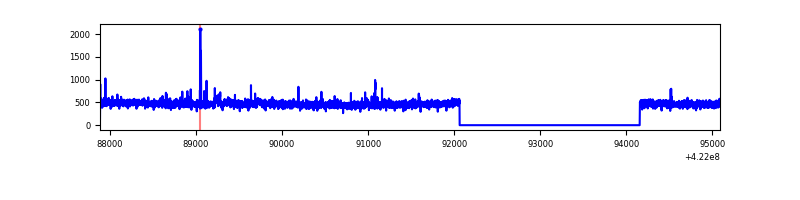 |
| C | 7202 | 5110 | 181 | 181 | 2.51% | 3.54% | 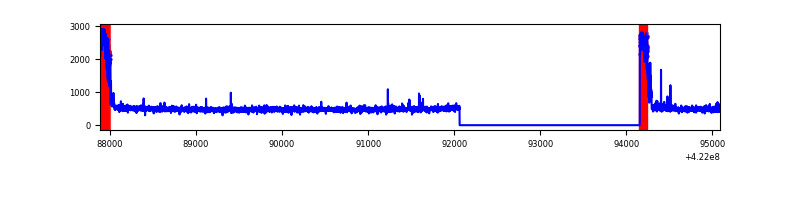 |
| D | 7202 | 5110 | 1100 | 1100 | 15.27% | 21.53% | 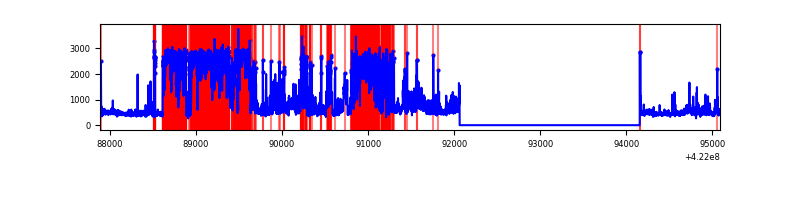 |
Top three noisy pixels from each quadrant. If the there are fewer than three noisy pixels in the level2.evt file, extra rows are filled as -1
| Pixel properties | Quadrant properties | ||||||
|---|---|---|---|---|---|---|---|
| Quadrant | DetID | PixID | Counts | Sigma | Mean | Median | Sigma |
| A | 10 | 83 | 493600 | 4044.19 | 594 | 583 | 121.9 |
| A | 12 | 189 | 42845 | 346.67 | 594 | 583 | 121.9 |
| A | 2 | 79 | 12763 | 99.91 | 594 | 583 | 121.9 |
| B | 0 | 229 | 47792 | 412.8 | 589 | 573 | 114.4 |
| B | 12 | 111 | 14454 | 121.35 | 589 | 573 | 114.4 |
| B | 11 | 111 | 13446 | 112.54 | 589 | 573 | 114.4 |
| C | 0 | 10 | 502987 | 3835.54 | 562 | 566 | 131.0 |
| C | 15 | 214 | 218687 | 1665.16 | 562 | 566 | 131.0 |
| C | 12 | 249 | 14911 | 109.51 | 562 | 566 | 131.0 |
| D | 1 | 52 | 2252289 | 17745.21 | 519 | 503 | 126.9 |
| D | 12 | 233 | 672646 | 5296.82 | 519 | 503 | 126.9 |
| D | 5 | 222 | 369274 | 2906.1 | 519 | 503 | 126.9 |
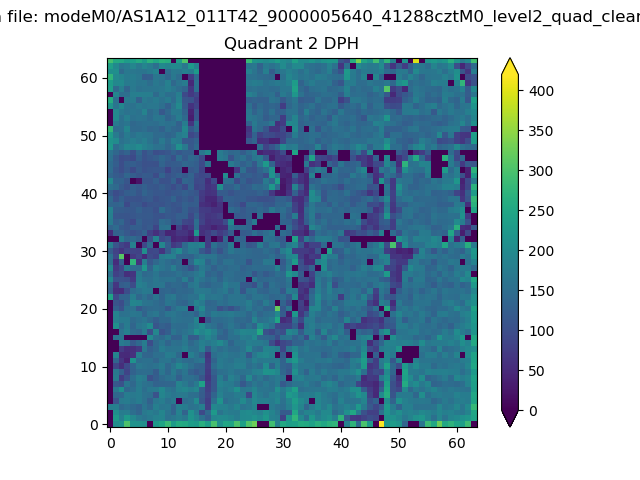
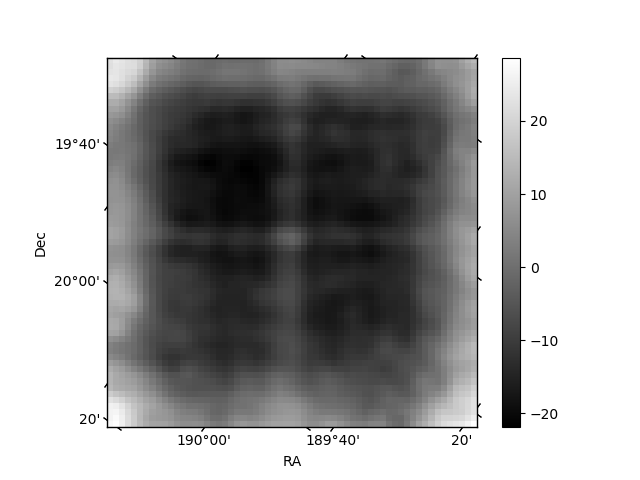
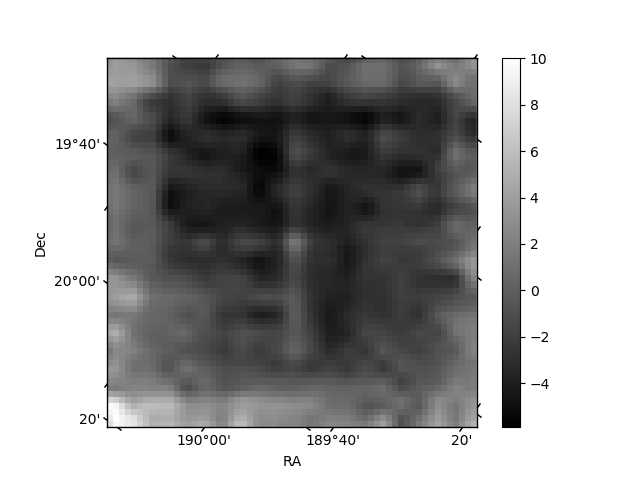
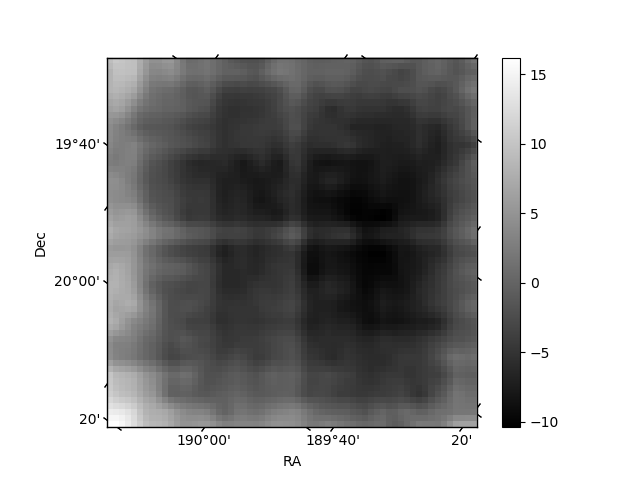
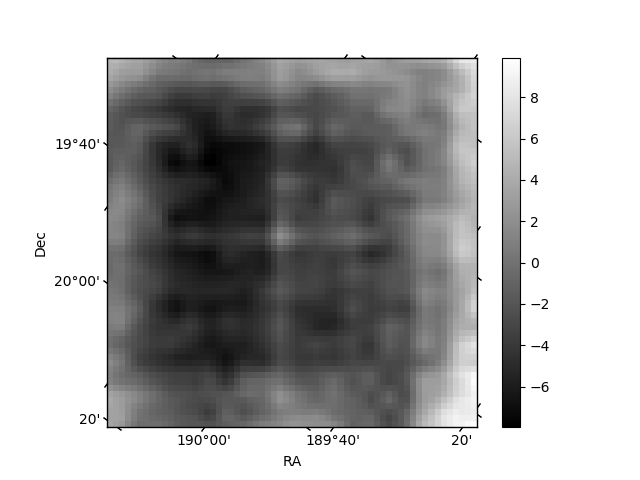
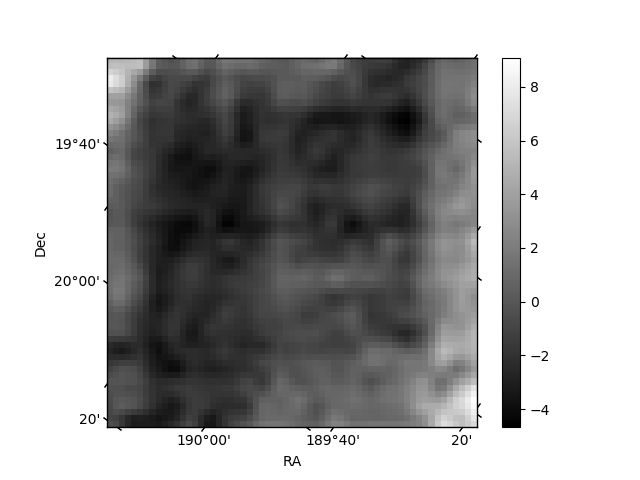
Histogram calculated using DETX and DETY for each event in the final _common_clean file
| Quadrant A | 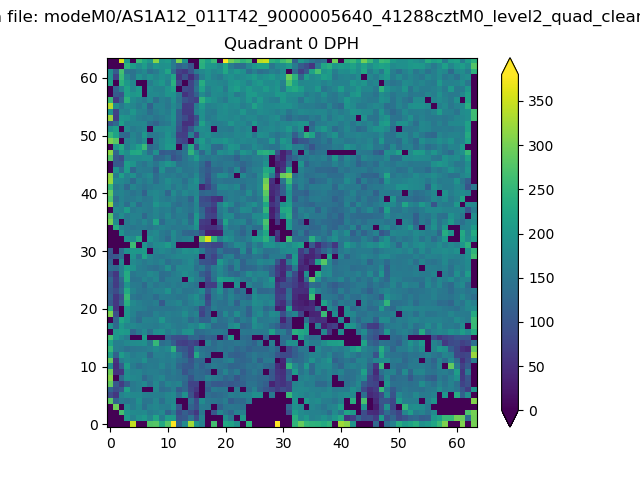 |
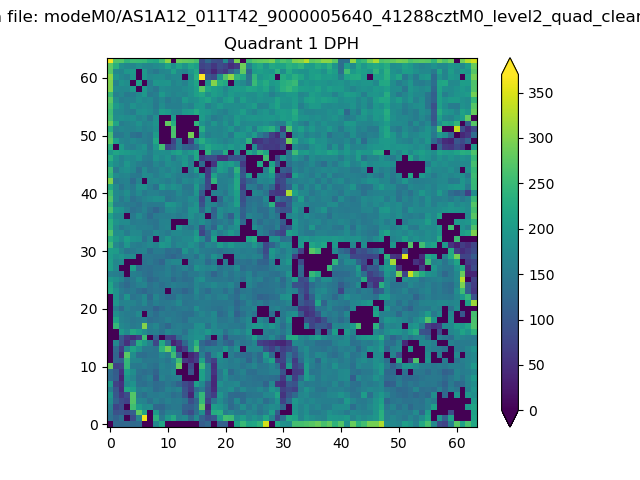 |
Quadrant B |
|---|---|---|---|
| Quadrant D | 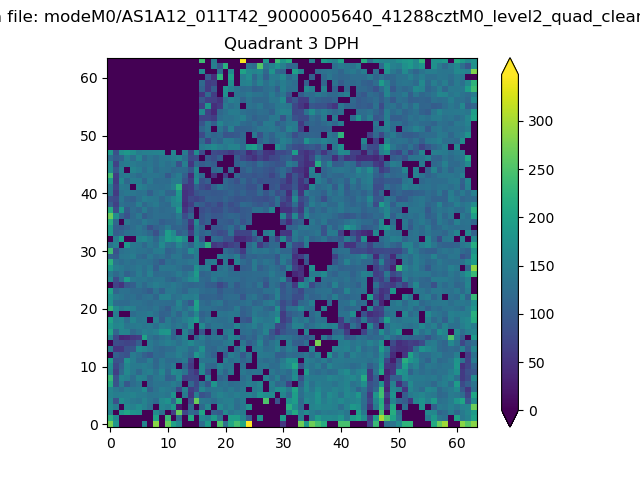 |
 |
Quadrant C |
| Plot type | Count rate plots | Images |
|---|---|---|
| Comparison with Poisson distribution Blue bars denote a histogram of data divided into 1 sec bins. Red curve is a Poisson curve with rate = median count rate of data. |
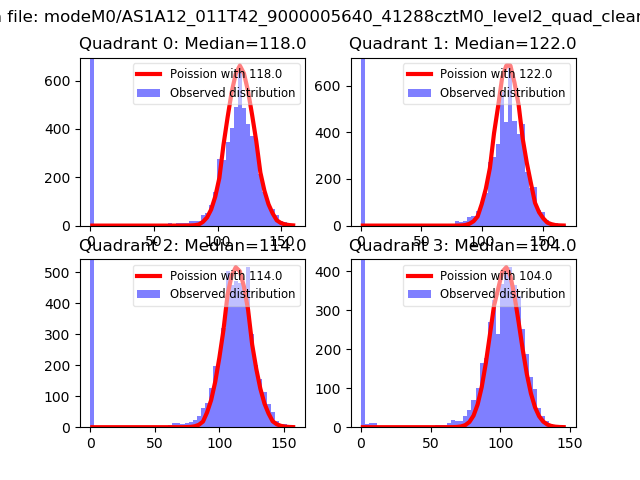 |
 |
| Quadrant-wise count rates Data is divided into 100 sec bins |
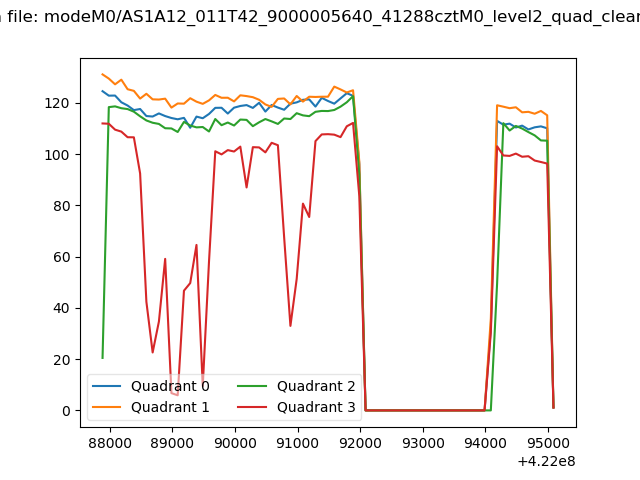 |
|
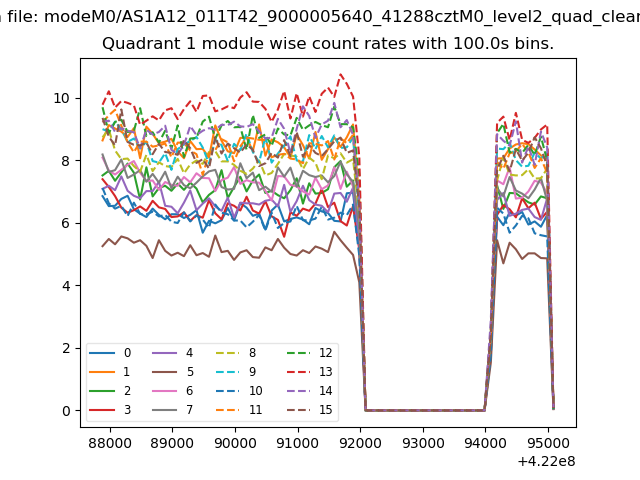
| Module-wise count rates for Quadrant A Data is divided into 100 sec bins |
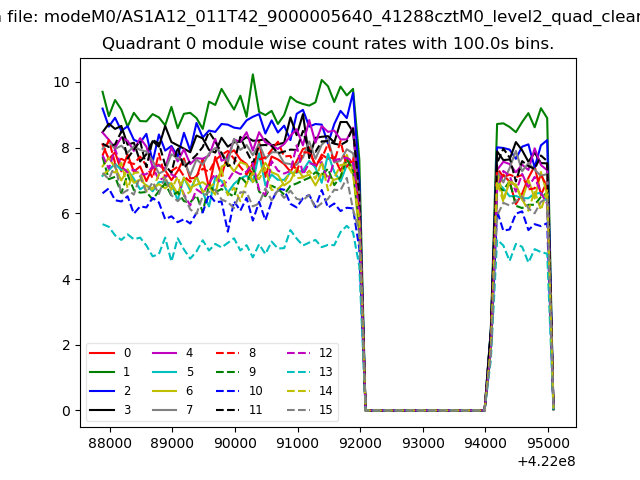 |
 |
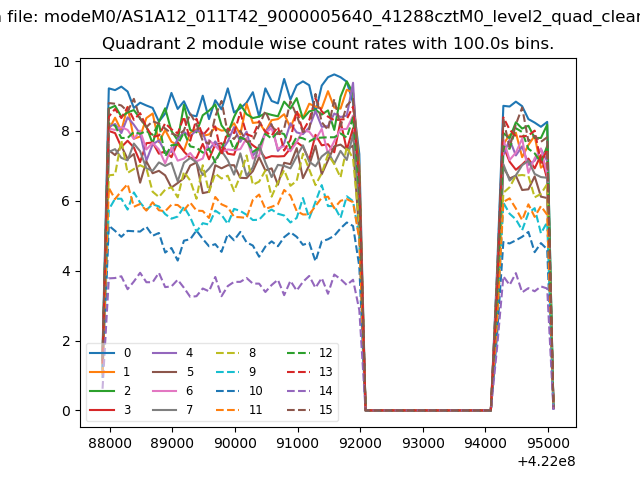
| Module-wise count rates for Quadrant B Data is divided into 100 sec bins |
 |
 |
| Module-wise count rates for Quadrant C Data is divided into 100 sec bins |
 |
 |
| Module-wise count rates for Quadrant D Data is divided into 100 sec bins |
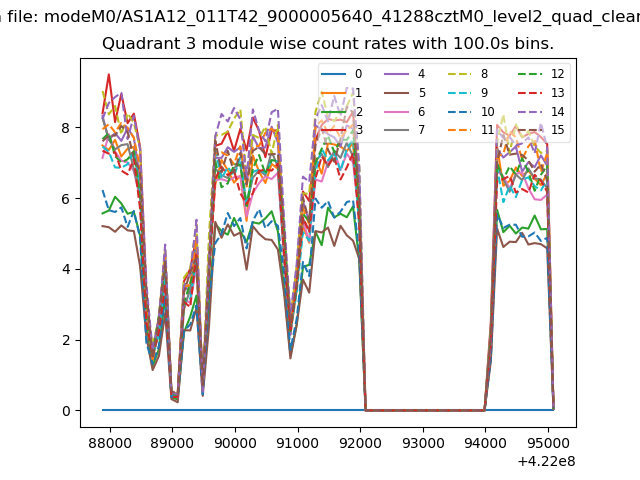 |
 |
| Parameter | Plot |
|---|---|
| CZT HV Monitor | 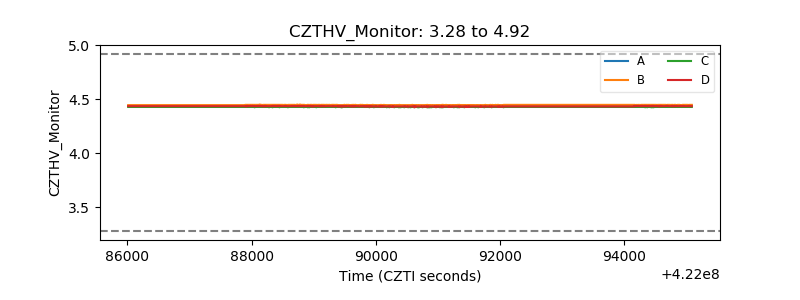 |
| D_VDD | 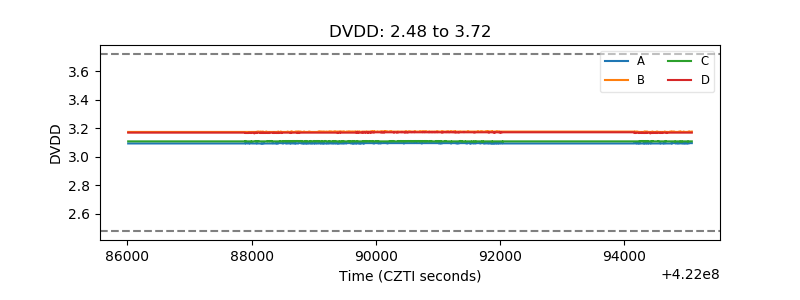 |
| Temperature 1 | 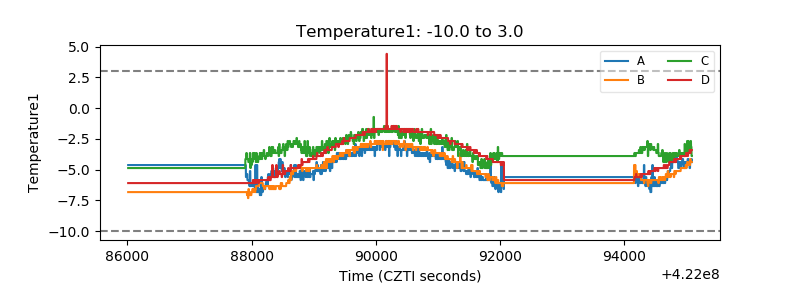 |
| Veto HV Monitor | 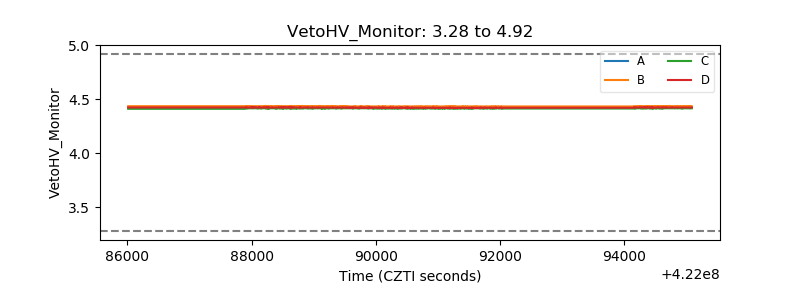 |
| Veto LLD | 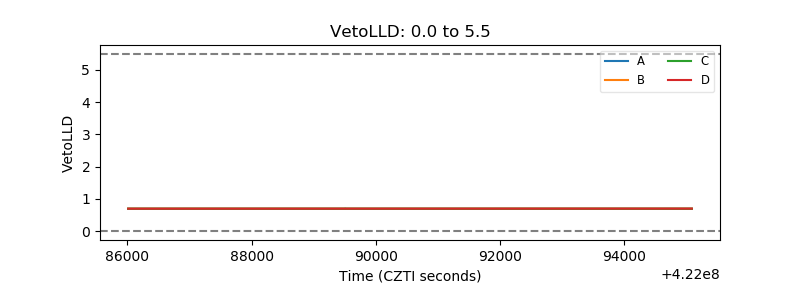 |
| Alpha Counter | 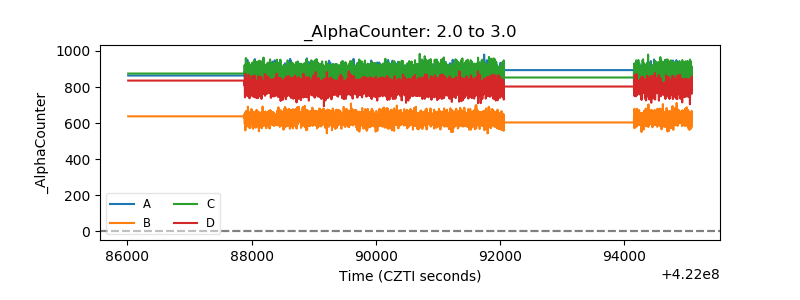 |
| _CPM_Rate | 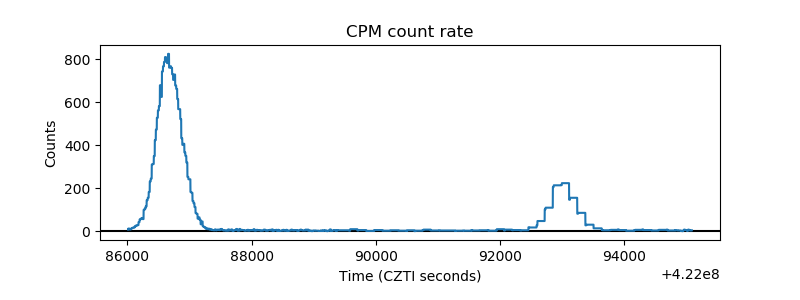 |
| CZT Counter | 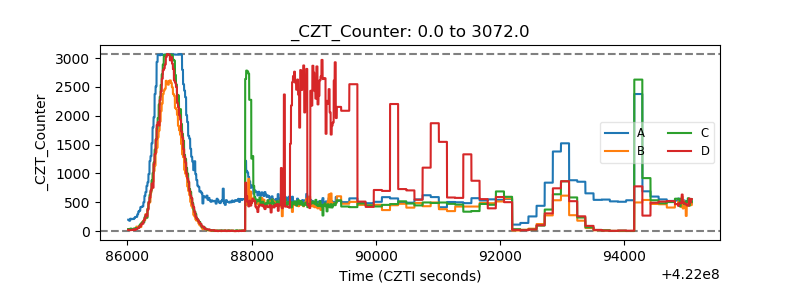 |
| +2.5 Volts monitor | 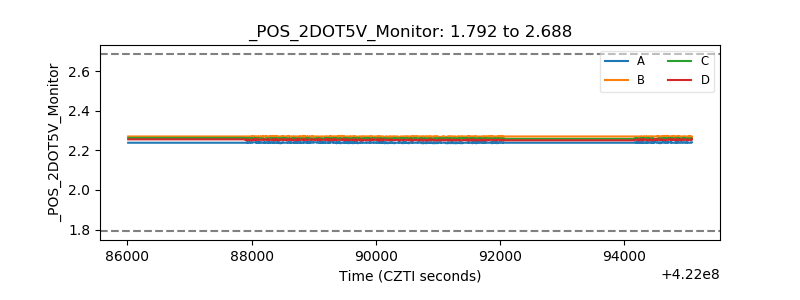 |
| +5 Volts monitor | 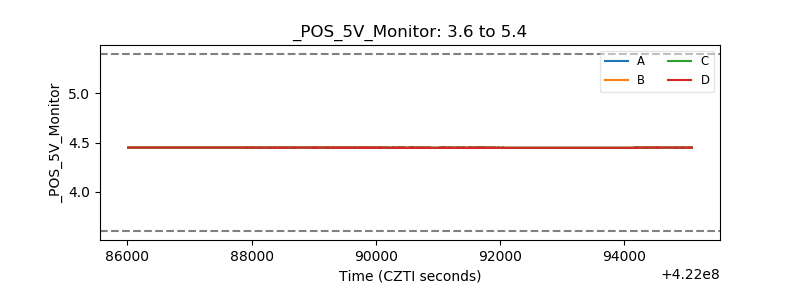 |
| _ROLL_ROT | 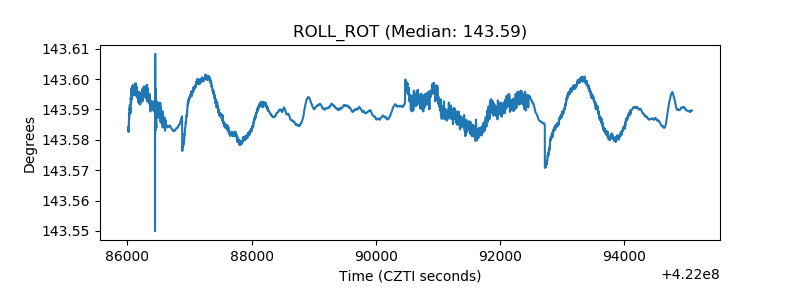 |
| _Roll_DEC | 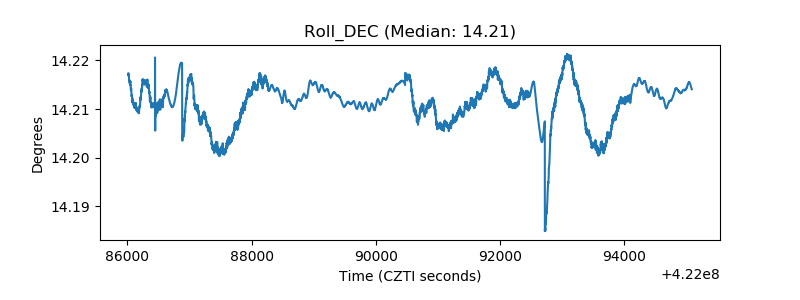 |
| _Roll_RA | 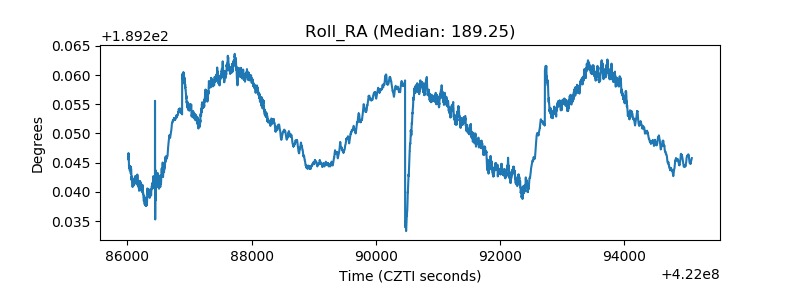 |
| Veto Counter | 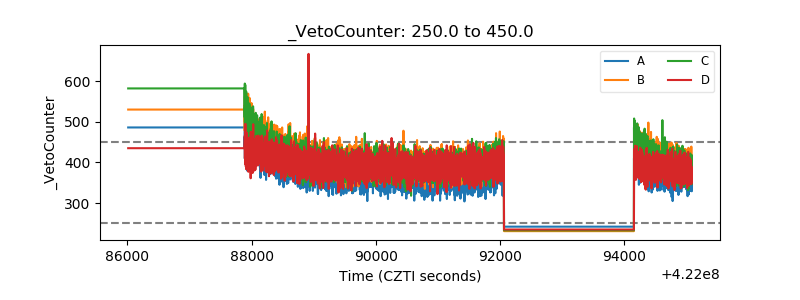 |