| Param | Original file | Final file |
|---|---|---|
| Filename | modeM0/AS1A12_011T42_9000005640_41289cztM0_level2.fits | modeM0/AS1A12_011T42_9000005640_41289cztM0_level2_quad_clean.evt |
| Size (bytes) | 323,009,280 | 89,763,840 |
| Size | 308.0 MB | 85.6 MB |
| Events in quadrant A | 2,891,691 | 609,967 |
| Events in quadrant B | 2,449,705 | 628,606 |
| Events in quadrant C | 2,982,233 | 570,317 |
| Events in quadrant D | 3,212,227 | 531,370 |
| Mode SS | |||
|---|---|---|---|
| Quadrant | BADHDUFLAG | Total packets | Discarded packets |
| A | 0 | 110 | 0 |
| B | 0 | 110 | 0 |
| C | 0 | 110 | 0 |
| D | 0 | 110 | 0 |
| Mode M9 | |||
|---|---|---|---|
| Quadrant | BADHDUFLAG | Total packets | Discarded packets |
| A | 0 | 31 | 0 |
| B | 0 | 31 | 0 |
| C | 0 | 31 | 0 |
| D | 0 | 32 | 0 |
| Mode M0 | |||
|---|---|---|---|
| Quadrant | BADHDUFLAG | Total packets | Discarded packets |
| A | 0 | 11640 | 3 |
| B | 0 | 10956 | 2 |
| C | 0 | 12142 | 2 |
| D | 0 | 13199 | 2 |
| Quadrant | Total seconds | Saturated seconds | Saturation percentage |
|---|---|---|---|
| A | 5399 | 15 | 0.277829% |
| B | 5399 | 9 | 0.166698% |
| C | 5399 | 176 | 3.259863% |
| D | 5399 | 132 | 2.444897% |
Noise dominated data is calculated using 1-second bins in cleaned event files. If a bin has >2000 counts, and if more than 50% of those come from <1% of pixels, then it is considered to be noise-dominated and hence unusable.
| Quadrant | # 1 sec bins | Bins with >0 counts | Bins with >2000 counts | High rate bins dominated by noise | Noise dominated (total time) | Noise dominated (detector-on time) | Marked lightcurve |
|---|---|---|---|---|---|---|---|
| A | 7312 | 5400 | 4 | 4 | 0.05% | 0.07% | 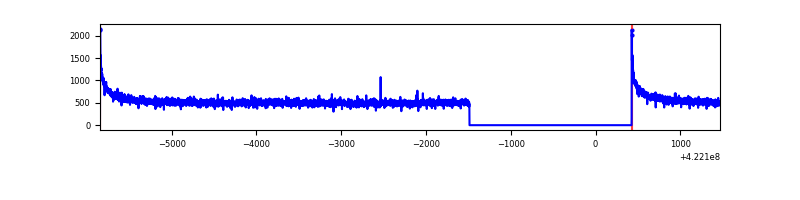 |
| B | 7312 | 5400 | 3 | 3 | 0.04% | 0.06% | 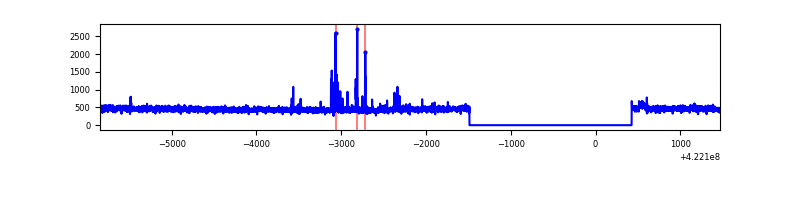 |
| C | 7312 | 5400 | 165 | 165 | 2.26% | 3.06% | 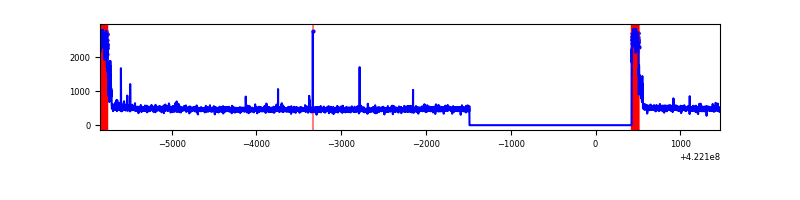 |
| D | 7312 | 5400 | 138 | 138 | 1.89% | 2.56% | 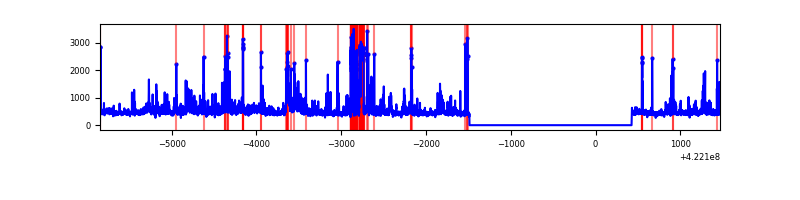 |
Top three noisy pixels from each quadrant. If the there are fewer than three noisy pixels in the level2.evt file, extra rows are filled as -1
| Pixel properties | Quadrant properties | ||||||
|---|---|---|---|---|---|---|---|
| Quadrant | DetID | PixID | Counts | Sigma | Mean | Median | Sigma |
| A | 10 | 83 | 508901 | 4011.7 | 613 | 601 | 126.7 |
| A | 12 | 189 | 8124 | 59.37 | 613 | 601 | 126.7 |
| A | 13 | 254 | 7115 | 51.41 | 613 | 601 | 126.7 |
| B | 5 | 255 | 45941 | 383.21 | 605 | 588 | 118.3 |
| B | 12 | 111 | 15299 | 124.3 | 605 | 588 | 118.3 |
| B | 11 | 111 | 13942 | 112.84 | 605 | 588 | 118.3 |
| C | 0 | 10 | 461470 | 3389.48 | 582 | 585 | 136.0 |
| C | 15 | 214 | 230893 | 1693.75 | 582 | 585 | 136.0 |
| C | 15 | 159 | 11191 | 78.0 | 582 | 585 | 136.0 |
| D | 7 | 223 | 283033 | 1952.34 | 587 | 569 | 144.7 |
| D | 1 | 52 | 178290 | 1228.38 | 587 | 569 | 144.7 |
| D | 2 | 249 | 148523 | 1022.63 | 587 | 569 | 144.7 |
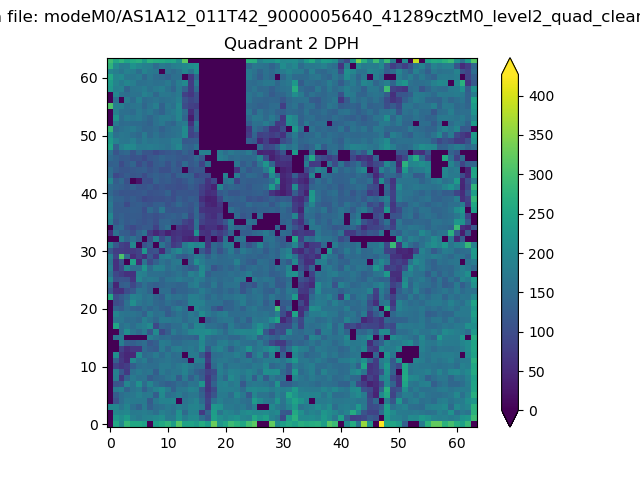
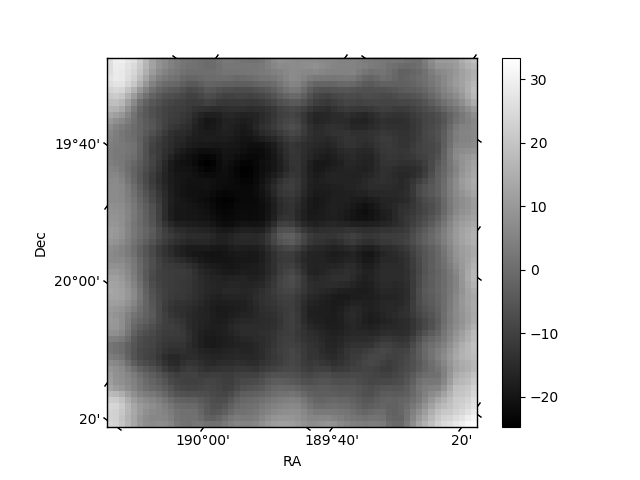
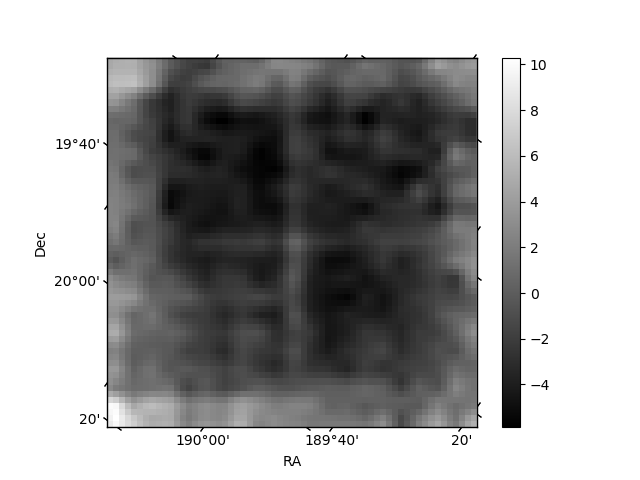
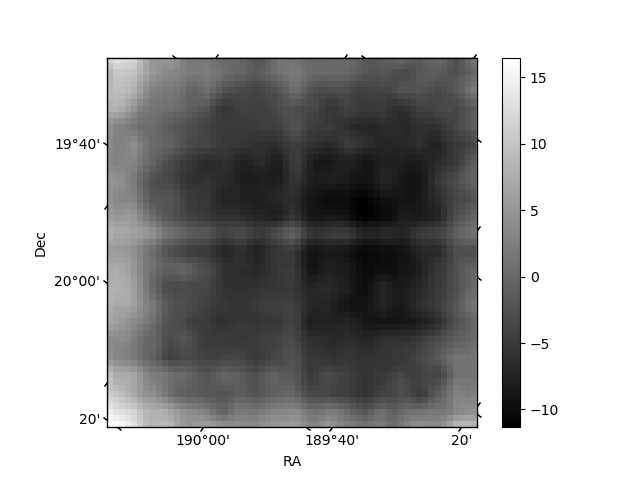
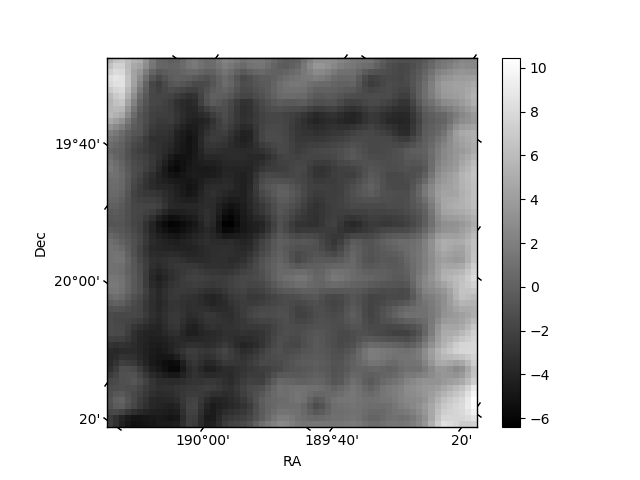
Histogram calculated using DETX and DETY for each event in the final _common_clean file
| Quadrant A | 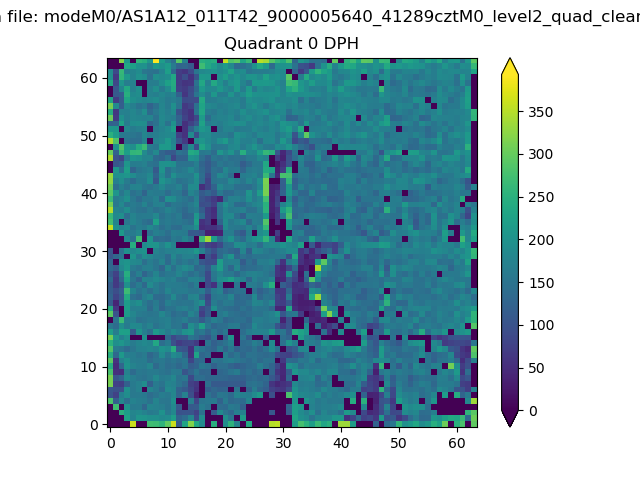 |
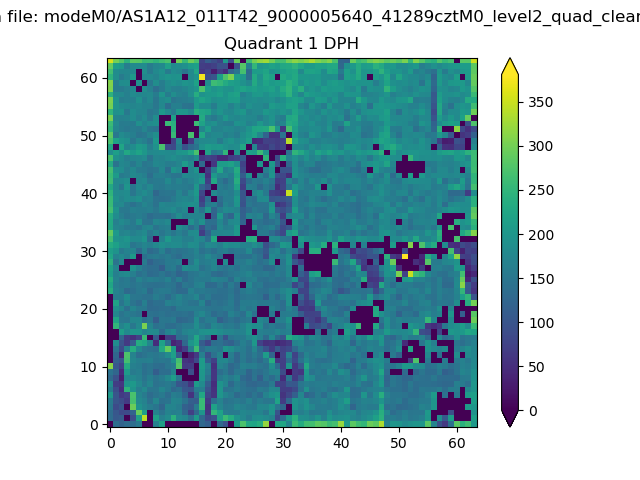 |
Quadrant B |
|---|---|---|---|
| Quadrant D | 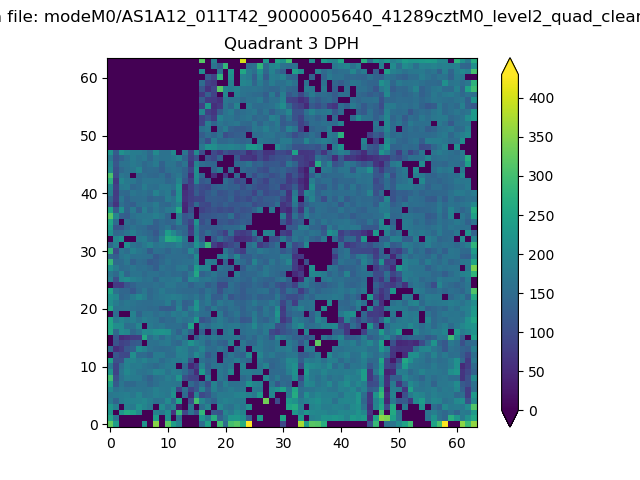 |
 |
Quadrant C |
| Plot type | Count rate plots | Images |
|---|---|---|
| Comparison with Poisson distribution Blue bars denote a histogram of data divided into 1 sec bins. Red curve is a Poisson curve with rate = median count rate of data. |
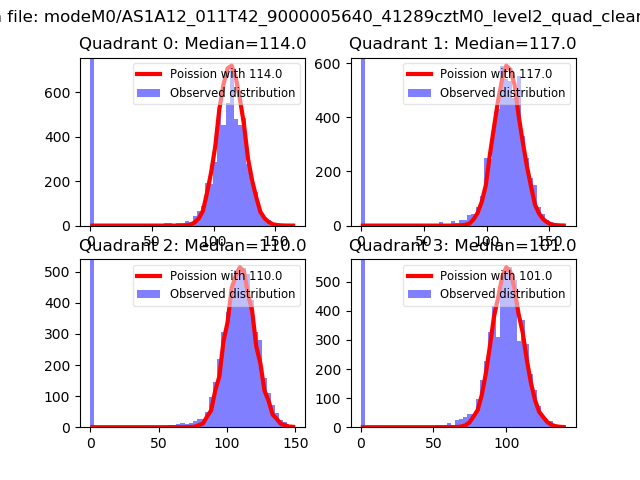 |
 |
| Quadrant-wise count rates Data is divided into 100 sec bins |
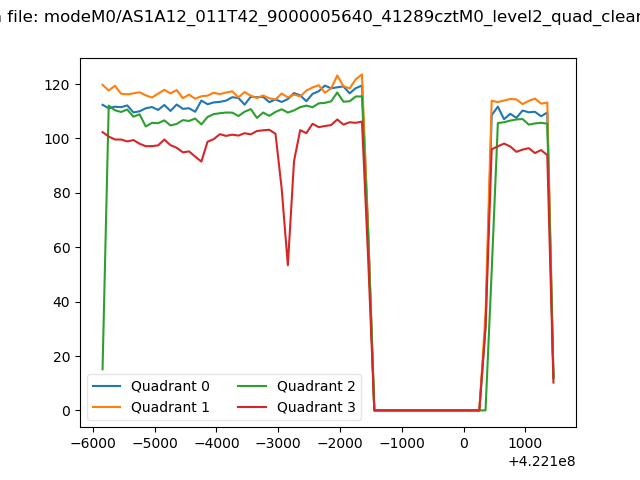 |
|
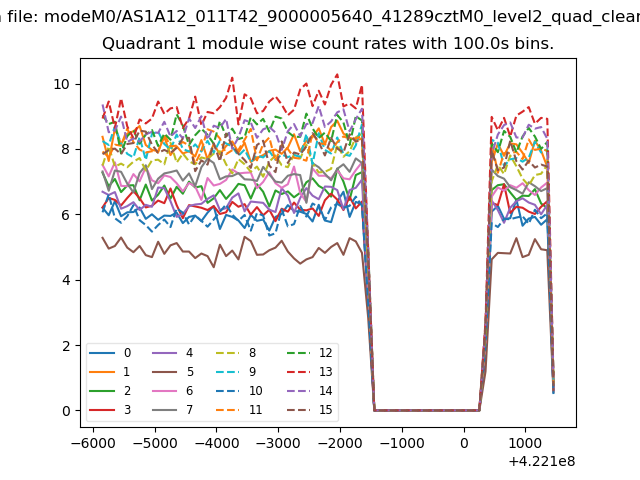
| Module-wise count rates for Quadrant A Data is divided into 100 sec bins |
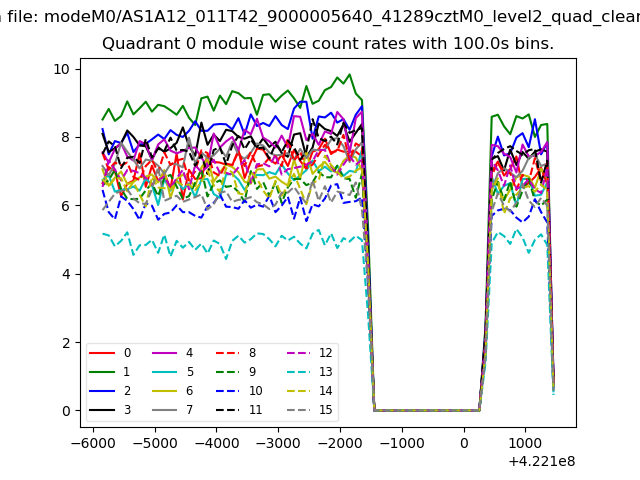 |
 |
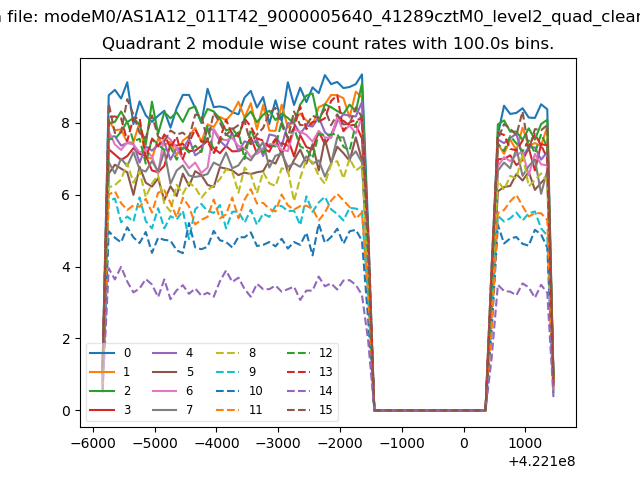
| Module-wise count rates for Quadrant B Data is divided into 100 sec bins |
 |
 |
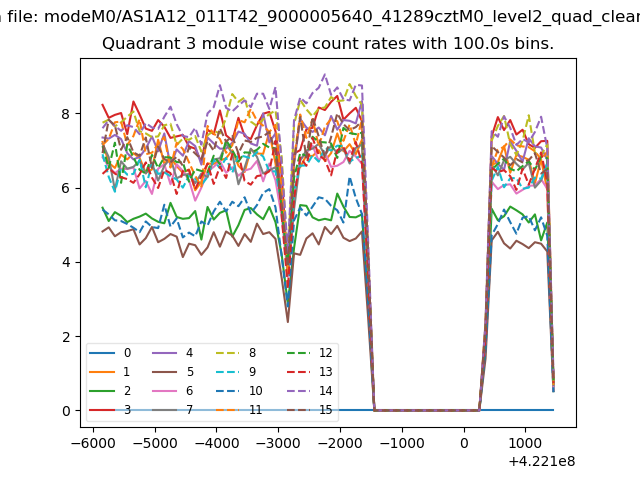
| Module-wise count rates for Quadrant C Data is divided into 100 sec bins |
 |
 |
| Module-wise count rates for Quadrant D Data is divided into 100 sec bins |
 |
 |
| Parameter | Plot |
|---|---|
| CZT HV Monitor | 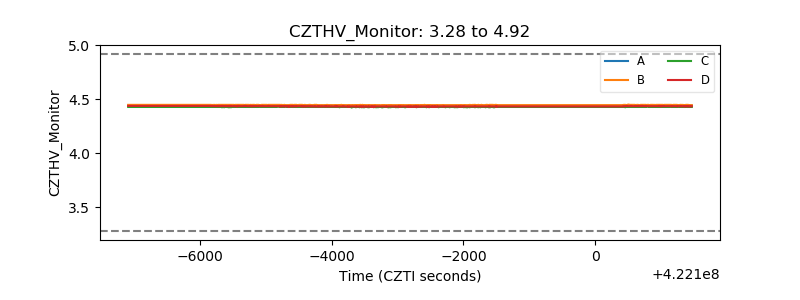 |
| D_VDD | 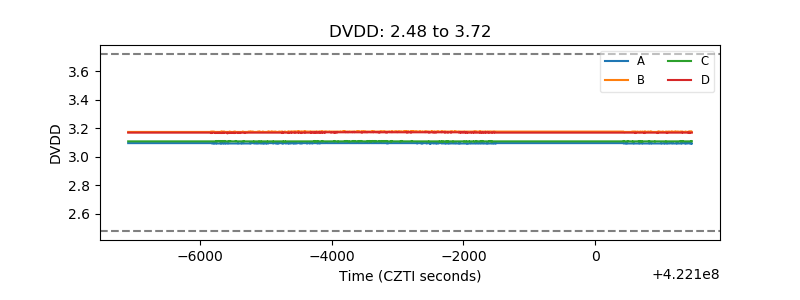 |
| Temperature 1 | 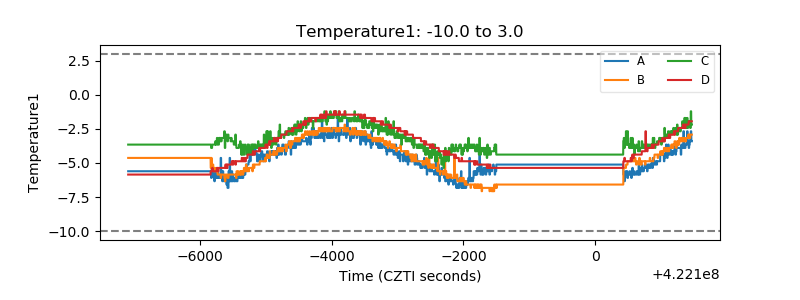 |
| Veto HV Monitor | 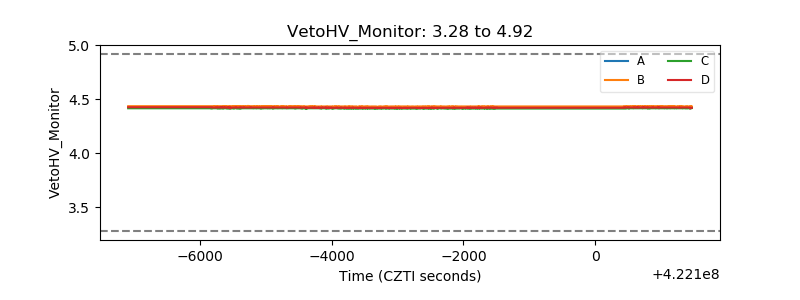 |
| Veto LLD | 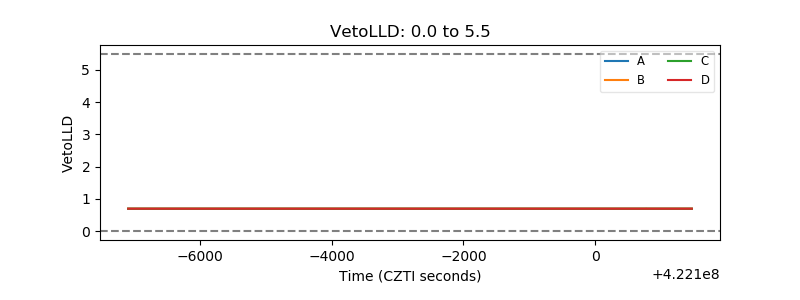 |
| Alpha Counter | 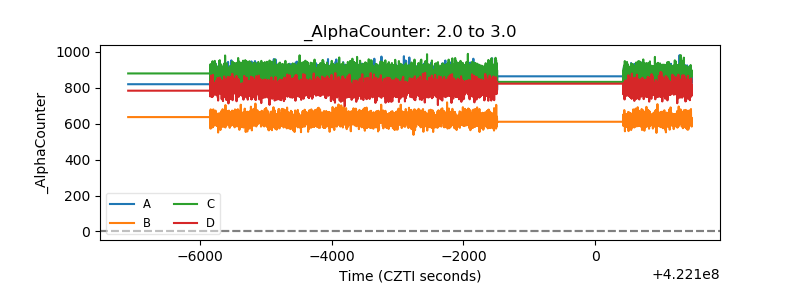 |
| _CPM_Rate | 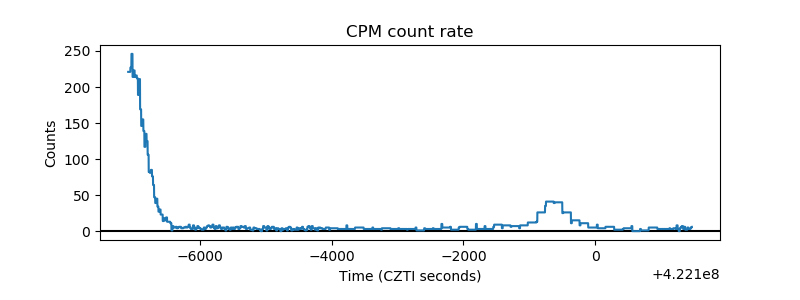 |
| CZT Counter | 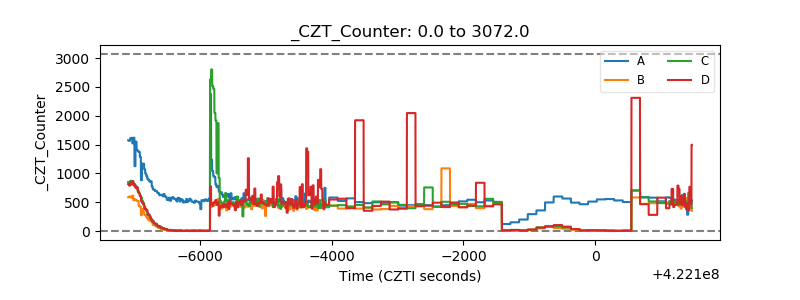 |
| +2.5 Volts monitor |  |
| +5 Volts monitor | 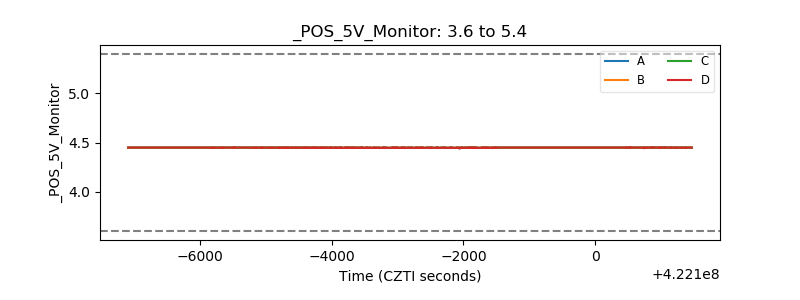 |
| _ROLL_ROT | 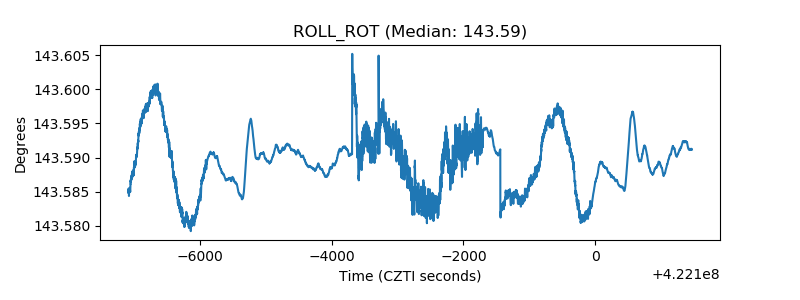 |
| _Roll_DEC | 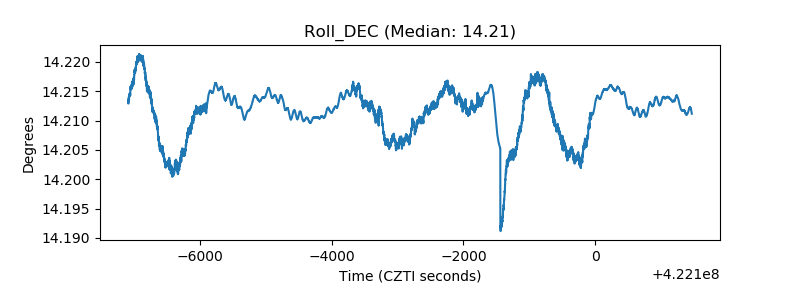 |
| _Roll_RA | 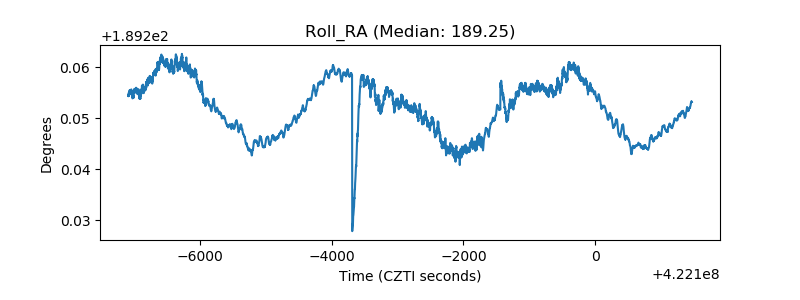 |
| Veto Counter | 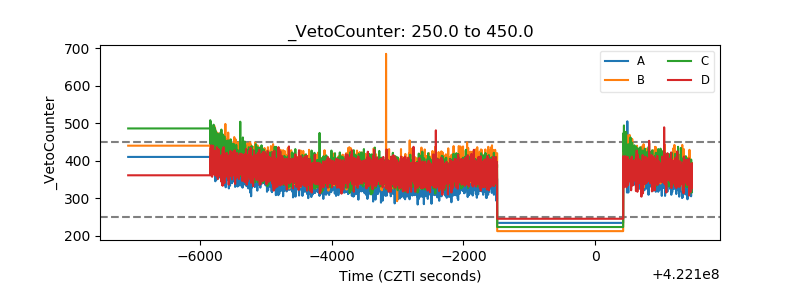 |