| Param | Original file | Final file |
|---|---|---|
| Filename | modeM0/AS1A12_011T42_9000005640_41290cztM0_level2.fits | modeM0/AS1A12_011T42_9000005640_41290cztM0_level2_quad_clean.evt |
| Size (bytes) | 344,848,320 | 95,650,560 |
| Size | 328.9 MB | 91.2 MB |
| Events in quadrant A | 3,104,497 | 647,637 |
| Events in quadrant B | 2,565,133 | 663,401 |
| Events in quadrant C | 3,222,134 | 607,849 |
| Events in quadrant D | 3,419,480 | 570,483 |
| Mode SS | |||
|---|---|---|---|
| Quadrant | BADHDUFLAG | Total packets | Discarded packets |
| A | 0 | 120 | 0 |
| B | 0 | 120 | 0 |
| C | 0 | 120 | 0 |
| D | 0 | 120 | 0 |
| Mode M9 | |||
|---|---|---|---|
| Quadrant | BADHDUFLAG | Total packets | Discarded packets |
| A | 0 | 34 | 0 |
| B | 0 | 34 | 0 |
| C | 0 | 34 | 0 |
| D | 0 | 34 | 0 |
| Mode M0 | |||
|---|---|---|---|
| Quadrant | BADHDUFLAG | Total packets | Discarded packets |
| A | 0 | 12594 | 3 |
| B | 0 | 11704 | 2 |
| C | 0 | 13170 | 2 |
| D | 0 | 14182 | 2 |
| Quadrant | Total seconds | Saturated seconds | Saturation percentage |
|---|---|---|---|
| A | 5825 | 14 | 0.240343% |
| B | 5825 | 7 | 0.120172% |
| C | 5825 | 192 | 3.296137% |
| D | 5825 | 149 | 2.557940% |
Noise dominated data is calculated using 1-second bins in cleaned event files. If a bin has >2000 counts, and if more than 50% of those come from <1% of pixels, then it is considered to be noise-dominated and hence unusable.
| Quadrant | # 1 sec bins | Bins with >0 counts | Bins with >2000 counts | High rate bins dominated by noise | Noise dominated (total time) | Noise dominated (detector-on time) | Marked lightcurve |
|---|---|---|---|---|---|---|---|
| A | 9291 | 5827 | 4 | 4 | 0.04% | 0.07% | 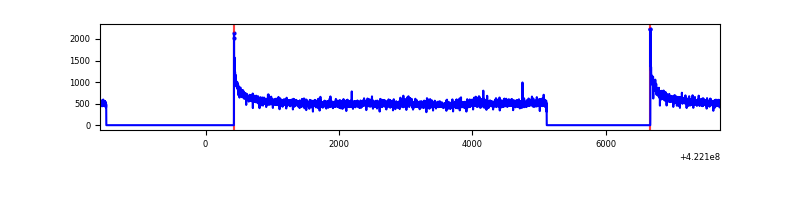 |
| B | 9291 | 5827 | 0 | 0 | 0.00% | 0.00% | 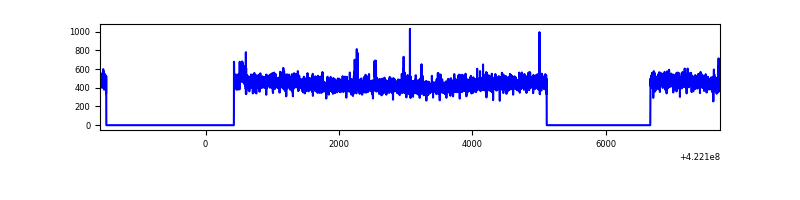 |
| C | 9291 | 5827 | 182 | 182 | 1.96% | 3.12% | 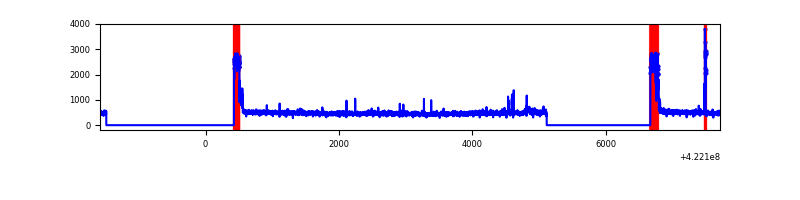 |
| D | 9290 | 5826 | 156 | 156 | 1.68% | 2.68% |  |
Top three noisy pixels from each quadrant. If the there are fewer than three noisy pixels in the level2.evt file, extra rows are filled as -1
| Pixel properties | Quadrant properties | ||||||
|---|---|---|---|---|---|---|---|
| Quadrant | DetID | PixID | Counts | Sigma | Mean | Median | Sigma |
| A | 10 | 83 | 538761 | 4027.23 | 652 | 640 | 133.6 |
| A | 12 | 189 | 29688 | 217.39 | 652 | 640 | 133.6 |
| A | 13 | 6 | 9055 | 62.98 | 652 | 640 | 133.6 |
| B | 12 | 111 | 16099 | 122.1 | 646 | 627 | 126.7 |
| B | 11 | 111 | 15173 | 114.79 | 646 | 627 | 126.7 |
| B | 14 | 111 | 14385 | 108.58 | 646 | 627 | 126.7 |
| C | 0 | 10 | 476531 | 3262.59 | 622 | 627 | 145.9 |
| C | 15 | 214 | 246438 | 1685.17 | 622 | 627 | 145.9 |
| C | 12 | 249 | 63253 | 429.34 | 622 | 627 | 145.9 |
| D | 2 | 249 | 348523 | 2233.32 | 630 | 612 | 155.8 |
| D | 13 | 249 | 267496 | 1713.19 | 630 | 612 | 155.8 |
| D | 1 | 52 | 200379 | 1282.35 | 630 | 612 | 155.8 |
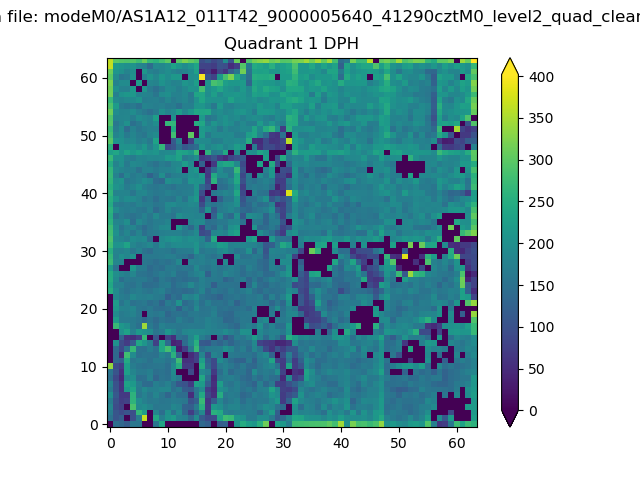
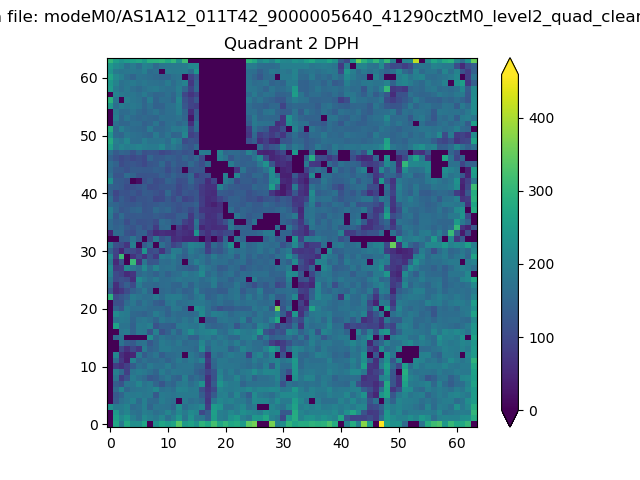
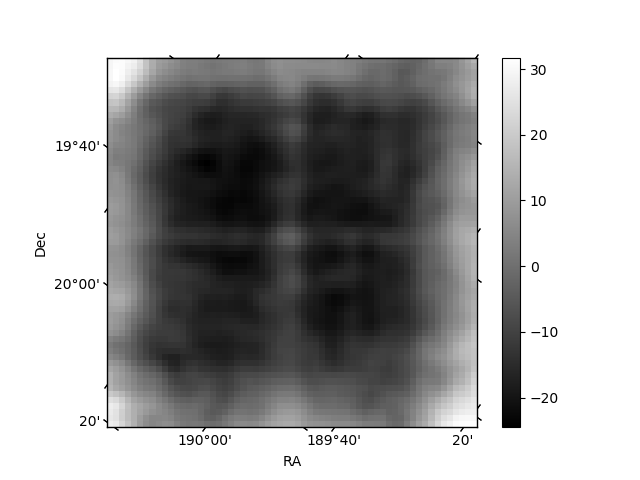
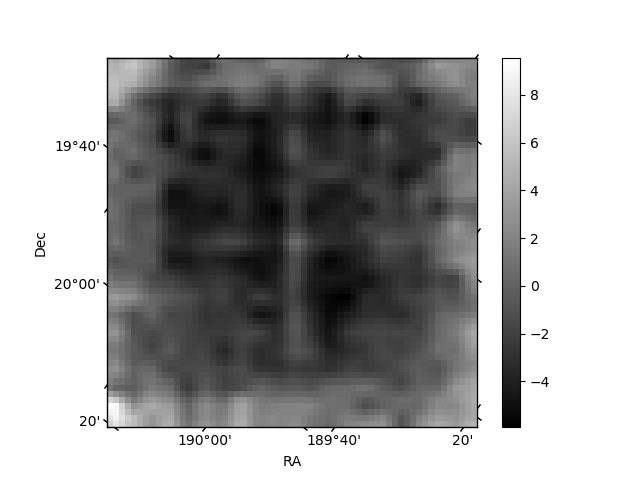
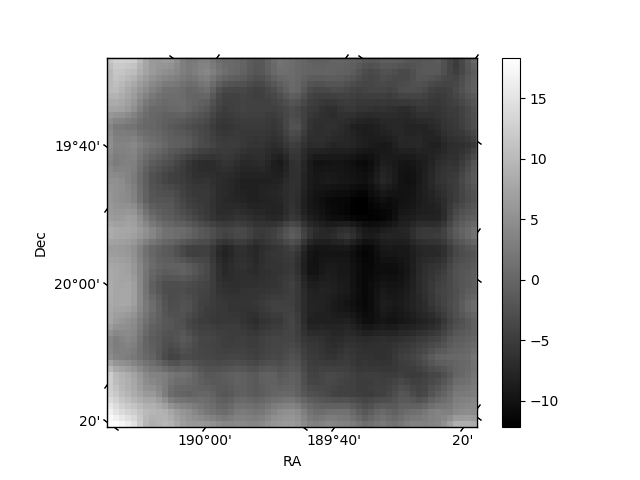
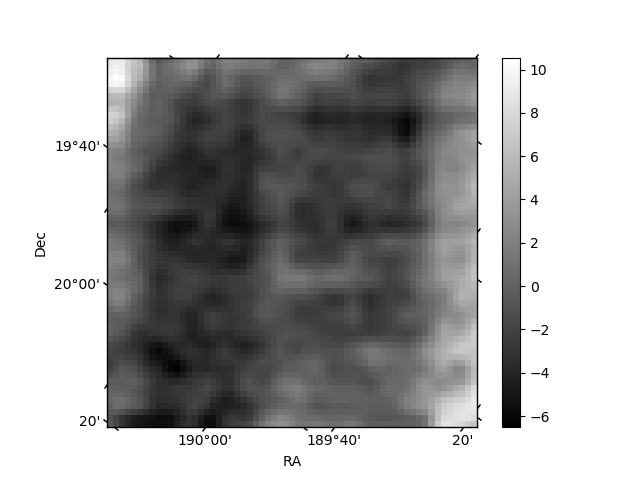
Histogram calculated using DETX and DETY for each event in the final _common_clean file
| Quadrant A | 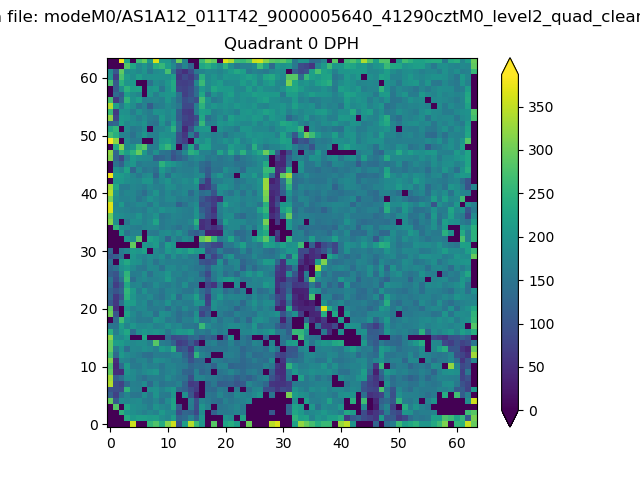 |
 |
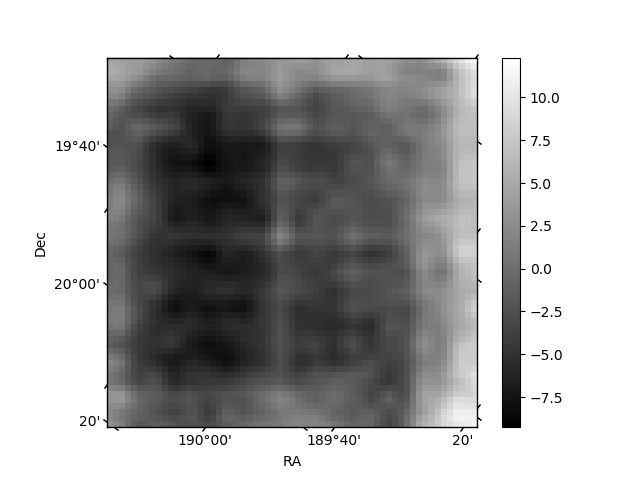
Quadrant B |
|---|---|---|---|
| Quadrant D | 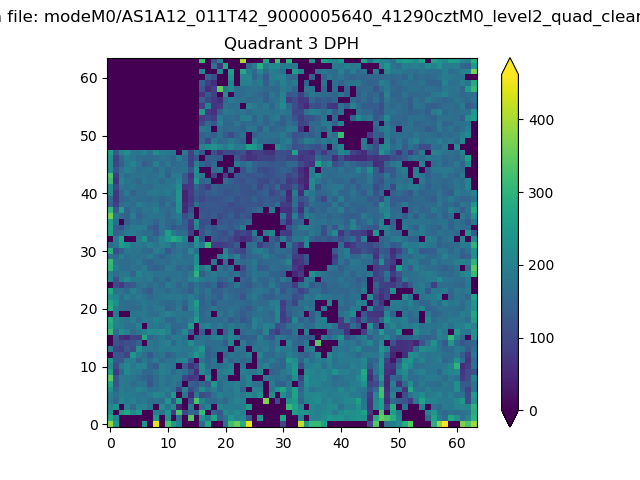 |
 |
Quadrant C |
| Plot type | Count rate plots | Images |
|---|---|---|
| Comparison with Poisson distribution Blue bars denote a histogram of data divided into 1 sec bins. Red curve is a Poisson curve with rate = median count rate of data. |
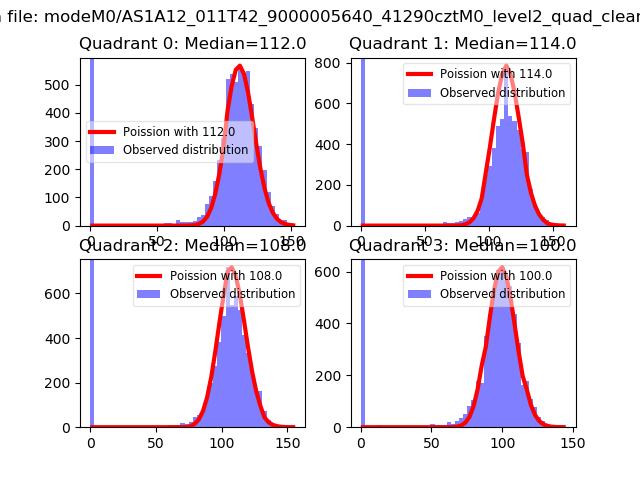 |
 |
| Quadrant-wise count rates Data is divided into 100 sec bins |
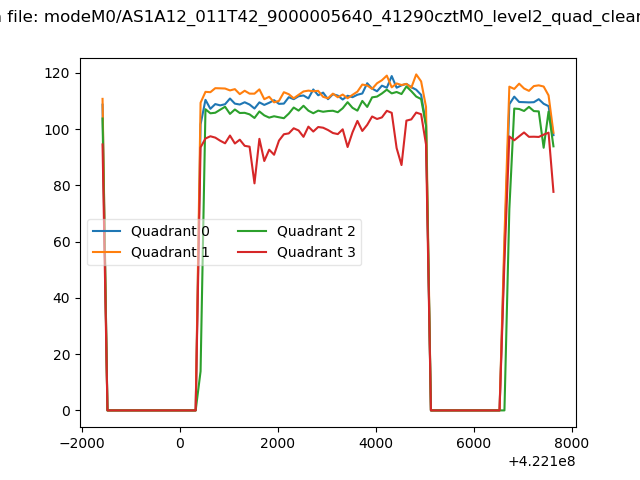 |
|
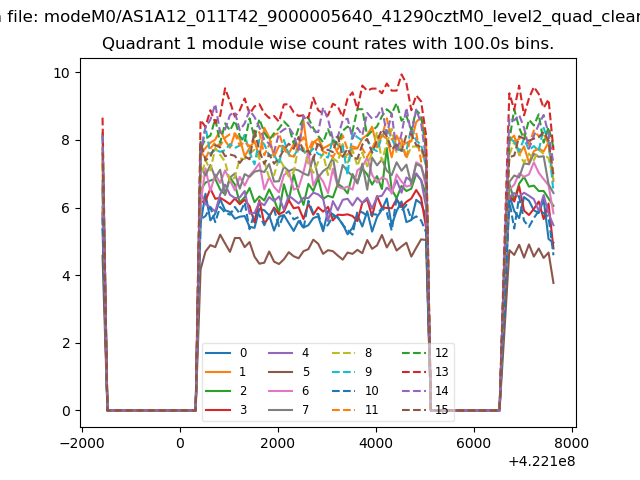
| Module-wise count rates for Quadrant A Data is divided into 100 sec bins |
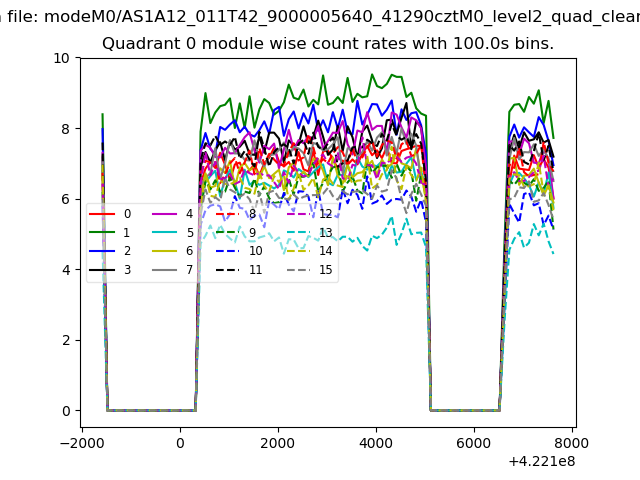 |
 |
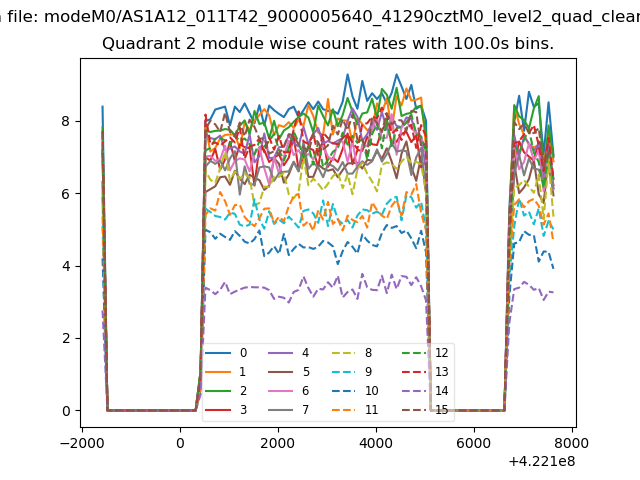
| Module-wise count rates for Quadrant B Data is divided into 100 sec bins |
 |
 |
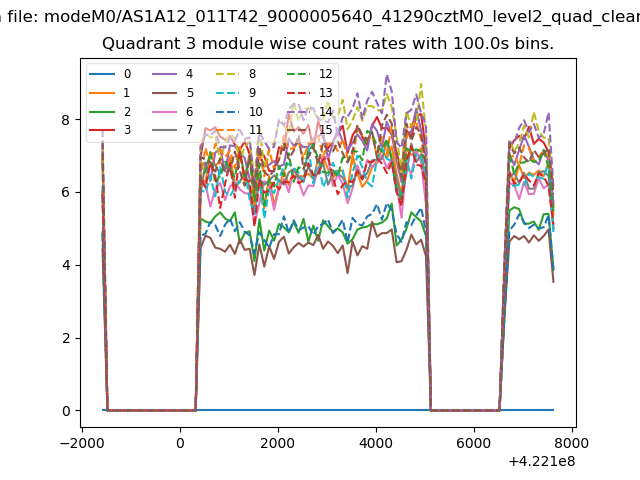
| Module-wise count rates for Quadrant C Data is divided into 100 sec bins |
 |
 |
| Module-wise count rates for Quadrant D Data is divided into 100 sec bins |
 |
 |
| Parameter | Plot |
|---|---|
| CZT HV Monitor | 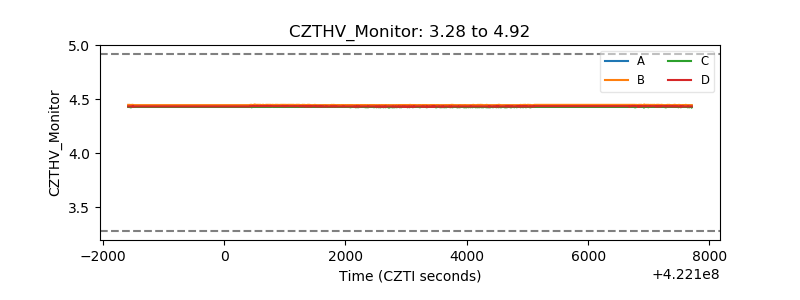 |
| D_VDD | 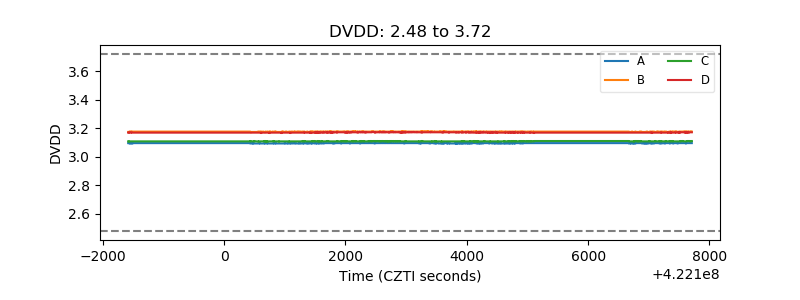 |
| Temperature 1 | 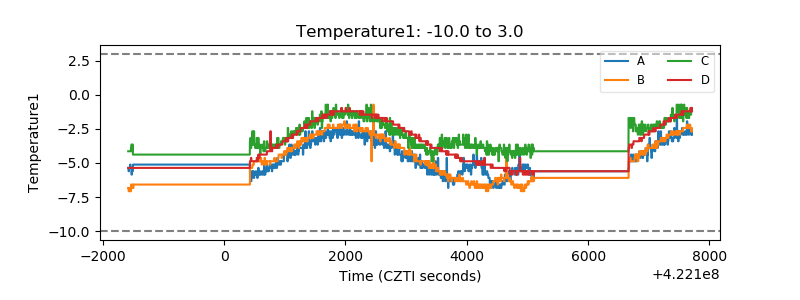 |
| Veto HV Monitor | 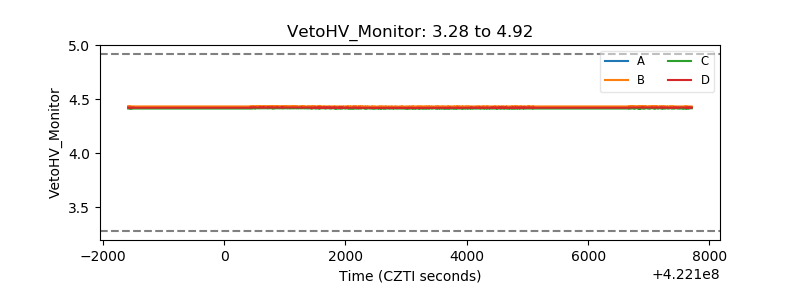 |
| Veto LLD | 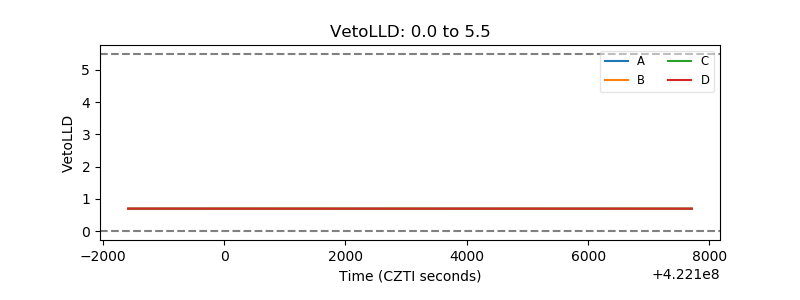 |
| Alpha Counter |  |
| _CPM_Rate |  |
| CZT Counter | 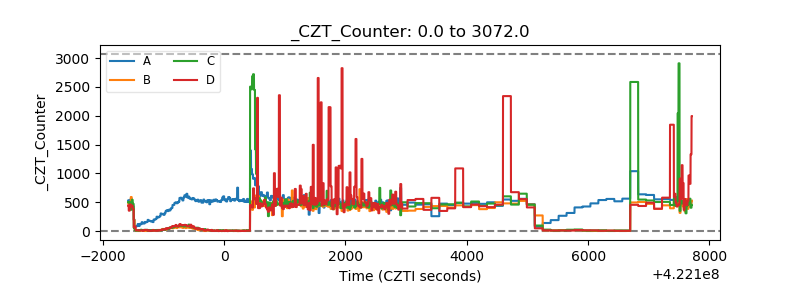 |
| +2.5 Volts monitor | 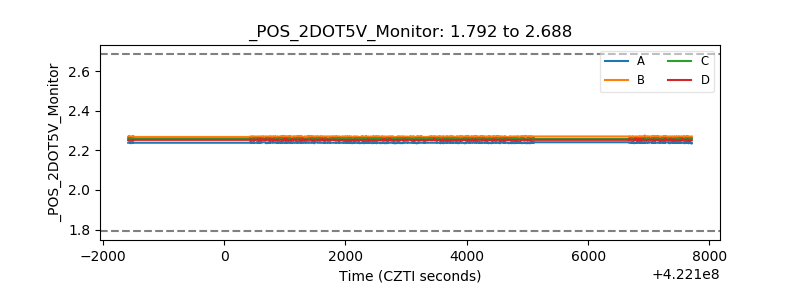 |
| +5 Volts monitor |  |
| _ROLL_ROT | 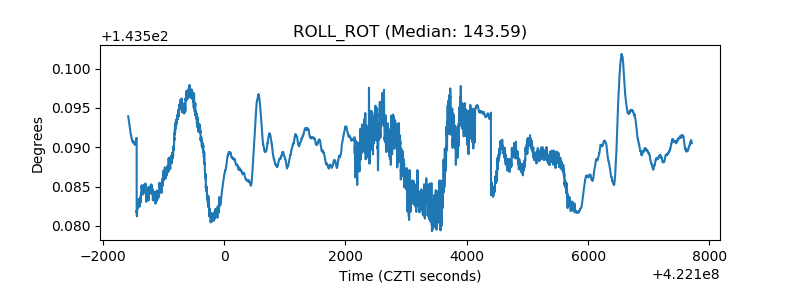 |
| _Roll_DEC | 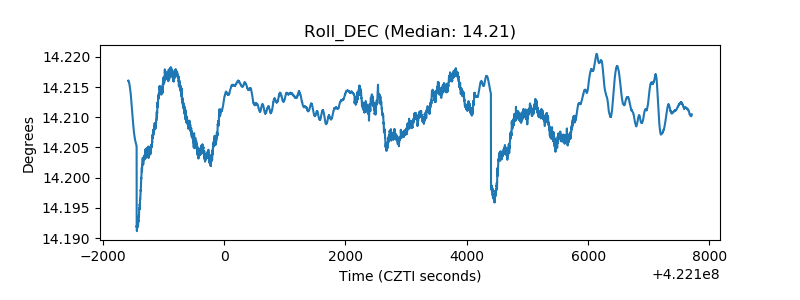 |
| _Roll_RA | 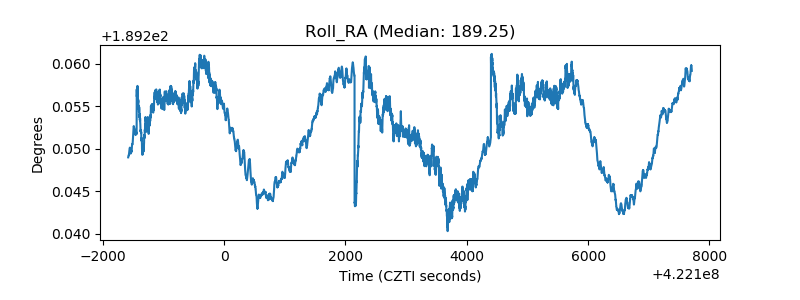 |
| Veto Counter | 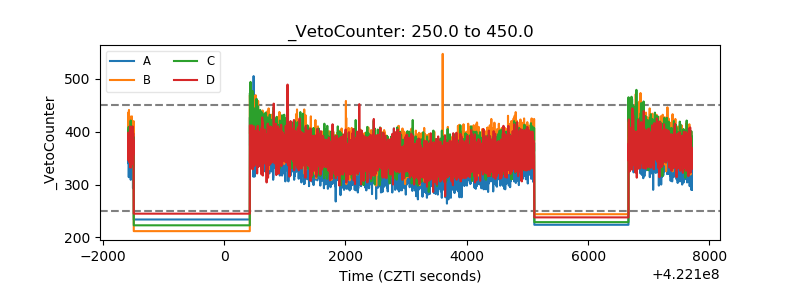 |