| Param | Original file | Final file |
|---|---|---|
| Filename | modeM0/AS1A12_011T42_9000005640_41291cztM0_level2.fits | modeM0/AS1A12_011T42_9000005640_41291cztM0_level2_quad_clean.evt |
| Size (bytes) | 356,175,360 | 96,615,360 |
| Size | 339.7 MB | 92.1 MB |
| Events in quadrant A | 3,159,596 | 651,705 |
| Events in quadrant B | 2,670,224 | 666,192 |
| Events in quadrant C | 3,247,372 | 616,845 |
| Events in quadrant D | 3,644,691 | 575,997 |
| Mode SS | |||
|---|---|---|---|
| Quadrant | BADHDUFLAG | Total packets | Discarded packets |
| A | 0 | 120 | 0 |
| B | 0 | 120 | 0 |
| C | 0 | 120 | 0 |
| D | 0 | 120 | 0 |
| Mode M9 | |||
|---|---|---|---|
| Quadrant | BADHDUFLAG | Total packets | Discarded packets |
| A | 0 | 15 | 0 |
| B | 0 | 15 | 0 |
| C | 0 | 15 | 0 |
| D | 0 | 16 | 0 |
| Mode M0 | |||
|---|---|---|---|
| Quadrant | BADHDUFLAG | Total packets | Discarded packets |
| A | 0 | 12917 | 3 |
| B | 0 | 12049 | 2 |
| C | 0 | 13341 | 2 |
| D | 0 | 14932 | 2 |
| Quadrant | Total seconds | Saturated seconds | Saturation percentage |
|---|---|---|---|
| A | 5937 | 12 | 0.202122% |
| B | 5937 | 5 | 0.084218% |
| C | 5937 | 183 | 3.082365% |
| D | 5937 | 158 | 2.661277% |
Noise dominated data is calculated using 1-second bins in cleaned event files. If a bin has >2000 counts, and if more than 50% of those come from <1% of pixels, then it is considered to be noise-dominated and hence unusable.
| Quadrant | # 1 sec bins | Bins with >0 counts | Bins with >2000 counts | High rate bins dominated by noise | Noise dominated (total time) | Noise dominated (detector-on time) | Marked lightcurve |
|---|---|---|---|---|---|---|---|
| A | 7280 | 5938 | 3 | 3 | 0.04% | 0.05% | 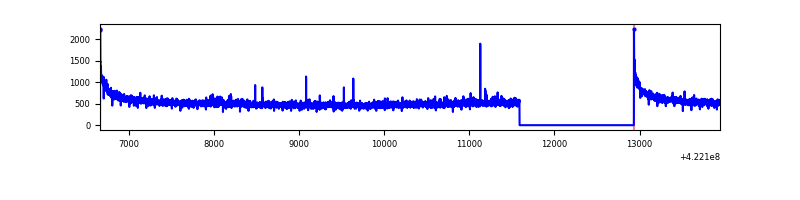 |
| B | 7280 | 5938 | 0 | 0 | 0.00% | 0.00% | 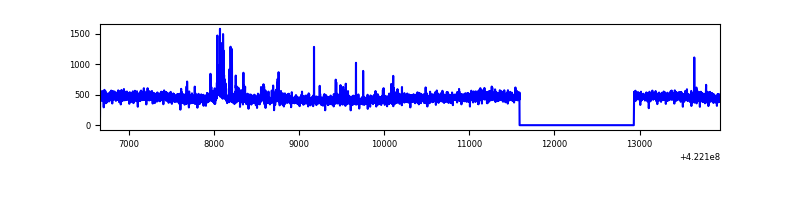 |
| C | 7280 | 5938 | 172 | 172 | 2.36% | 2.90% | 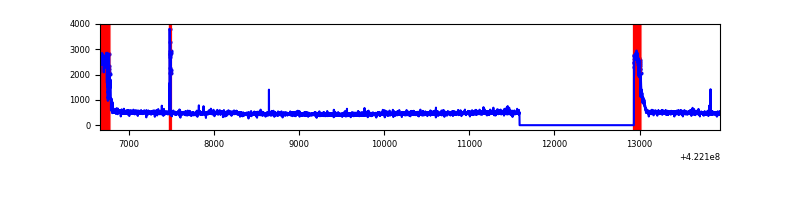 |
| D | 7280 | 5938 | 156 | 156 | 2.14% | 2.63% | 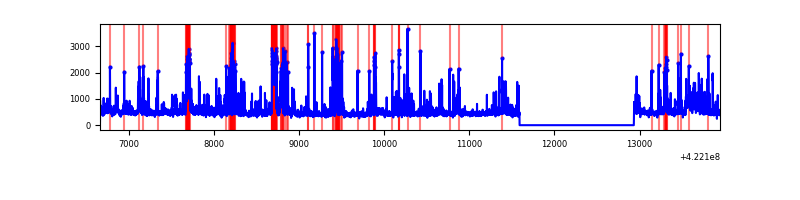 |
Top three noisy pixels from each quadrant. If the there are fewer than three noisy pixels in the level2.evt file, extra rows are filled as -1
| Pixel properties | Quadrant properties | ||||||
|---|---|---|---|---|---|---|---|
| Quadrant | DetID | PixID | Counts | Sigma | Mean | Median | Sigma |
| A | 10 | 83 | 559797 | 4112.97 | 661 | 646 | 135.9 |
| A | 12 | 189 | 29036 | 208.83 | 661 | 646 | 135.9 |
| A | 13 | 6 | 11957 | 83.2 | 661 | 646 | 135.9 |
| B | 0 | 186 | 41889 | 319.67 | 654 | 634 | 129.1 |
| B | 0 | 245 | 33543 | 255.0 | 654 | 634 | 129.1 |
| B | 12 | 111 | 16482 | 122.8 | 654 | 634 | 129.1 |
| C | 0 | 10 | 469360 | 3158.52 | 631 | 636 | 148.4 |
| C | 15 | 214 | 251563 | 1690.88 | 631 | 636 | 148.4 |
| C | 12 | 249 | 42493 | 282.06 | 631 | 636 | 148.4 |
| D | 2 | 249 | 474139 | 3030.2 | 636 | 620 | 156.3 |
| D | 1 | 47 | 340457 | 2174.73 | 636 | 620 | 156.3 |
| D | 13 | 249 | 148164 | 944.18 | 636 | 620 | 156.3 |
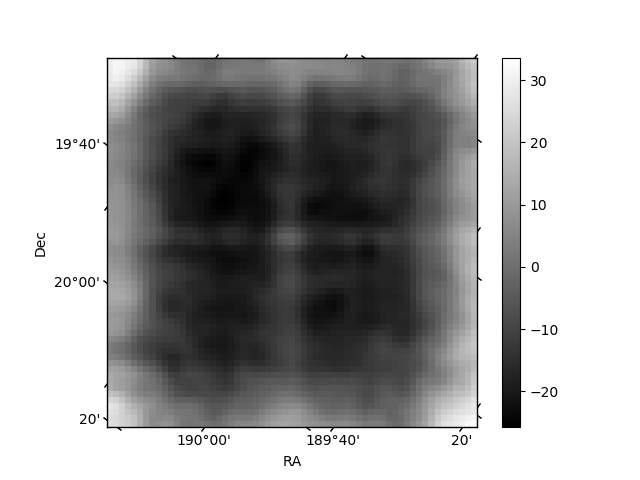
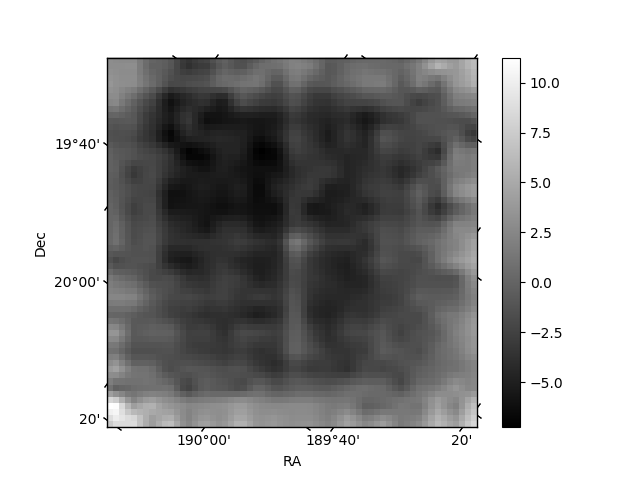
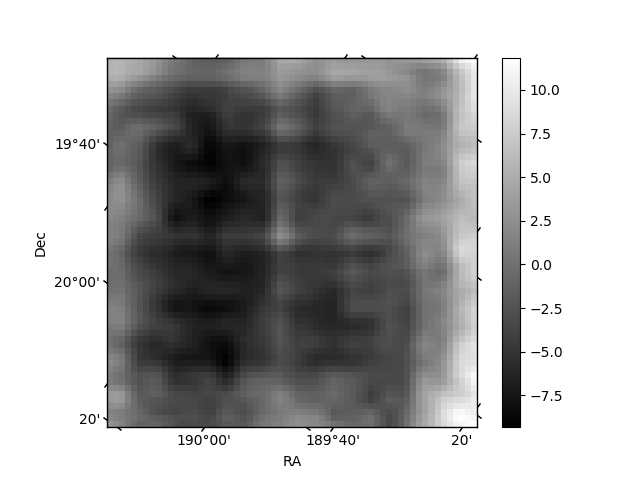
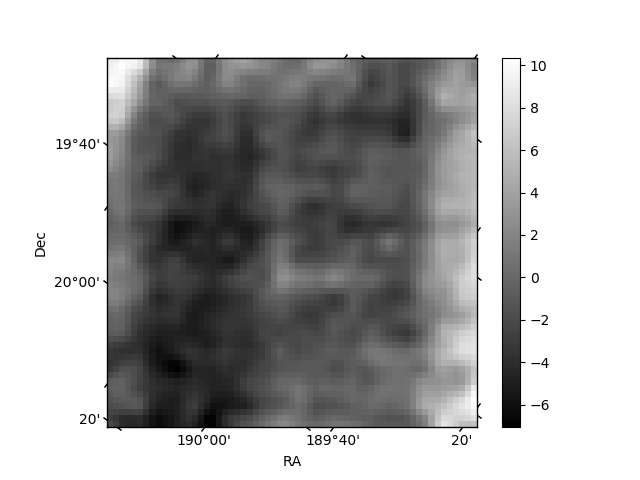
Histogram calculated using DETX and DETY for each event in the final _common_clean file
| Quadrant A | 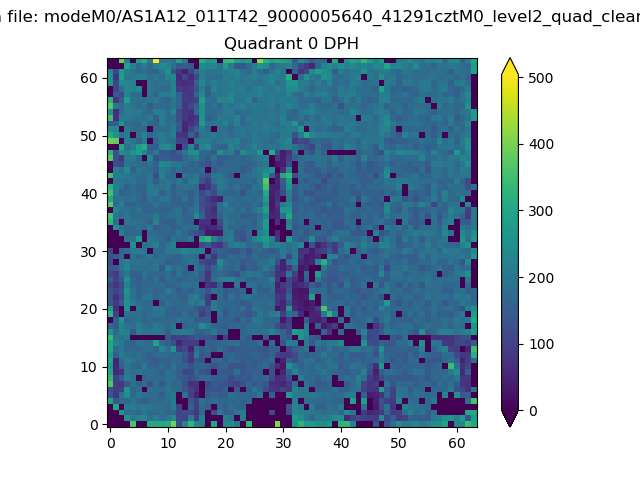 |
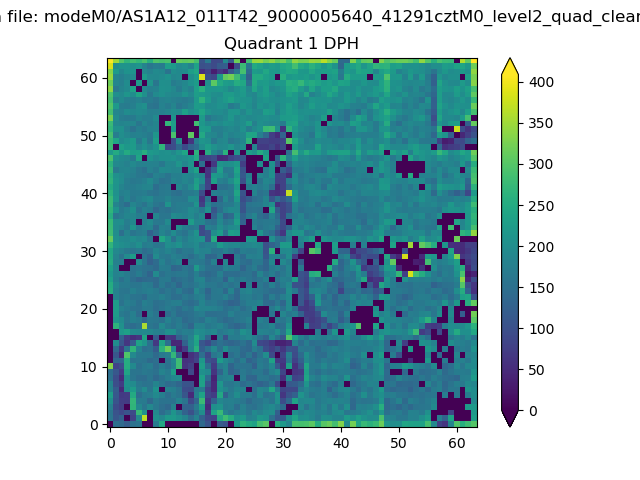 |
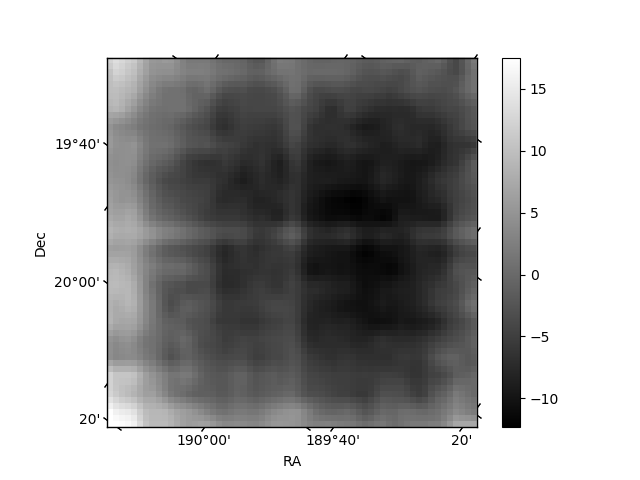
Quadrant B |
|---|---|---|---|
| Quadrant D | 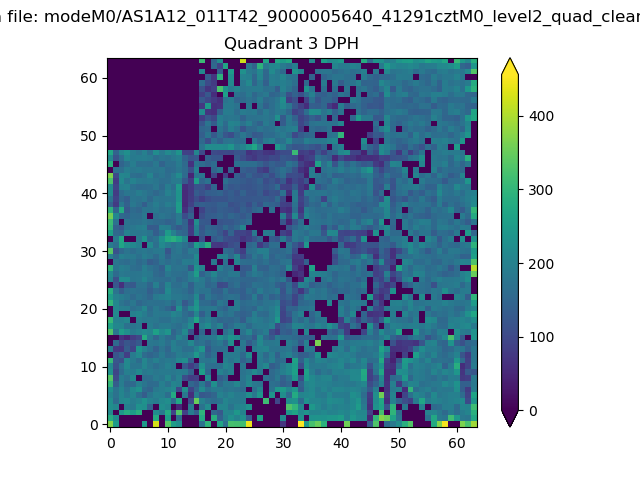 |
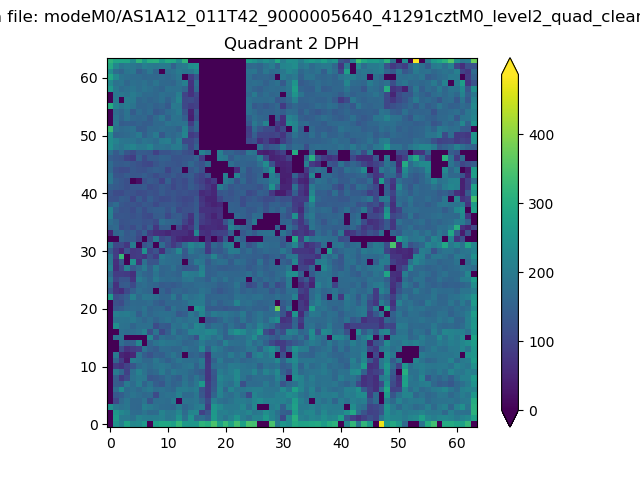 |
Quadrant C |
| Plot type | Count rate plots | Images |
|---|---|---|
| Comparison with Poisson distribution Blue bars denote a histogram of data divided into 1 sec bins. Red curve is a Poisson curve with rate = median count rate of data. |
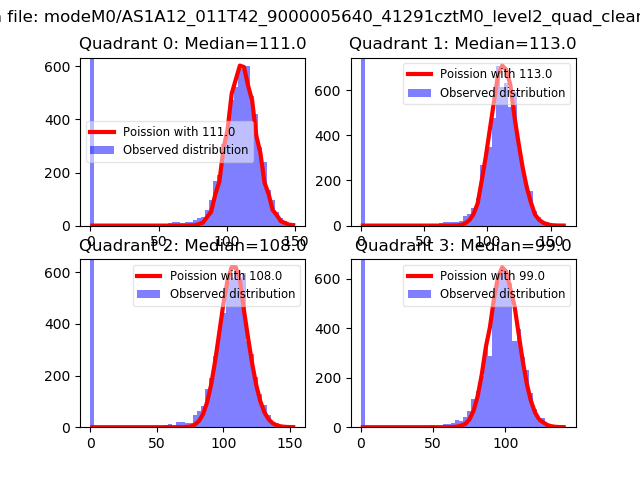 |
 |
| Quadrant-wise count rates Data is divided into 100 sec bins |
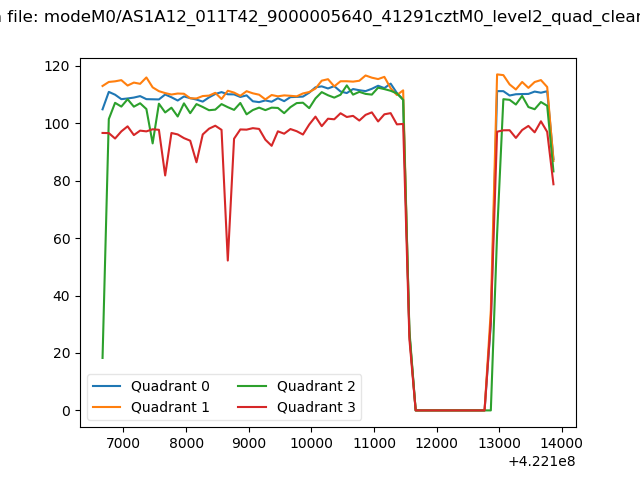 |
|
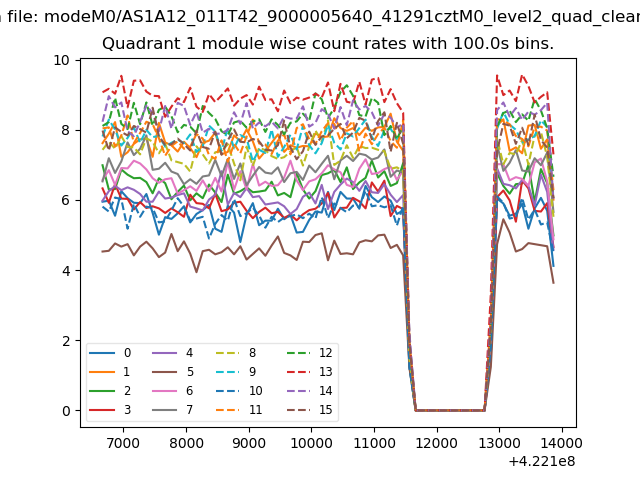
| Module-wise count rates for Quadrant A Data is divided into 100 sec bins |
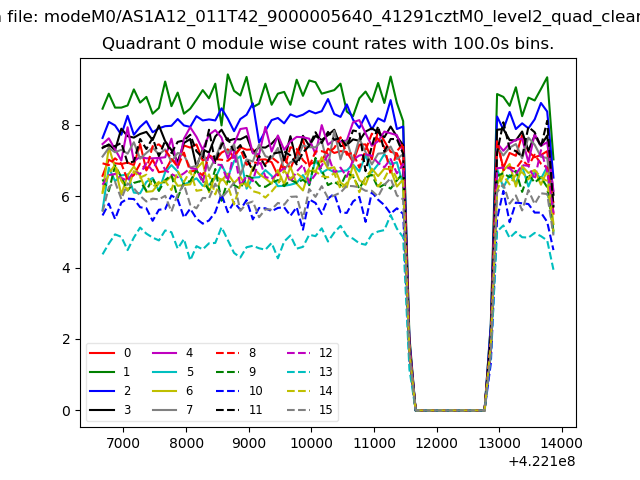 |
 |
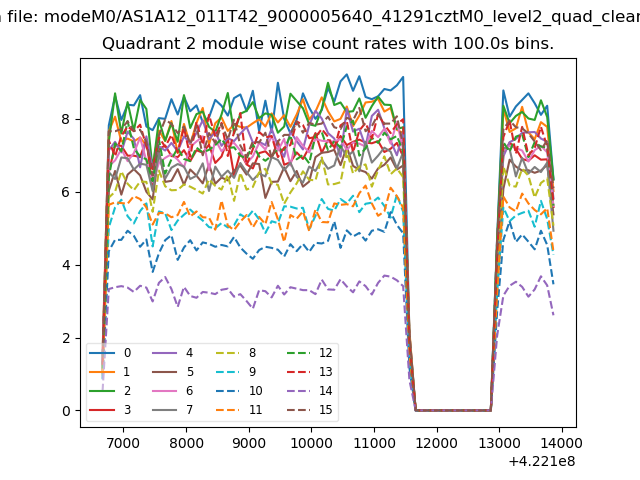
| Module-wise count rates for Quadrant B Data is divided into 100 sec bins |
 |
 |
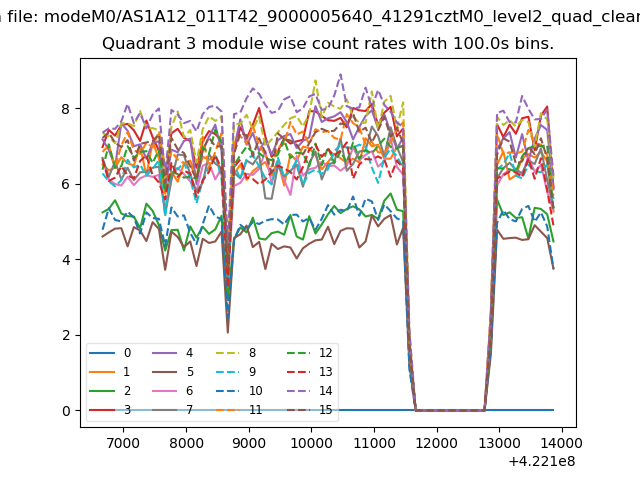
| Module-wise count rates for Quadrant C Data is divided into 100 sec bins |
 |
 |
| Module-wise count rates for Quadrant D Data is divided into 100 sec bins |
 |
 |
| Parameter | Plot |
|---|---|
| CZT HV Monitor | 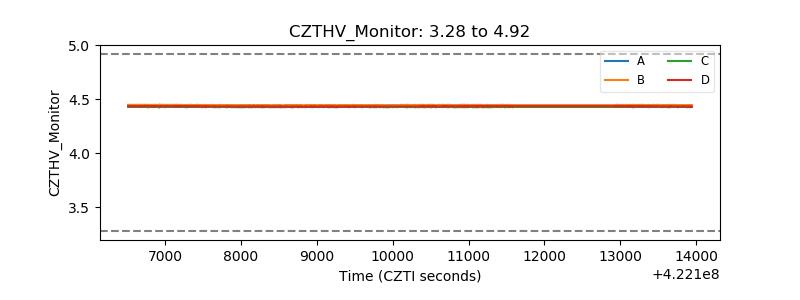 |
| D_VDD | 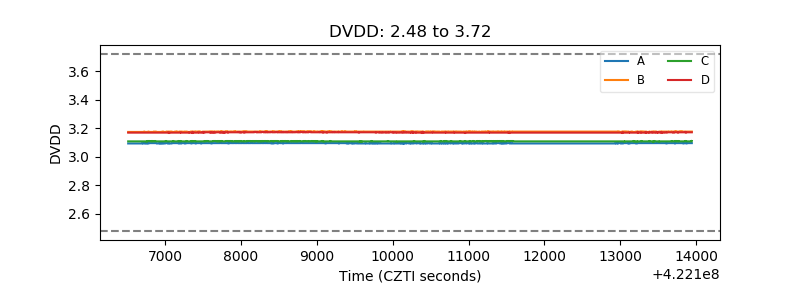 |
| Temperature 1 | 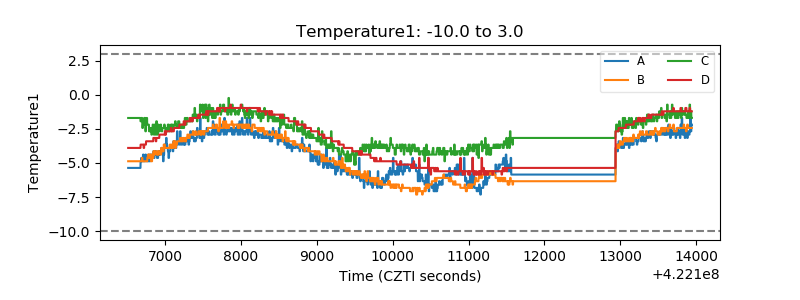 |
| Veto HV Monitor |  |
| Veto LLD | 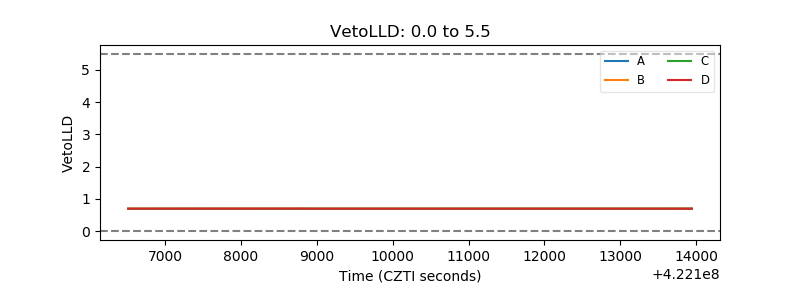 |
| Alpha Counter | 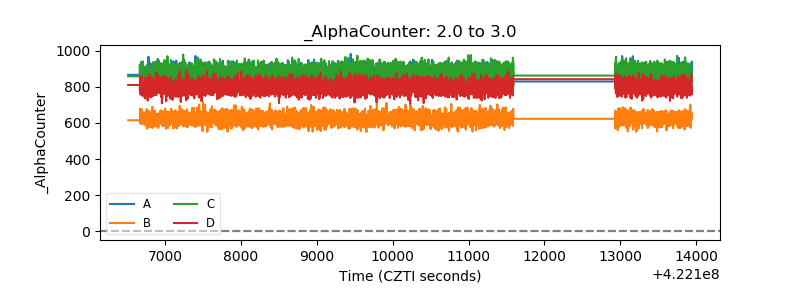 |
| _CPM_Rate | 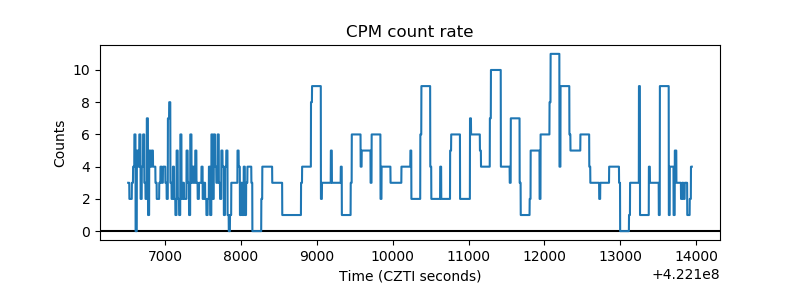 |
| CZT Counter | 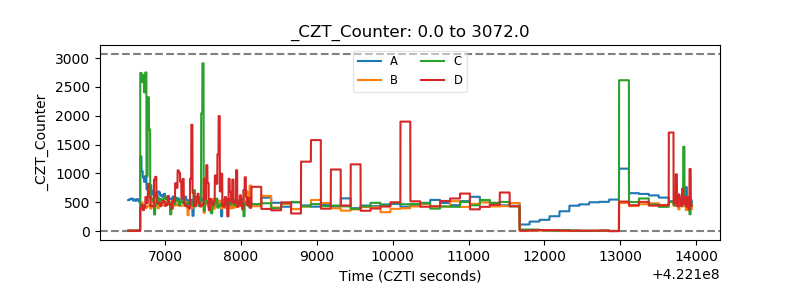 |
| +2.5 Volts monitor | 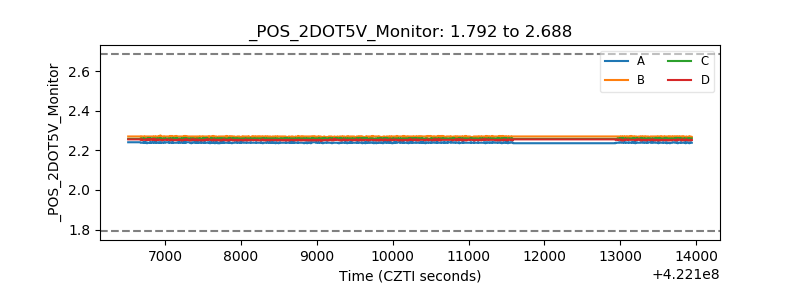 |
| +5 Volts monitor | 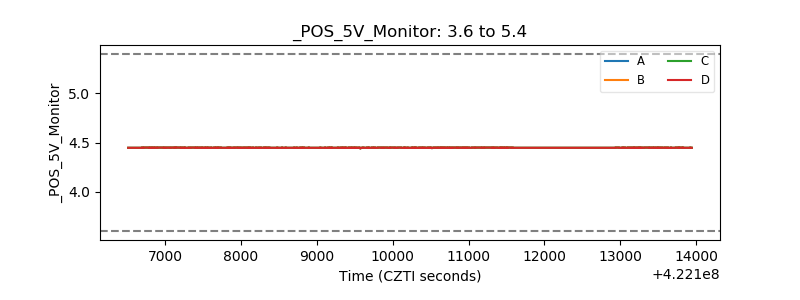 |
| _ROLL_ROT | 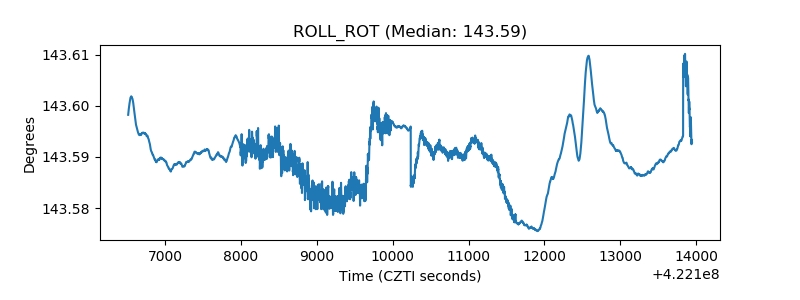 |
| _Roll_DEC | 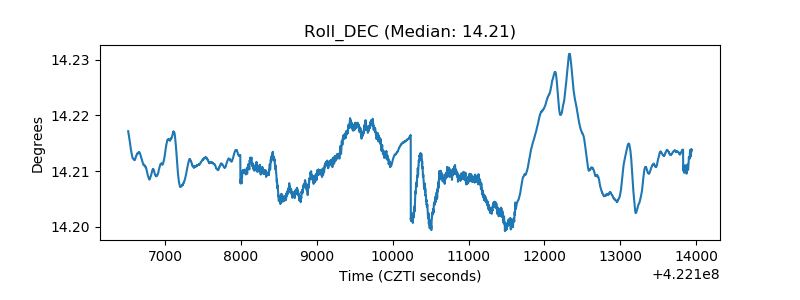 |
| _Roll_RA | 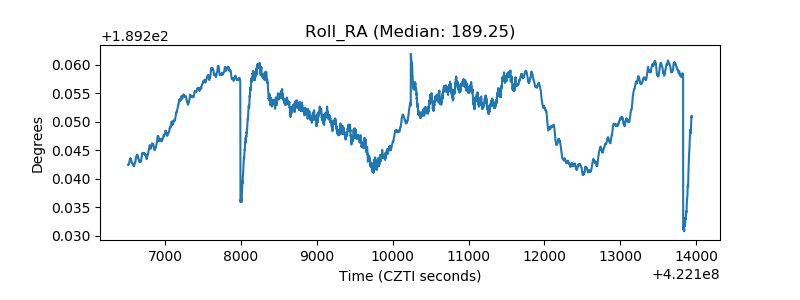 |
| Veto Counter | 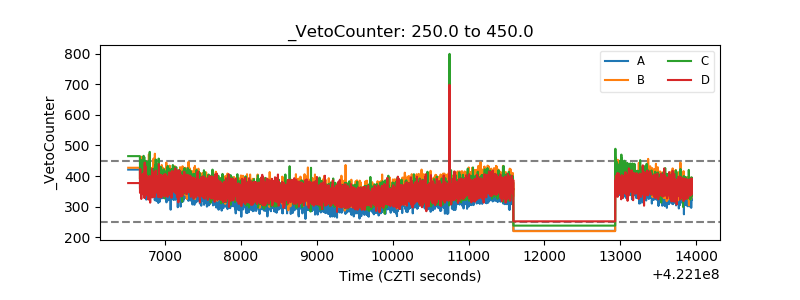 |