| Param | Original file | Final file |
|---|---|---|
| Filename | modeM0/AS1A12_011T42_9000005640_41292cztM0_level2.fits | modeM0/AS1A12_011T42_9000005640_41292cztM0_level2_quad_clean.evt |
| Size (bytes) | 362,986,560 | 100,920,960 |
| Size | 346.2 MB | 96.2 MB |
| Events in quadrant A | 3,259,453 | 677,688 |
| Events in quadrant B | 2,828,972 | 691,103 |
| Events in quadrant C | 3,262,113 | 645,898 |
| Events in quadrant D | 3,603,332 | 608,338 |
| Mode SS | |||
|---|---|---|---|
| Quadrant | BADHDUFLAG | Total packets | Discarded packets |
| A | 0 | 128 | 0 |
| B | 0 | 128 | 0 |
| C | 0 | 128 | 0 |
| D | 0 | 128 | 0 |
| Mode M9 | |||
|---|---|---|---|
| Quadrant | BADHDUFLAG | Total packets | Discarded packets |
| A | 0 | 26 | 0 |
| B | 0 | 26 | 0 |
| C | 0 | 26 | 0 |
| D | 0 | 26 | 0 |
| Mode M0 | |||
|---|---|---|---|
| Quadrant | BADHDUFLAG | Total packets | Discarded packets |
| A | 0 | 13392 | 3 |
| B | 0 | 12679 | 2 |
| C | 0 | 13609 | 2 |
| D | 0 | 15022 | 2 |
| Quadrant | Total seconds | Saturated seconds | Saturation percentage |
|---|---|---|---|
| A | 6199 | 13 | 0.209711% |
| B | 6199 | 6 | 0.096790% |
| C | 6199 | 152 | 2.452008% |
| D | 6199 | 72 | 1.161478% |
Noise dominated data is calculated using 1-second bins in cleaned event files. If a bin has >2000 counts, and if more than 50% of those come from <1% of pixels, then it is considered to be noise-dominated and hence unusable.
| Quadrant | # 1 sec bins | Bins with >0 counts | Bins with >2000 counts | High rate bins dominated by noise | Noise dominated (total time) | Noise dominated (detector-on time) | Marked lightcurve |
|---|---|---|---|---|---|---|---|
| A | 8825 | 6201 | 3 | 3 | 0.03% | 0.05% | 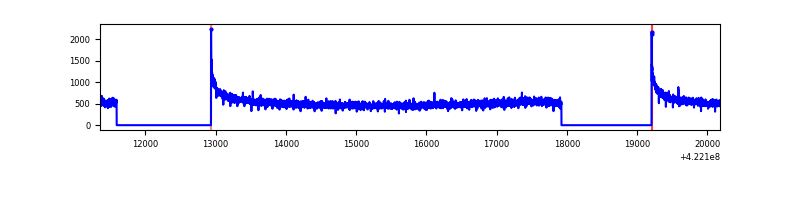 |
| B | 8825 | 6201 | 1 | 1 | 0.01% | 0.02% | 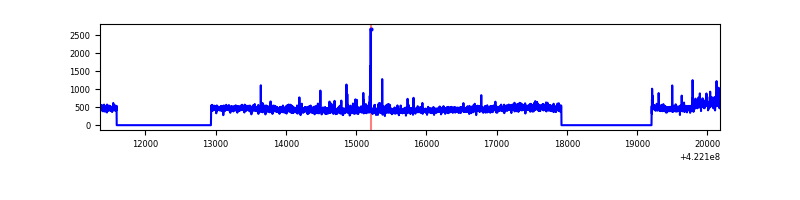 |
| C | 8825 | 6201 | 138 | 138 | 1.56% | 2.23% | 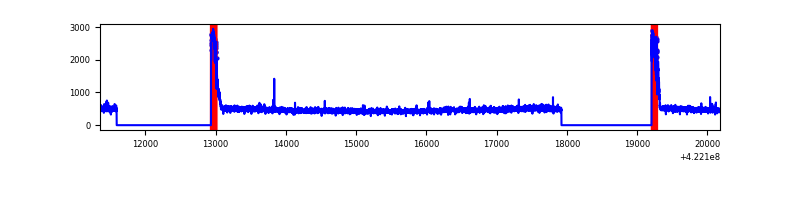 |
| D | 8825 | 6201 | 72 | 72 | 0.82% | 1.16% | 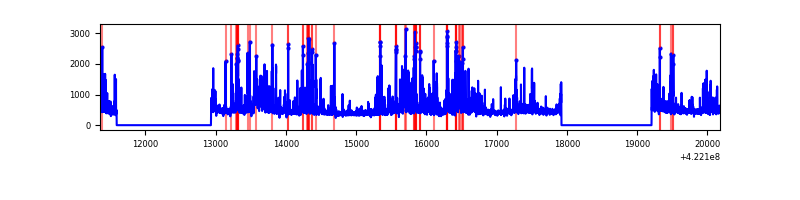 |
Top three noisy pixels from each quadrant. If the there are fewer than three noisy pixels in the level2.evt file, extra rows are filled as -1
| Pixel properties | Quadrant properties | ||||||
|---|---|---|---|---|---|---|---|
| Quadrant | DetID | PixID | Counts | Sigma | Mean | Median | Sigma |
| A | 10 | 83 | 576824 | 4071.23 | 687 | 673 | 141.5 |
| A | 12 | 189 | 23234 | 159.42 | 687 | 673 | 141.5 |
| A | 13 | 254 | 8687 | 56.63 | 687 | 673 | 141.5 |
| B | 0 | 245 | 55822 | 415.19 | 680 | 659 | 132.9 |
| B | 7 | 202 | 50729 | 376.86 | 680 | 659 | 132.9 |
| B | 0 | 155 | 23268 | 170.17 | 680 | 659 | 132.9 |
| C | 0 | 10 | 404882 | 2608.17 | 660 | 664 | 155.0 |
| C | 15 | 214 | 264534 | 1702.59 | 660 | 664 | 155.0 |
| C | 15 | 159 | 11616 | 70.66 | 660 | 664 | 155.0 |
| D | 1 | 47 | 404893 | 2423.03 | 669 | 649 | 166.8 |
| D | 2 | 249 | 318774 | 1906.84 | 669 | 649 | 166.8 |
| D | 12 | 233 | 142014 | 847.34 | 669 | 649 | 166.8 |
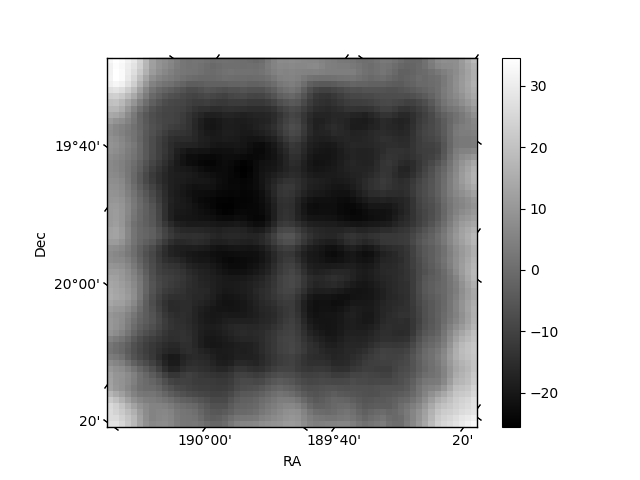
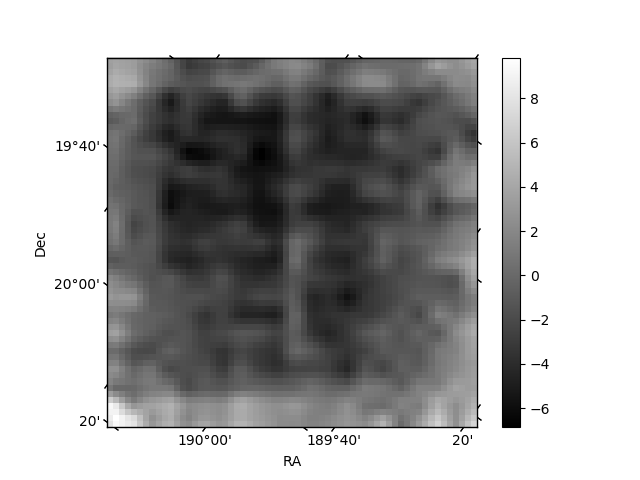
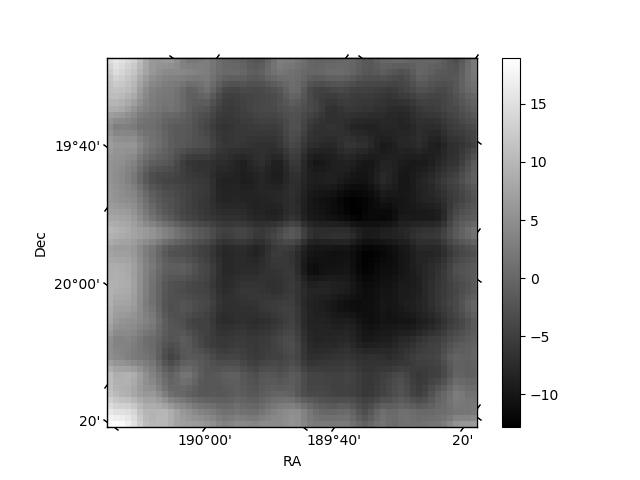
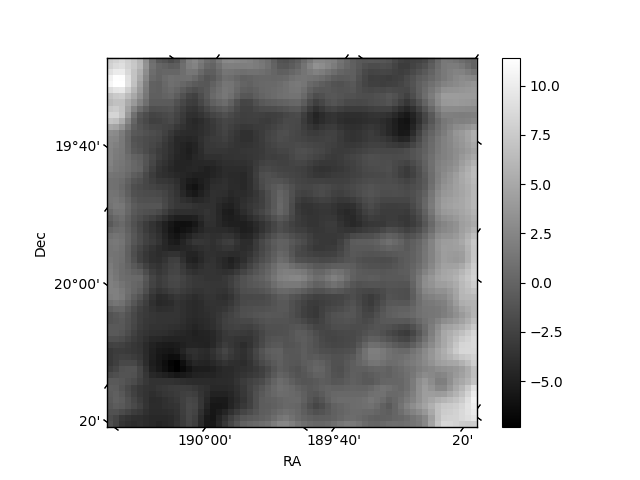
Histogram calculated using DETX and DETY for each event in the final _common_clean file
| Quadrant A | 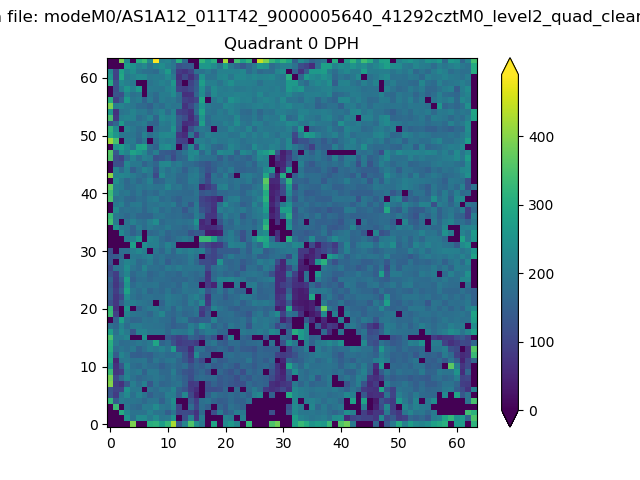 |
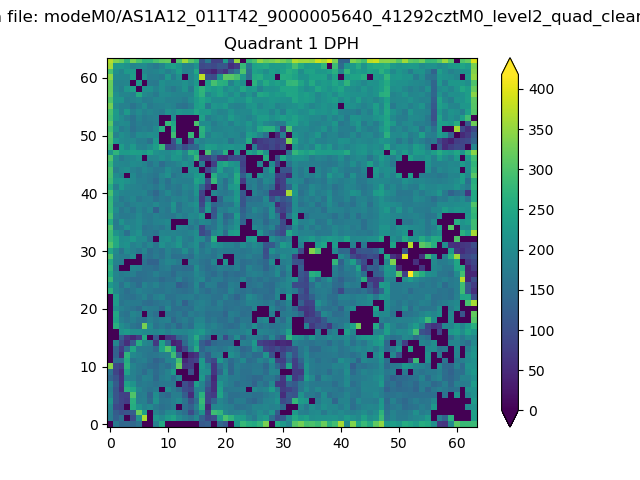 |
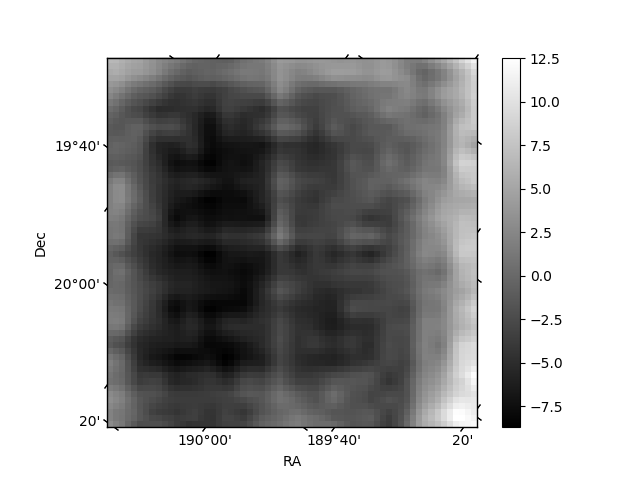
Quadrant B |
|---|---|---|---|
| Quadrant D | 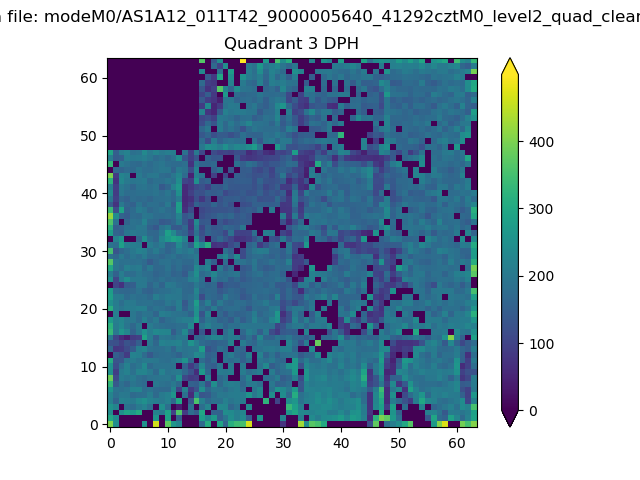 |
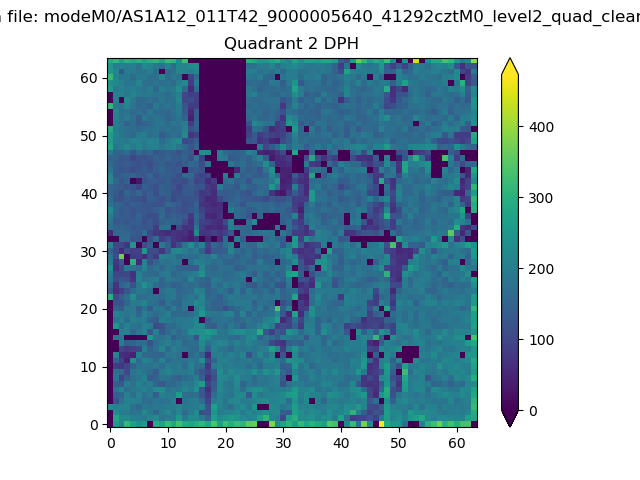 |
Quadrant C |
| Plot type | Count rate plots | Images |
|---|---|---|
| Comparison with Poisson distribution Blue bars denote a histogram of data divided into 1 sec bins. Red curve is a Poisson curve with rate = median count rate of data. |
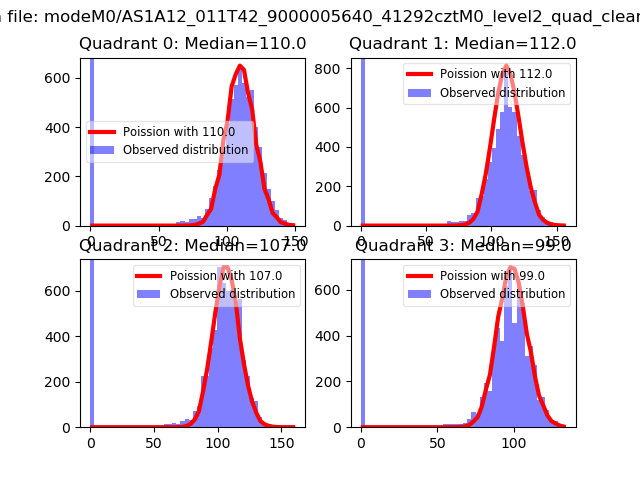 |
 |
| Quadrant-wise count rates Data is divided into 100 sec bins |
 |
|
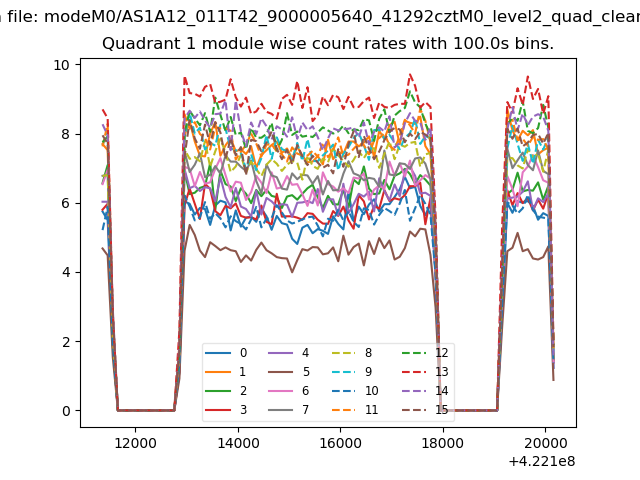
| Module-wise count rates for Quadrant A Data is divided into 100 sec bins |
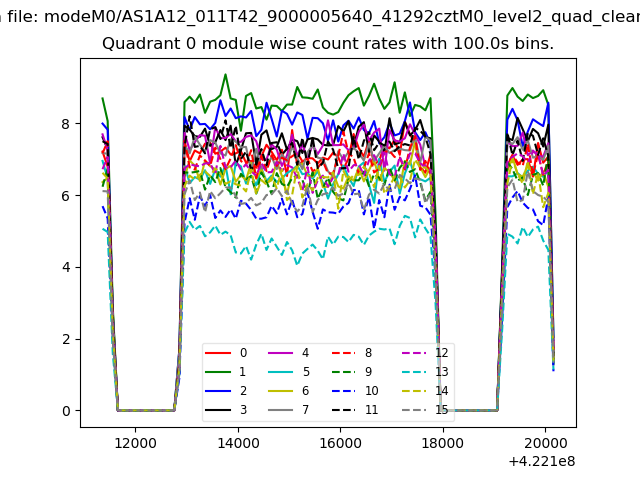 |
 |
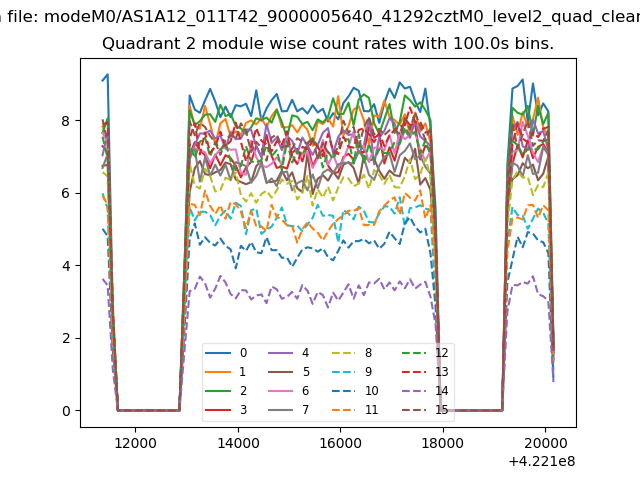
| Module-wise count rates for Quadrant B Data is divided into 100 sec bins |
 |
 |
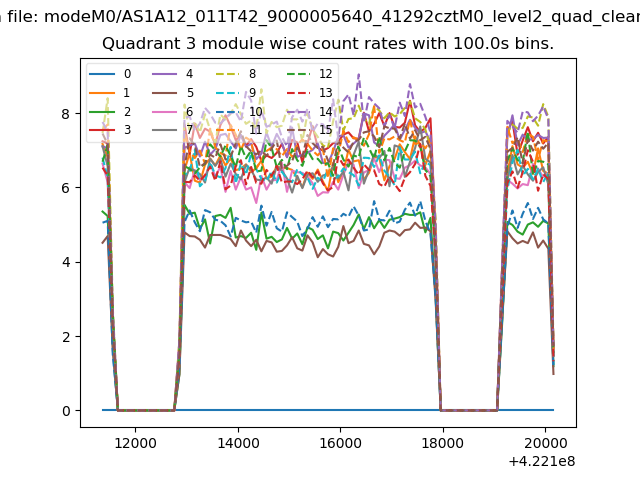
| Module-wise count rates for Quadrant C Data is divided into 100 sec bins |
 |
 |
| Module-wise count rates for Quadrant D Data is divided into 100 sec bins |
 |
 |
| Parameter | Plot |
|---|---|
| CZT HV Monitor | 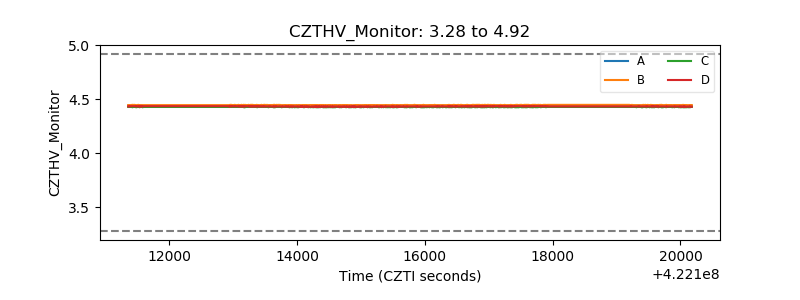 |
| D_VDD |  |
| Temperature 1 | 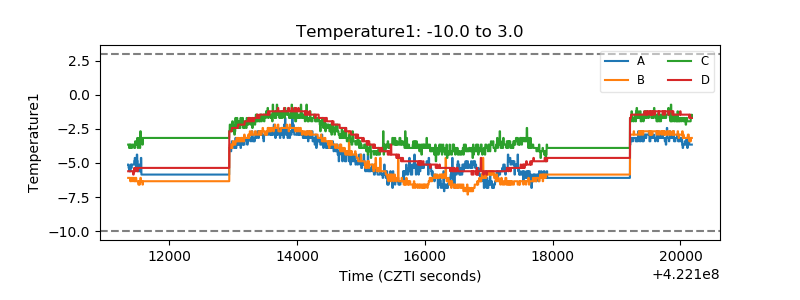 |
| Veto HV Monitor | 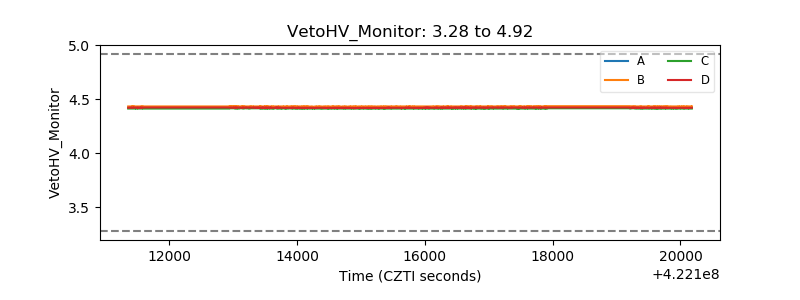 |
| Veto LLD | 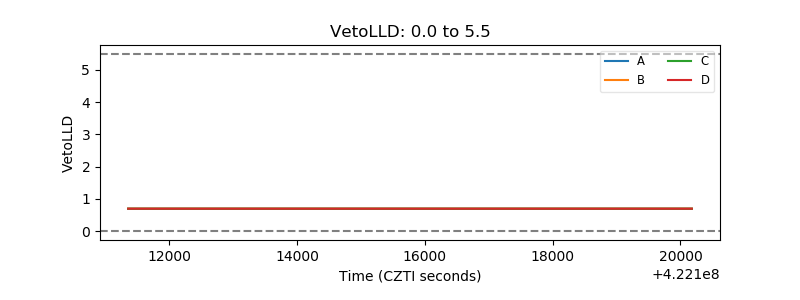 |
| Alpha Counter | 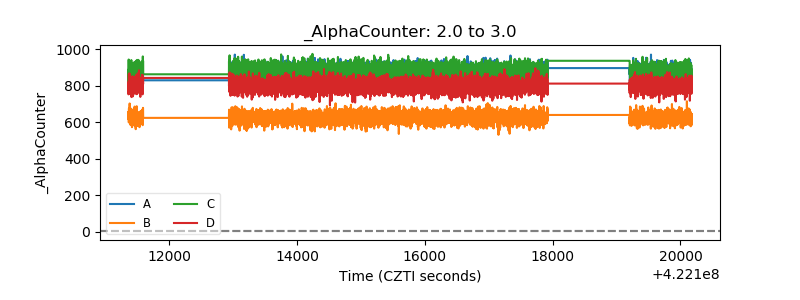 |
| _CPM_Rate | 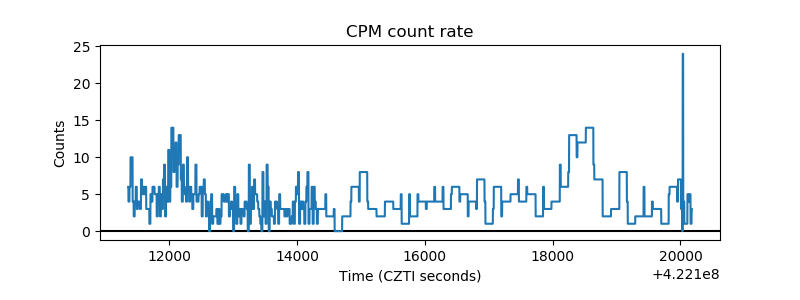 |
| CZT Counter | 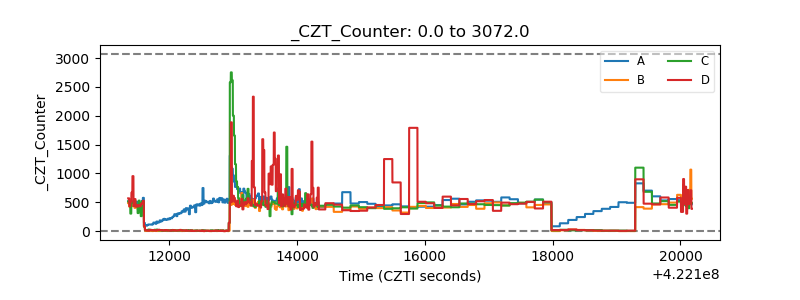 |
| +2.5 Volts monitor | 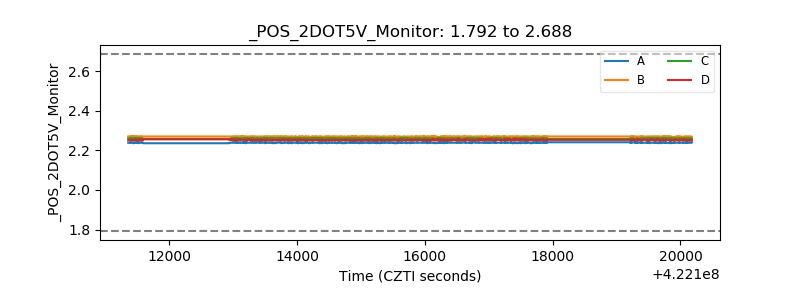 |
| +5 Volts monitor | 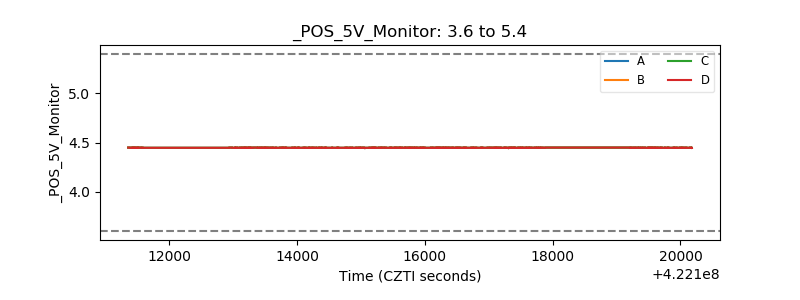 |
| _ROLL_ROT | 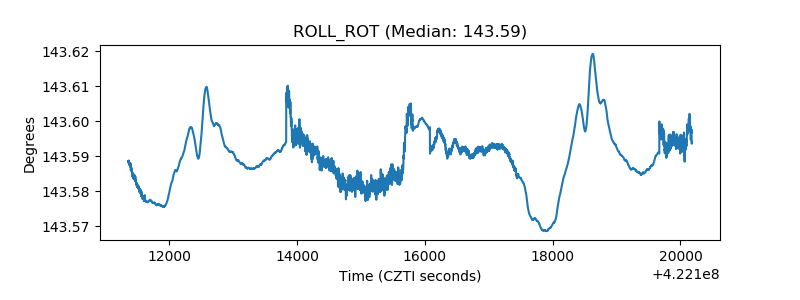 |
| _Roll_DEC | 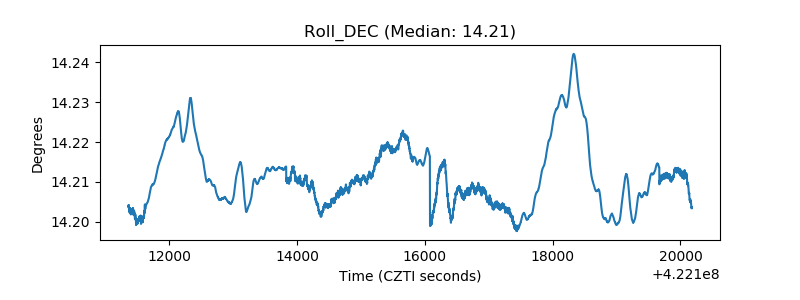 |
| _Roll_RA | 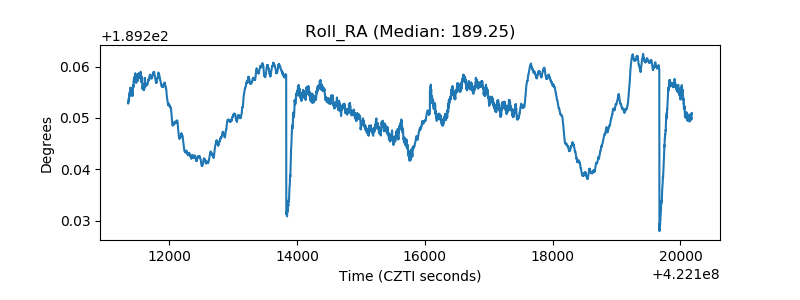 |
| Veto Counter | 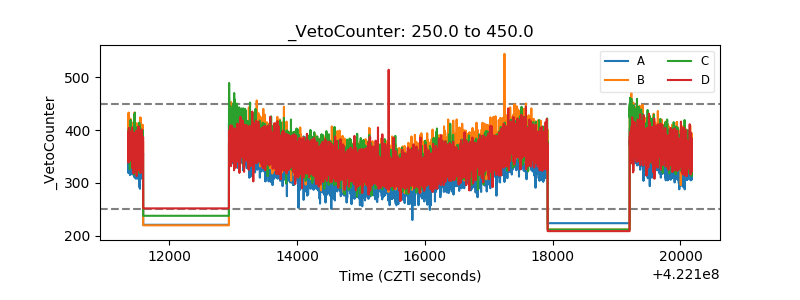 |