| Param | Original file | Final file |
|---|---|---|
| Filename | modeM0/AS1A12_011T42_9000005640_41295cztM0_level2.fits | modeM0/AS1A12_011T42_9000005640_41295cztM0_level2_quad_clean.evt |
| Size (bytes) | 83,459,520 | 21,326,400 |
| Size | 79.6 MB | 20.3 MB |
| Events in quadrant A | 755,408 | 142,485 |
| Events in quadrant B | 683,488 | 146,476 |
| Events in quadrant C | 795,827 | 131,176 |
| Events in quadrant D | 750,824 | 128,411 |
| Mode SS | |||
|---|---|---|---|
| Quadrant | BADHDUFLAG | Total packets | Discarded packets |
| A | 0 | 26 | 0 |
| B | 0 | 26 | 0 |
| C | 0 | 26 | 0 |
| D | 0 | 26 | 0 |
| Mode M9 | |||
|---|---|---|---|
| Quadrant | BADHDUFLAG | Total packets | Discarded packets |
| A | 0 | 2 | 0 |
| B | 0 | 2 | 0 |
| C | 0 | 2 | 0 |
| D | 0 | 3 | 0 |
| Mode M0 | |||
|---|---|---|---|
| Quadrant | BADHDUFLAG | Total packets | Discarded packets |
| A | 0 | 3021 | 1 |
| B | 0 | 2839 | 1 |
| C | 0 | 3155 | 1 |
| D | 0 | 3095 | 1 |
| Quadrant | Total seconds | Saturated seconds | Saturation percentage |
|---|---|---|---|
| A | 1298 | 6 | 0.462250% |
| B | 1298 | 1 | 0.077042% |
| C | 1298 | 73 | 5.624037% |
| D | 1298 | 9 | 0.693374% |
Noise dominated data is calculated using 1-second bins in cleaned event files. If a bin has >2000 counts, and if more than 50% of those come from <1% of pixels, then it is considered to be noise-dominated and hence unusable.
| Quadrant | # 1 sec bins | Bins with >0 counts | Bins with >2000 counts | High rate bins dominated by noise | Noise dominated (total time) | Noise dominated (detector-on time) | Marked lightcurve |
|---|---|---|---|---|---|---|---|
| A | 1298 | 1298 | 2 | 2 | 0.15% | 0.15% | 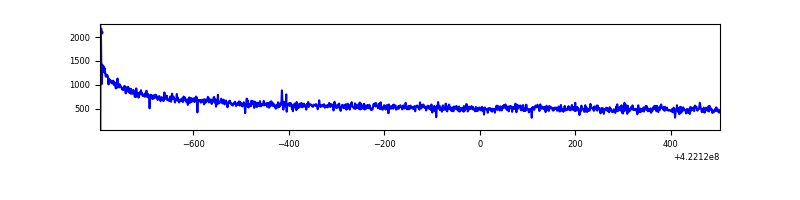 |
| B | 1298 | 1298 | 0 | 0 | 0.00% | 0.00% | 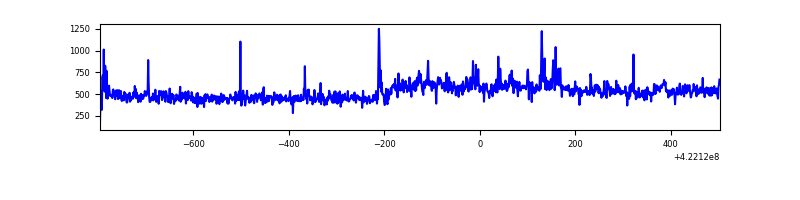 |
| C | 1298 | 1298 | 69 | 69 | 5.32% | 5.32% | 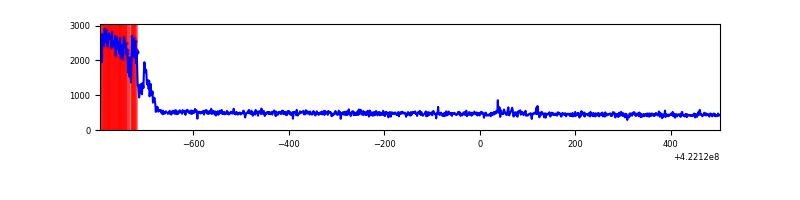 |
| D | 1298 | 1298 | 5 | 5 | 0.39% | 0.39% | 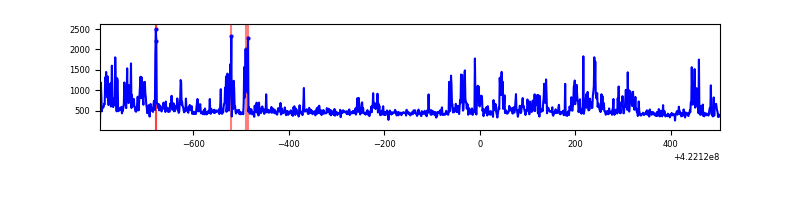 |
Top three noisy pixels from each quadrant. If the there are fewer than three noisy pixels in the level2.evt file, extra rows are filled as -1
| Pixel properties | Quadrant properties | ||||||
|---|---|---|---|---|---|---|---|
| Quadrant | DetID | PixID | Counts | Sigma | Mean | Median | Sigma |
| A | 10 | 83 | 177604 | 5603.13 | 146 | 143 | 31.7 |
| A | 12 | 189 | 12399 | 386.97 | 146 | 143 | 31.7 |
| A | 3 | 137 | 1592 | 45.75 | 146 | 143 | 31.7 |
| B | 7 | 202 | 88549 | 2987.33 | 142 | 138 | 29.6 |
| B | 0 | 245 | 17395 | 583.1 | 142 | 138 | 29.6 |
| B | 0 | 229 | 10665 | 355.7 | 142 | 138 | 29.6 |
| C | 0 | 10 | 191449 | 5625.14 | 138 | 140 | 34.0 |
| C | 15 | 214 | 59202 | 1736.62 | 138 | 140 | 34.0 |
| C | 15 | 111 | 3890 | 110.26 | 138 | 140 | 34.0 |
| D | 1 | 47 | 63784 | 1698.25 | 145 | 141 | 37.5 |
| D | 1 | 52 | 50817 | 1352.23 | 145 | 141 | 37.5 |
| D | 2 | 249 | 35954 | 955.63 | 145 | 141 | 37.5 |
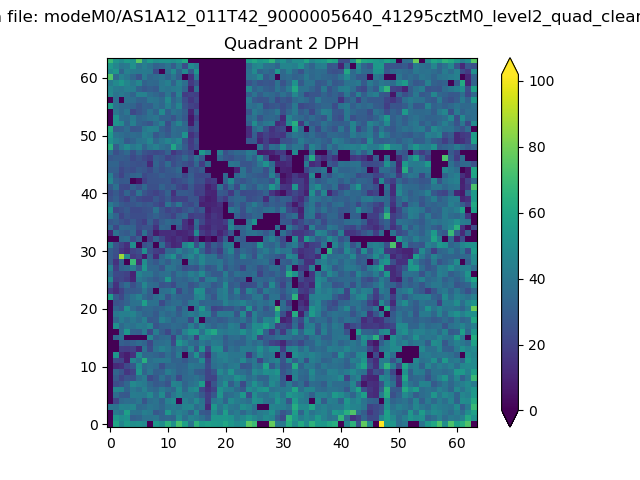
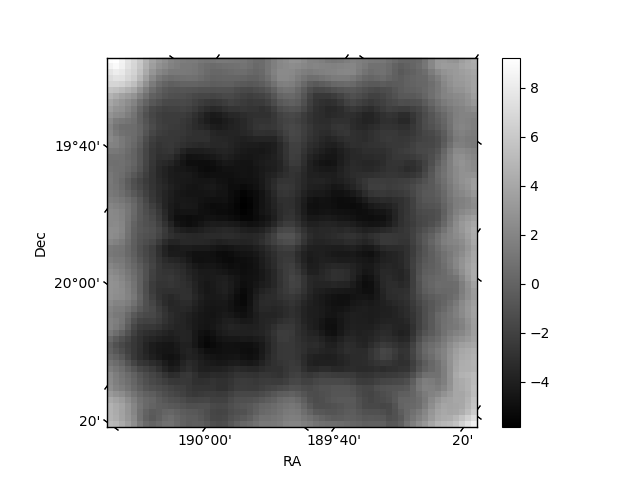
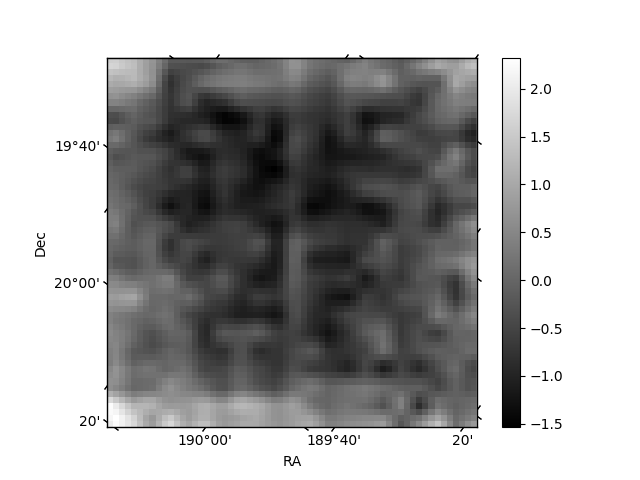
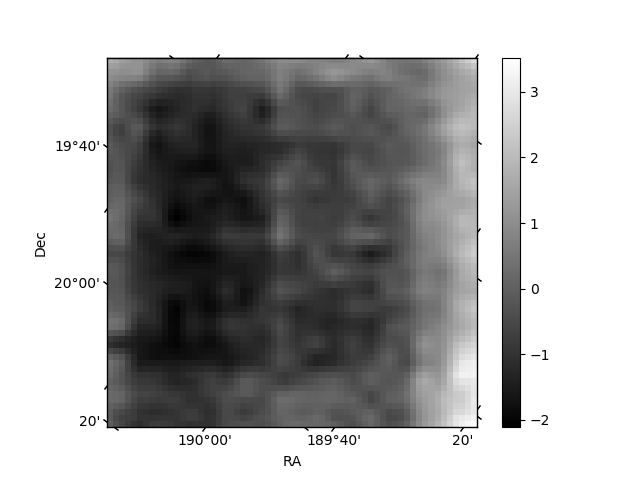
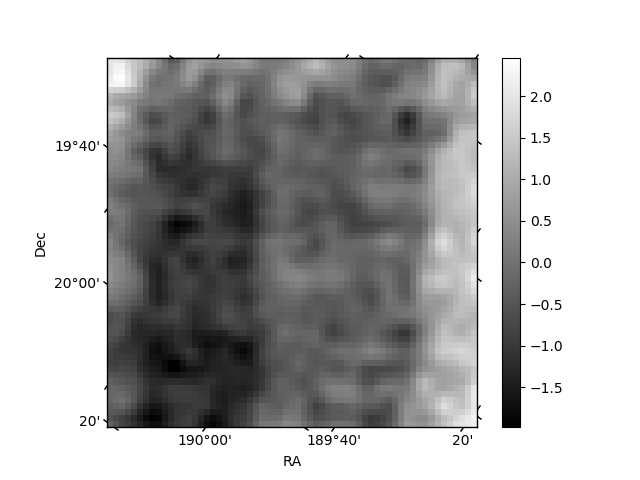
Histogram calculated using DETX and DETY for each event in the final _common_clean file
| Quadrant A | 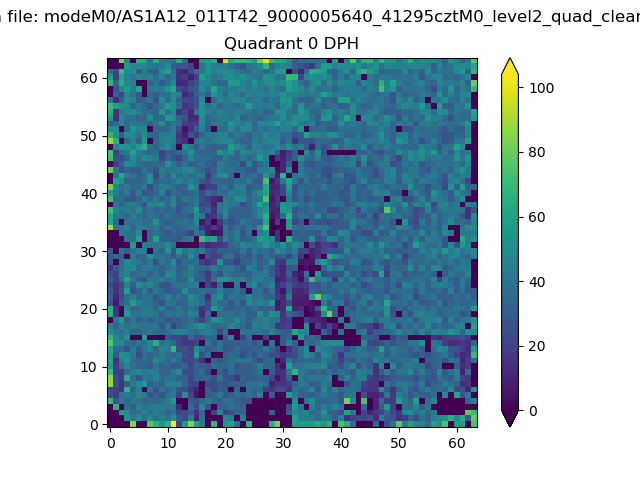 |
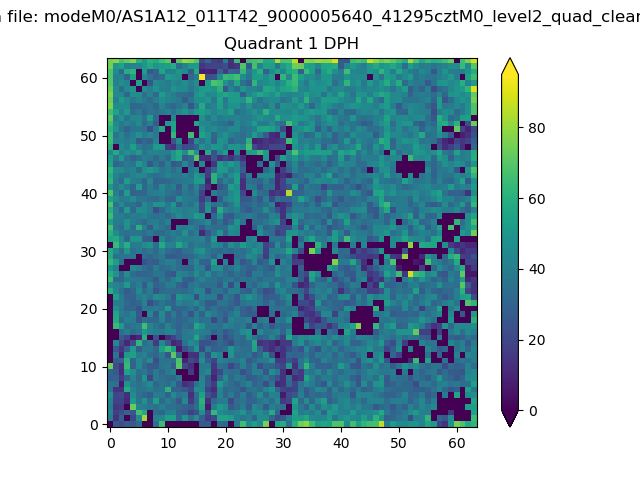 |
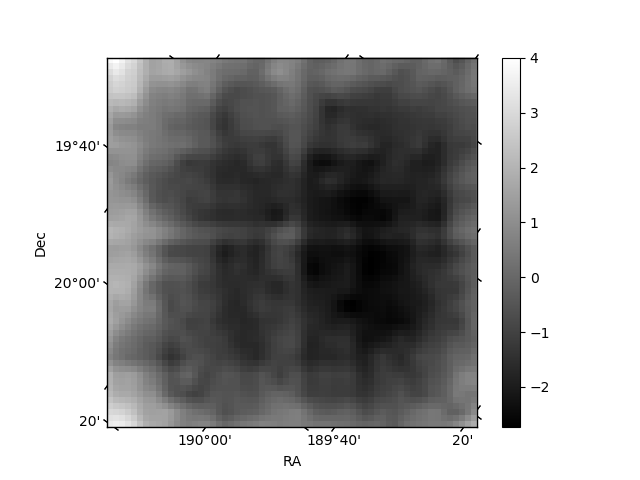
Quadrant B |
|---|---|---|---|
| Quadrant D | 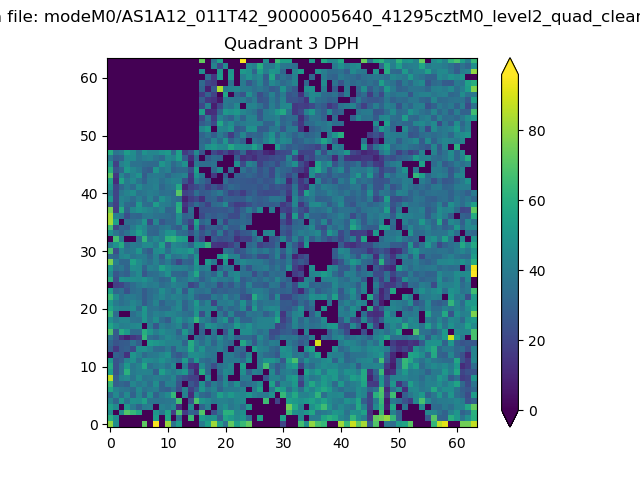 |
 |
Quadrant C |
| Plot type | Count rate plots | Images |
|---|---|---|
| Comparison with Poisson distribution Blue bars denote a histogram of data divided into 1 sec bins. Red curve is a Poisson curve with rate = median count rate of data. |
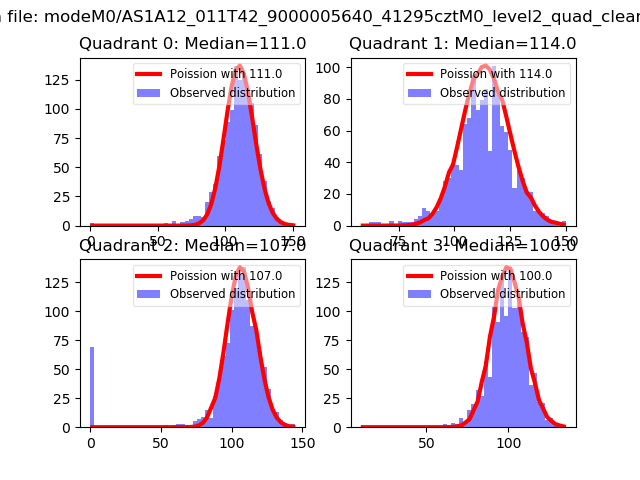 |
 |
| Quadrant-wise count rates Data is divided into 100 sec bins |
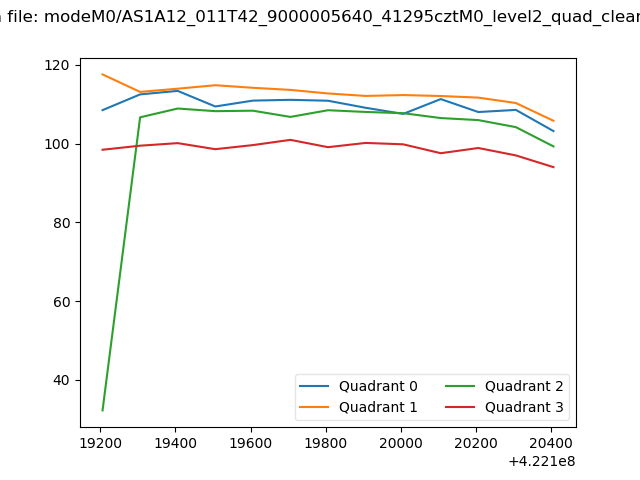 |
|
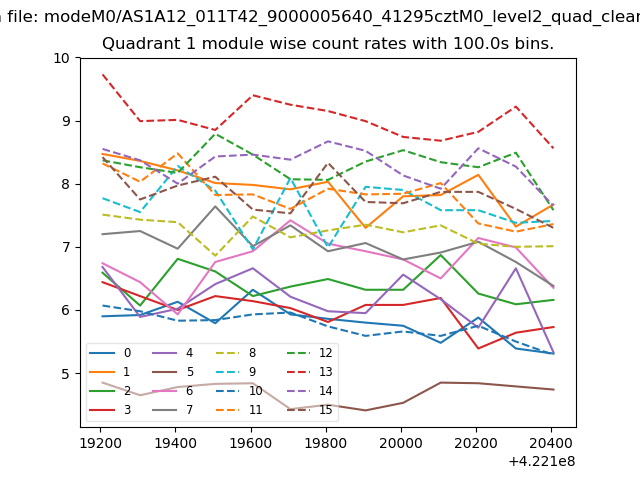
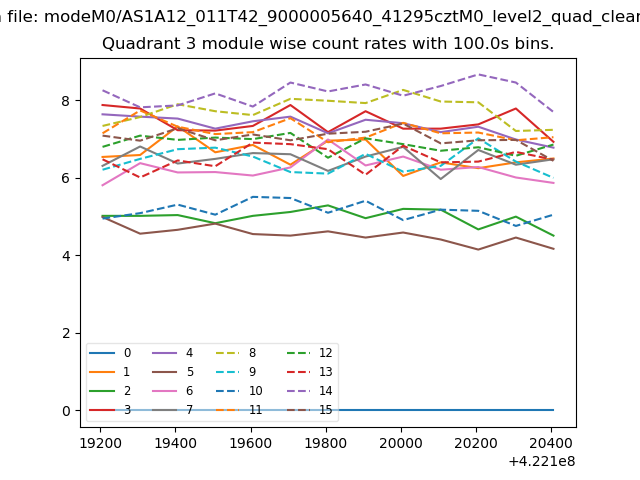
| Module-wise count rates for Quadrant A Data is divided into 100 sec bins |
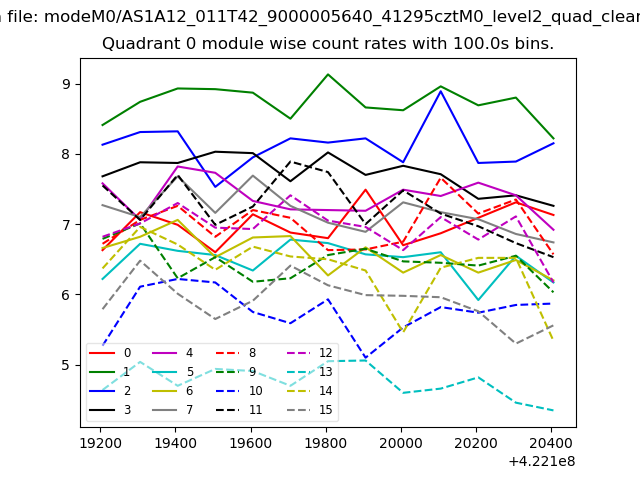 |
 |
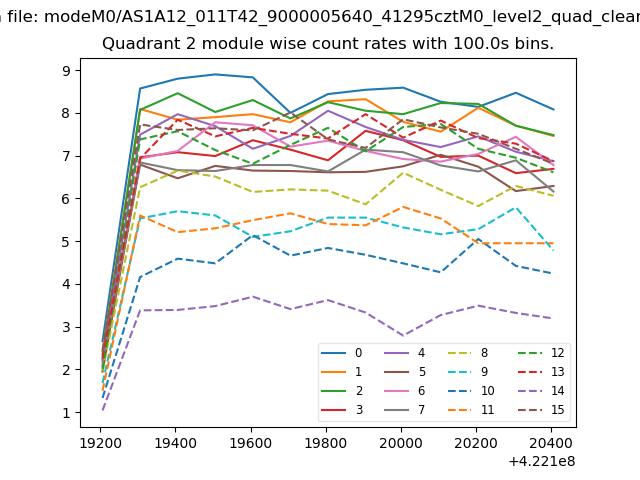
| Module-wise count rates for Quadrant B Data is divided into 100 sec bins |
 |
 |
| Module-wise count rates for Quadrant C Data is divided into 100 sec bins |
 |
 |
| Module-wise count rates for Quadrant D Data is divided into 100 sec bins |
 |
 |
| Parameter | Plot |
|---|---|
| CZT HV Monitor | 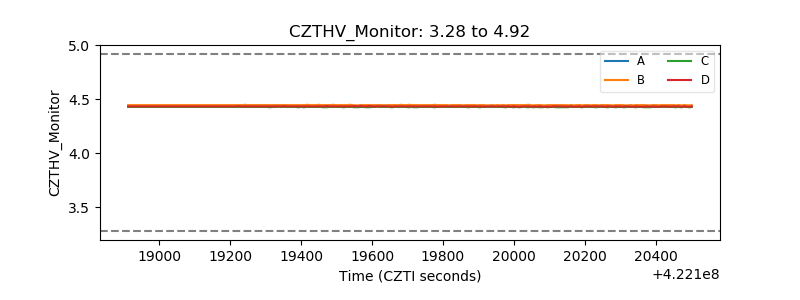 |
| D_VDD |  |
| Temperature 1 | 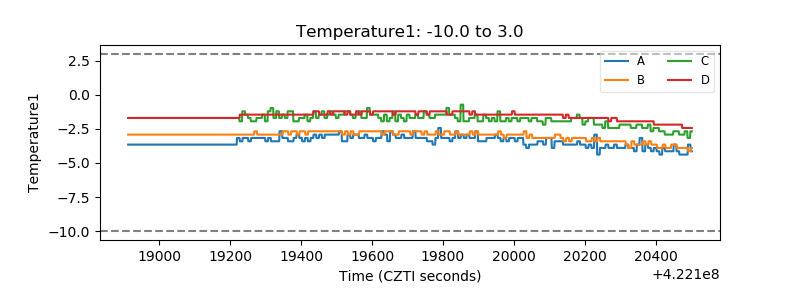 |
| Veto HV Monitor |  |
| Veto LLD | 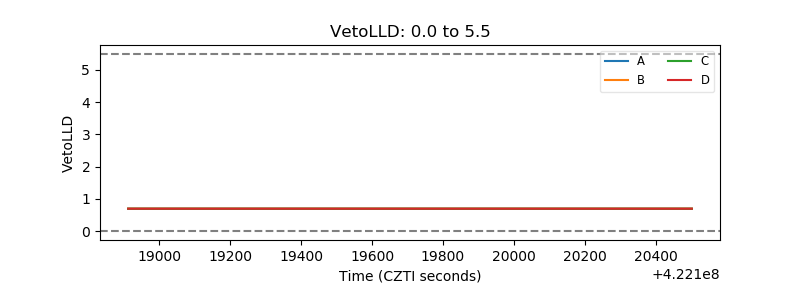 |
| Alpha Counter | 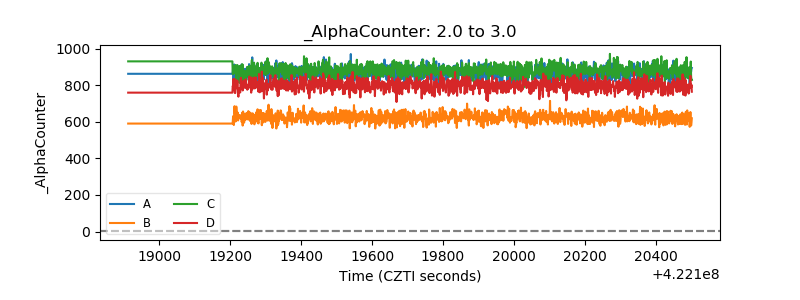 |
| _CPM_Rate | 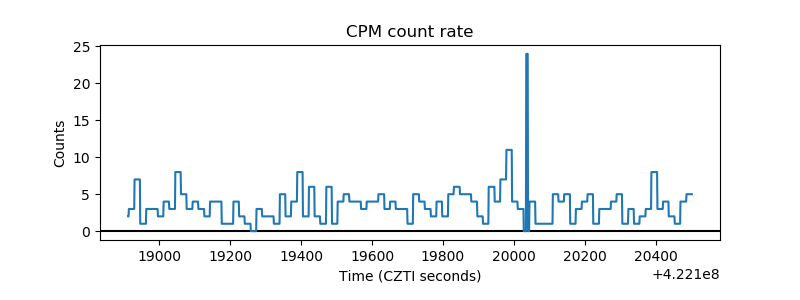 |
| CZT Counter | 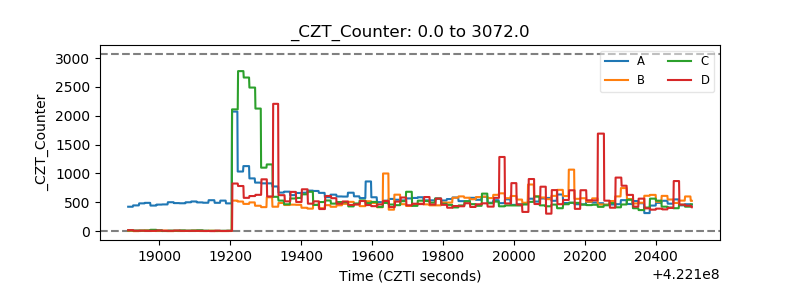 |
| +2.5 Volts monitor | 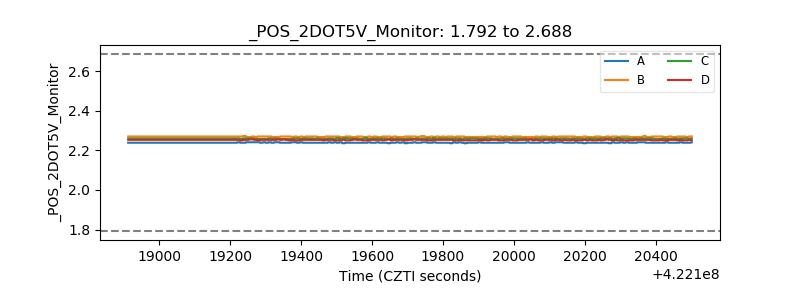 |
| +5 Volts monitor | 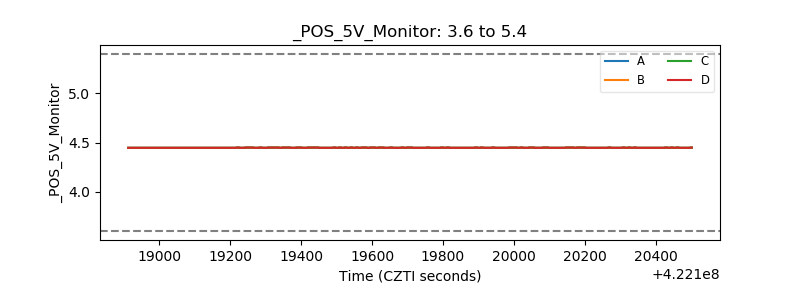 |
| _ROLL_ROT | 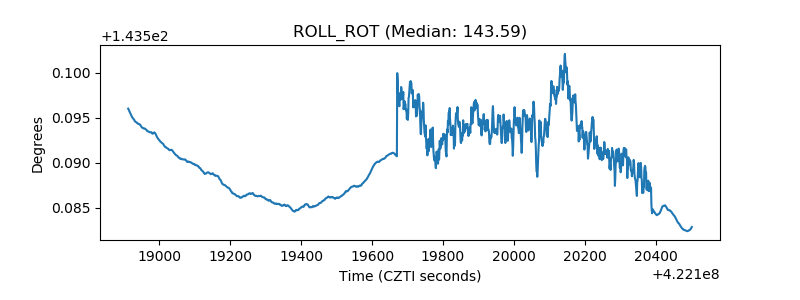 |
| _Roll_DEC | 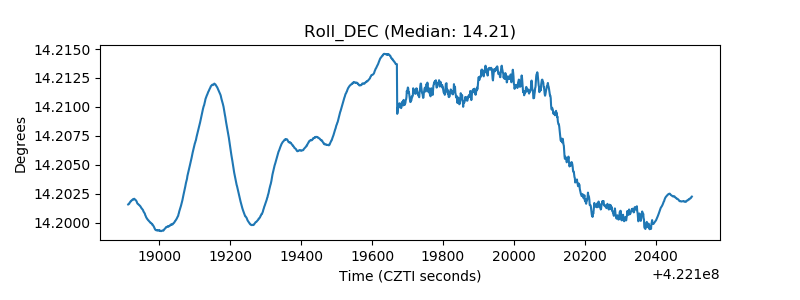 |
| _Roll_RA | 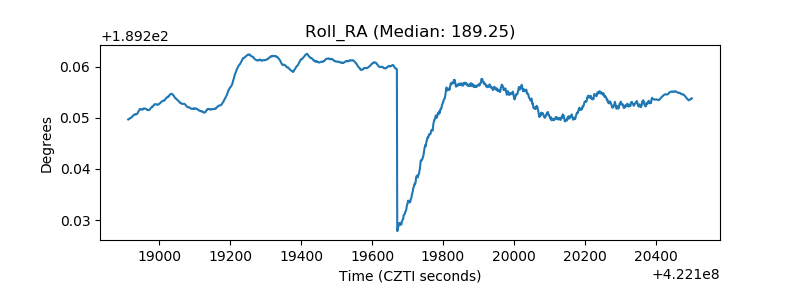 |
| Veto Counter | 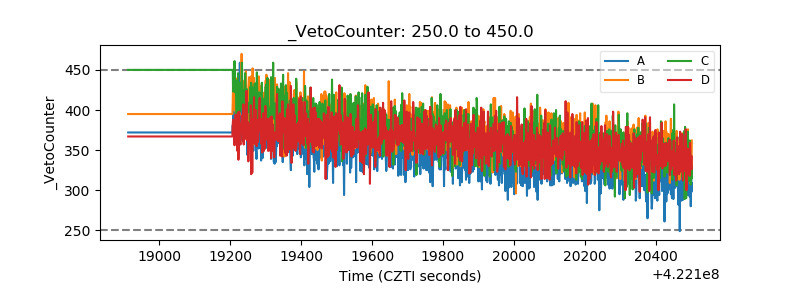 |