| Param | Original file | Final file |
|---|---|---|
| Filename | modeM0/AS1T05_106T01_9000005642_41295cztM0_level2.fits | modeM0/AS1T05_106T01_9000005642_41295cztM0_level2_quad_clean.evt |
| Size (bytes) | 966,294,720 | 195,984,000 |
| Size | 921.5 MB | 186.9 MB |
| Events in quadrant A | 6,658,481 | 1,387,306 |
| Events in quadrant B | 5,914,818 | 1,436,376 |
| Events in quadrant C | 6,691,350 | 1,320,133 |
| Events in quadrant D | 15,510,168 | 903,028 |
| Mode M0 | |||
|---|---|---|---|
| Quadrant | BADHDUFLAG | Total packets | Discarded packets |
| A | 0 | 27635 | 4 |
| B | 0 | 26231 | 3 |
| C | 0 | 28139 | 3 |
| D | 0 | 54961 | 3 |
| Mode SS | |||
|---|---|---|---|
| Quadrant | BADHDUFLAG | Total packets | Discarded packets |
| A | 0 | 264 | 0 |
| B | 0 | 264 | 0 |
| C | 0 | 264 | 0 |
| D | 0 | 264 | 0 |
| Mode M9 | |||
|---|---|---|---|
| Quadrant | BADHDUFLAG | Total packets | Discarded packets |
| A | 0 | 43 | 0 |
| B | 0 | 43 | 0 |
| C | 0 | 43 | 0 |
| D | 0 | 43 | 0 |
| Quadrant | Total seconds | Saturated seconds | Saturation percentage |
|---|---|---|---|
| A | 12827 | 23 | 0.179309% |
| B | 12827 | 27 | 0.210493% |
| C | 12827 | 311 | 2.424573% |
| D | 12827 | 3540 | 27.598035% |
Noise dominated data is calculated using 1-second bins in cleaned event files. If a bin has >2000 counts, and if more than 50% of those come from <1% of pixels, then it is considered to be noise-dominated and hence unusable.
| Quadrant | # 1 sec bins | Bins with >0 counts | Bins with >2000 counts | High rate bins dominated by noise | Noise dominated (total time) | Noise dominated (detector-on time) | Marked lightcurve |
|---|---|---|---|---|---|---|---|
| A | 17153 | 12830 | 17 | 17 | 0.10% | 0.13% | 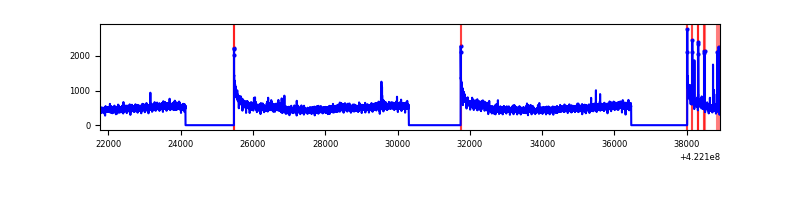 |
| B | 17153 | 12830 | 11 | 11 | 0.06% | 0.09% | 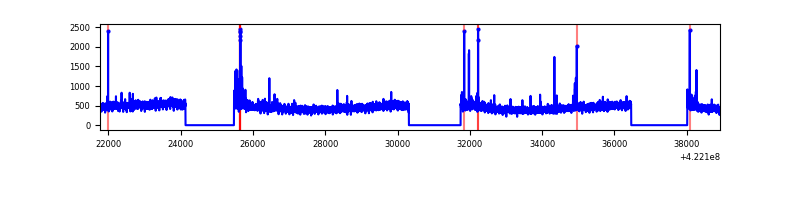 |
| C | 17153 | 12830 | 305 | 305 | 1.78% | 2.38% | 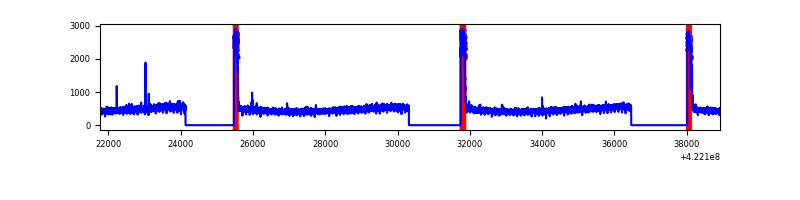 |
| D | 17153 | 12828 | 3362 | 3362 | 19.60% | 26.21% | 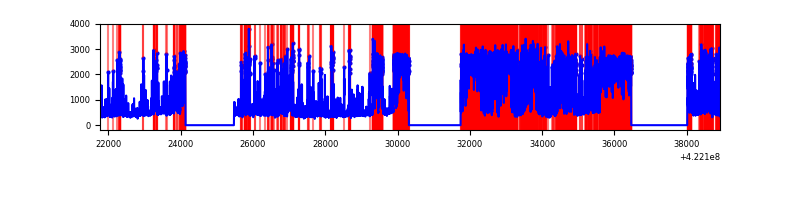 |
Top three noisy pixels from each quadrant. If the there are fewer than three noisy pixels in the level2.evt file, extra rows are filled as -1
| Pixel properties | Quadrant properties | ||||||
|---|---|---|---|---|---|---|---|
| Quadrant | DetID | PixID | Counts | Sigma | Mean | Median | Sigma |
| A | 10 | 83 | 1044028 | 3677.83 | 1393 | 1366 | 283.5 |
| A | 12 | 189 | 172689 | 604.31 | 1393 | 1366 | 283.5 |
| A | 6 | 10 | 50622 | 173.74 | 1393 | 1366 | 283.5 |
| B | 7 | 202 | 228525 | 846.03 | 1392 | 1348 | 268.5 |
| B | 0 | 245 | 84070 | 308.07 | 1392 | 1348 | 268.5 |
| B | 0 | 229 | 53238 | 193.24 | 1392 | 1348 | 268.5 |
| C | 0 | 10 | 884496 | 2825.38 | 1349 | 1356 | 312.6 |
| C | 15 | 214 | 532180 | 1698.23 | 1349 | 1356 | 312.6 |
| C | 13 | 61 | 8929 | 24.23 | 1349 | 1356 | 312.6 |
| D | 1 | 47 | 4393935 | 15369.27 | 1170 | 1135 | 285.8 |
| D | 2 | 249 | 2900762 | 10145.05 | 1170 | 1135 | 285.8 |
| D | 1 | 52 | 1572648 | 5498.32 | 1170 | 1135 | 285.8 |
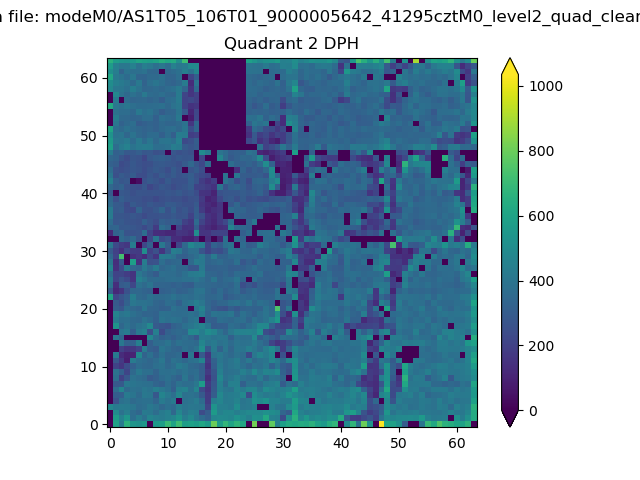
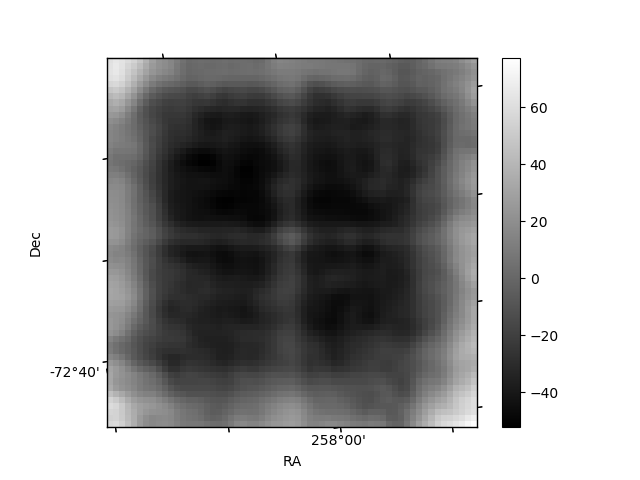
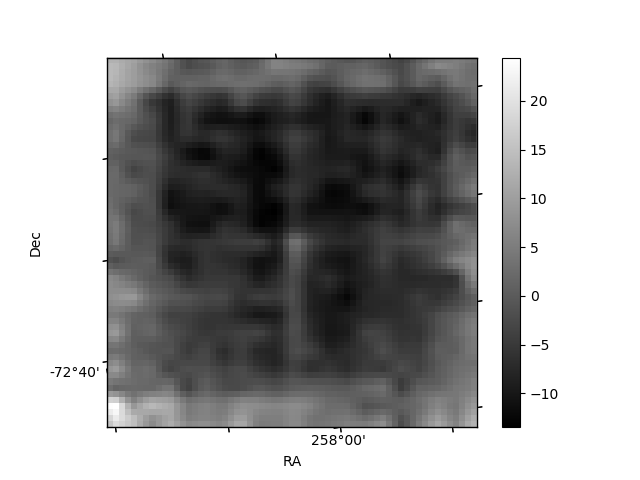
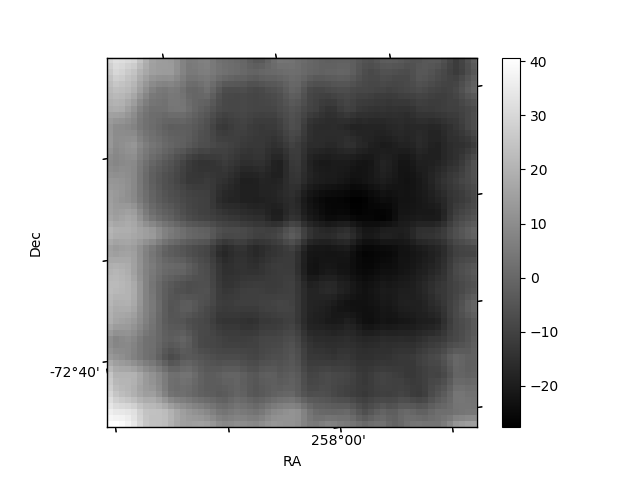
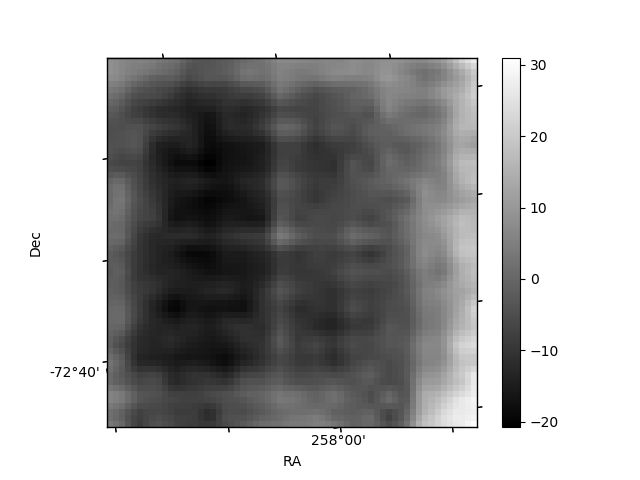
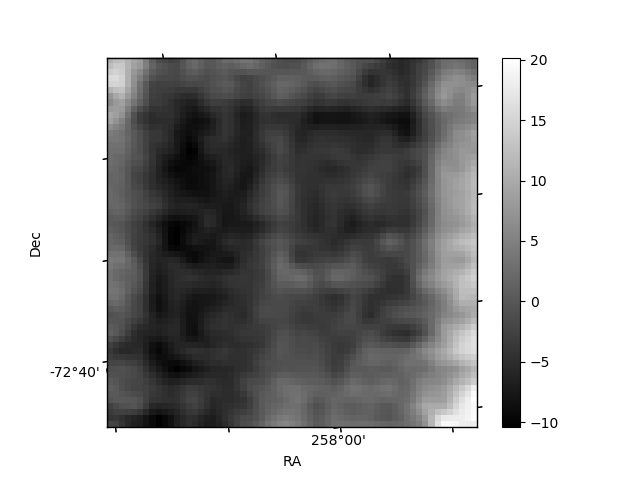
Histogram calculated using DETX and DETY for each event in the final _common_clean file
| Quadrant A | 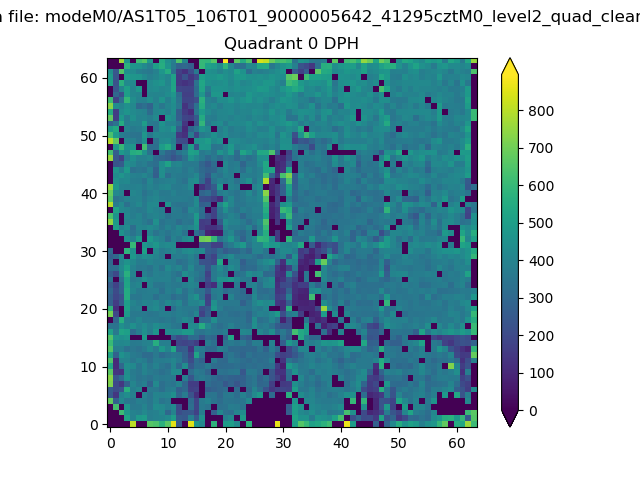 |
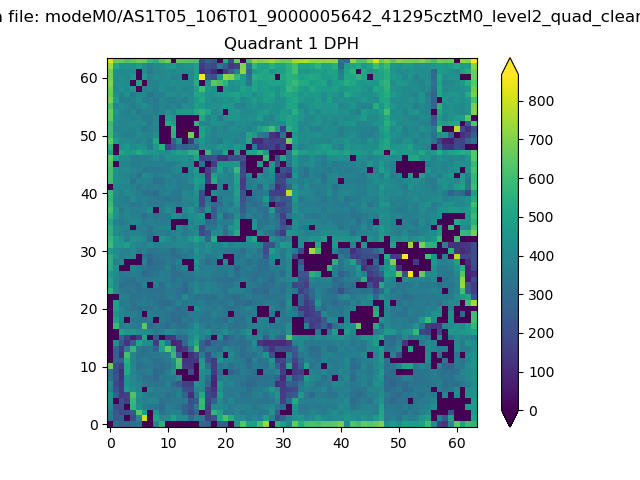 |
Quadrant B |
|---|---|---|---|
| Quadrant D | 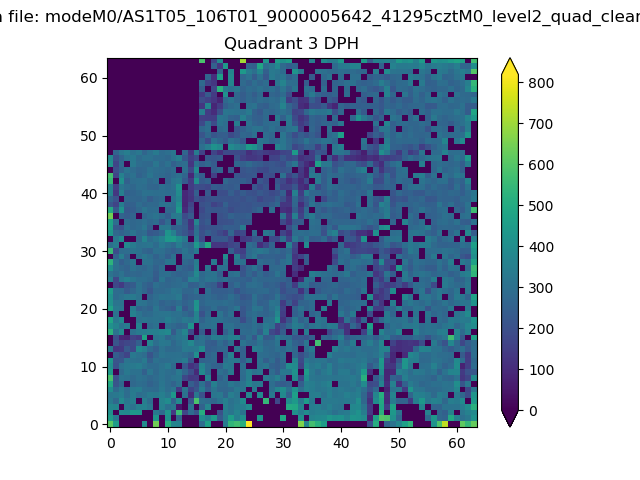 |
 |
Quadrant C |
| Plot type | Count rate plots | Images |
|---|---|---|
| Comparison with Poisson distribution Blue bars denote a histogram of data divided into 1 sec bins. Red curve is a Poisson curve with rate = median count rate of data. |
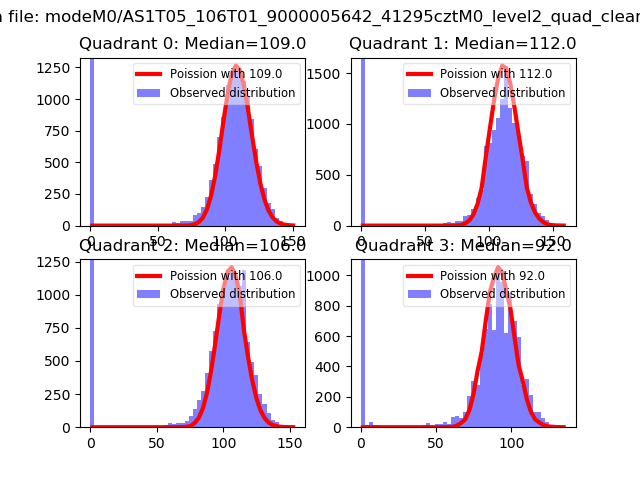 |
 |
| Quadrant-wise count rates Data is divided into 100 sec bins |
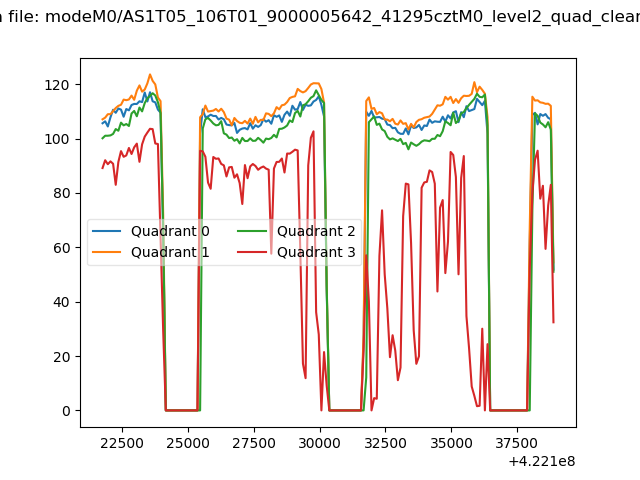 |
|
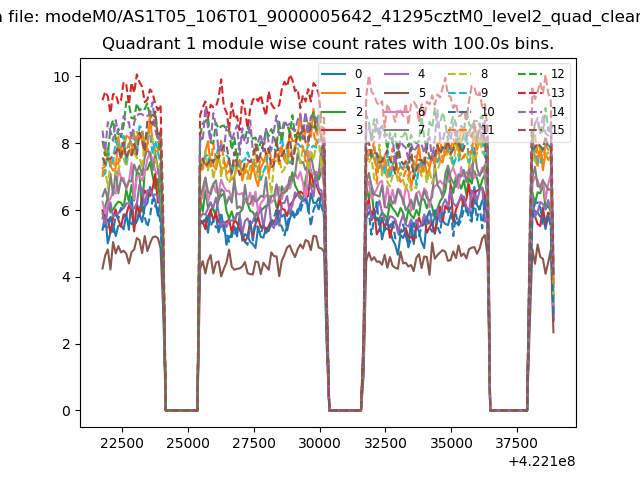
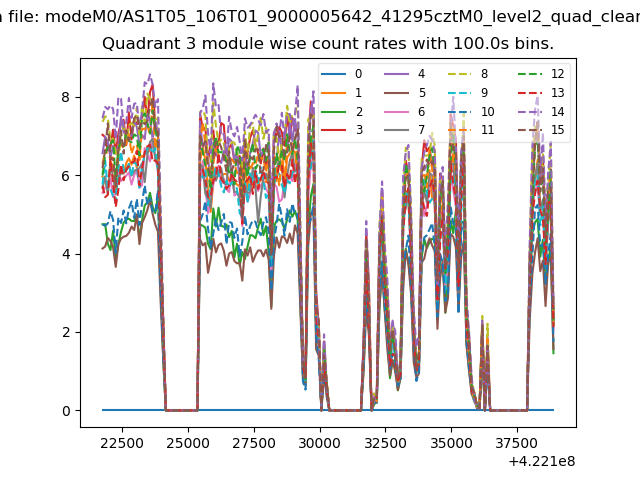
| Module-wise count rates for Quadrant A Data is divided into 100 sec bins |
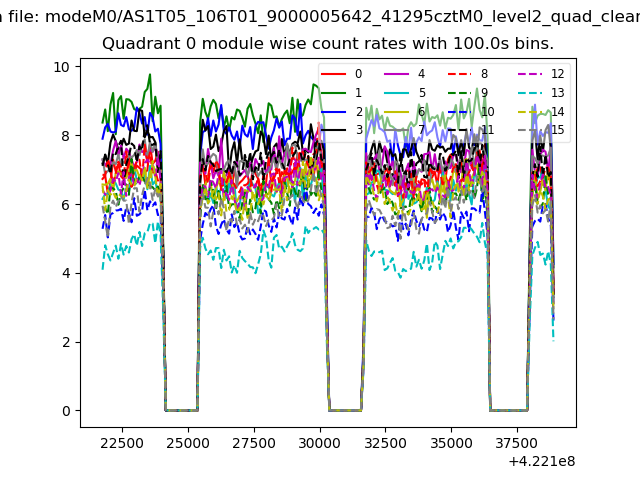 |
 |
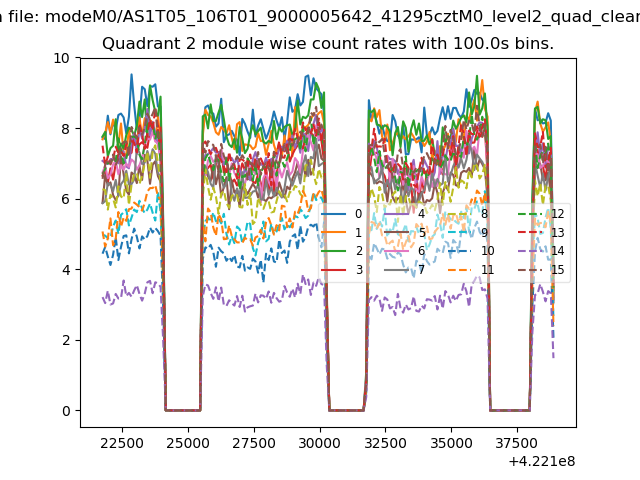
| Module-wise count rates for Quadrant B Data is divided into 100 sec bins |
 |
 |
| Module-wise count rates for Quadrant C Data is divided into 100 sec bins |
 |
 |
| Module-wise count rates for Quadrant D Data is divided into 100 sec bins |
 |
 |
| Parameter | Plot |
|---|---|
| CZT HV Monitor | 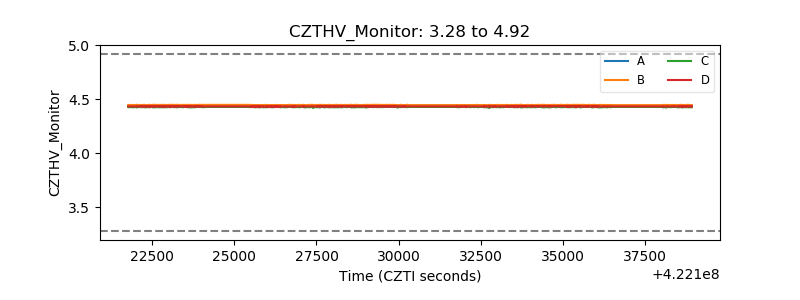 |
| D_VDD | 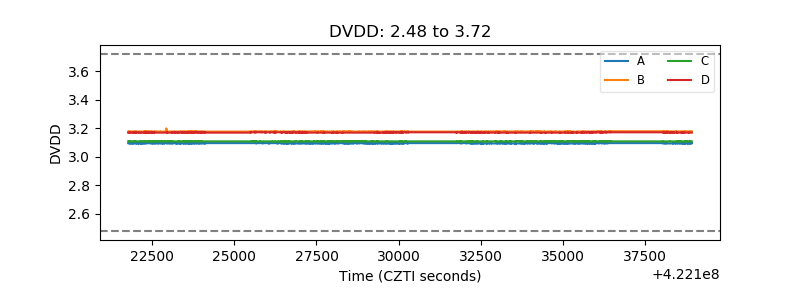 |
| Temperature 1 | 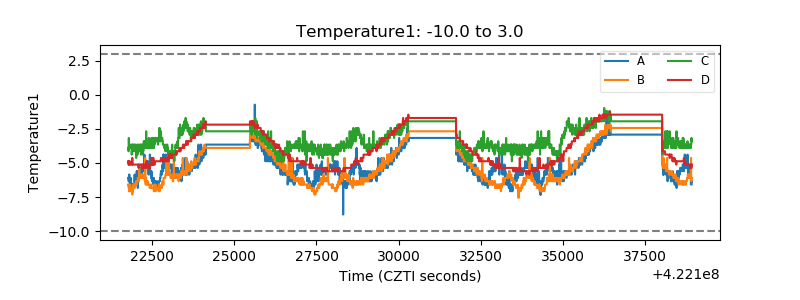 |
| Veto HV Monitor |  |
| Veto LLD | 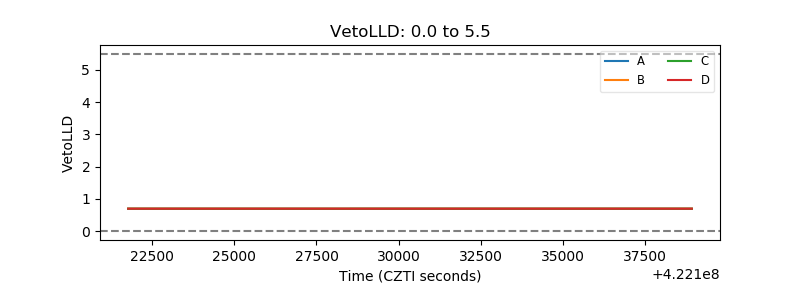 |
| Alpha Counter | 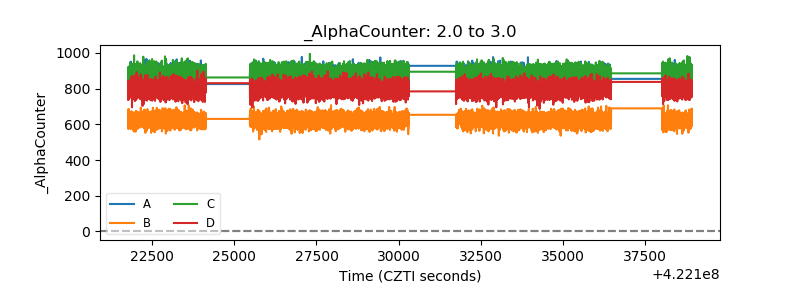 |
| _CPM_Rate | 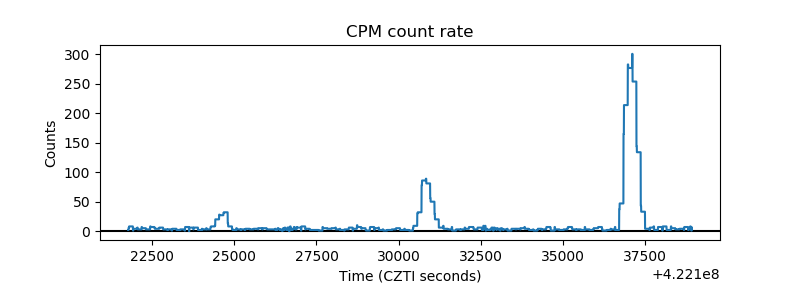 |
| CZT Counter | 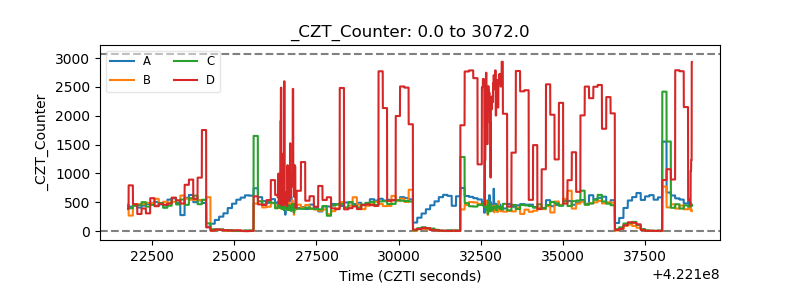 |
| +2.5 Volts monitor | 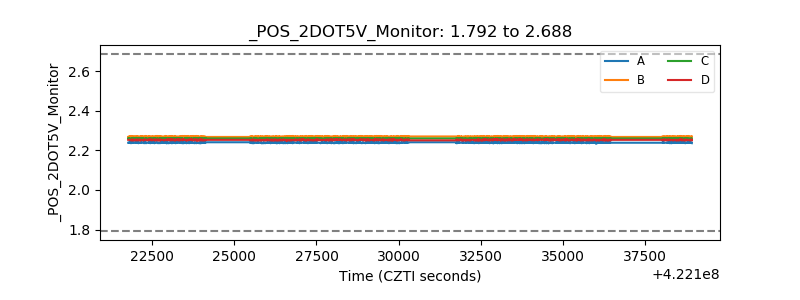 |
| +5 Volts monitor | 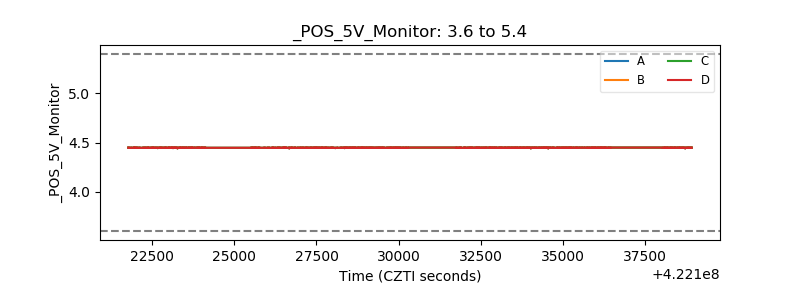 |
| _ROLL_ROT | 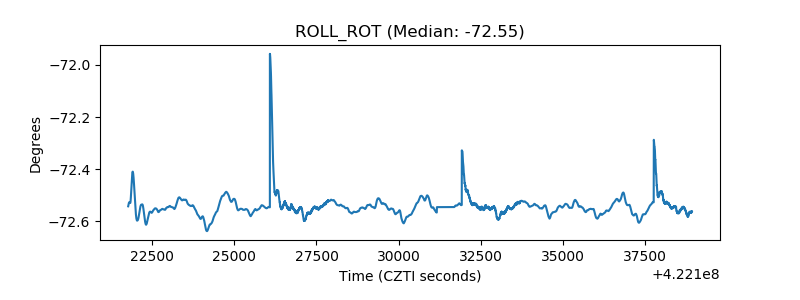 |
| _Roll_DEC | 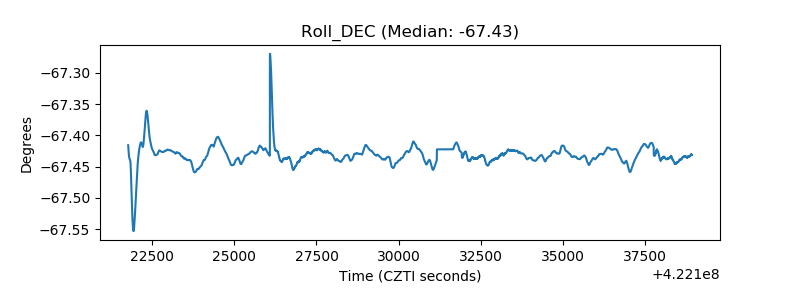 |
| _Roll_RA | 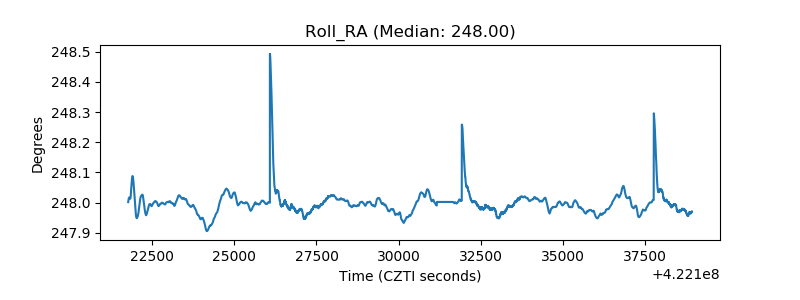 |
| Veto Counter | 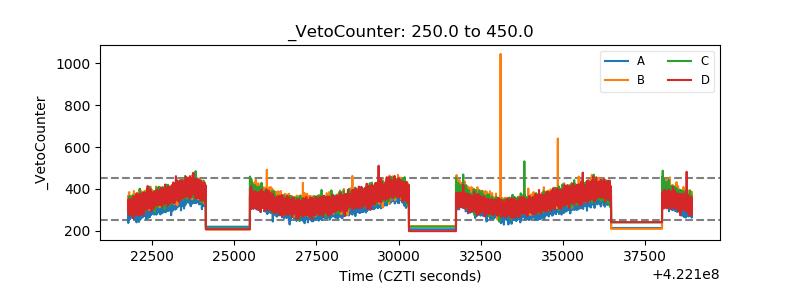 |