| Param | Original file | Final file |
|---|---|---|
| Filename | modeM0/AS1T05_106T01_9000005642_41296cztM0_level2.fits | modeM0/AS1T05_106T01_9000005642_41296cztM0_level2_quad_clean.evt |
| Size (bytes) | 502,384,320 | 82,370,880 |
| Size | 479.1 MB | 78.6 MB |
| Events in quadrant A | 7,506,741 | 399,433 |
| Events in quadrant B | 2,508,266 | 632,556 |
| Events in quadrant C | 3,093,543 | 565,922 |
| Events in quadrant D | 5,054,479 | 506,499 |
| Mode M0 | |||
|---|---|---|---|
| Quadrant | BADHDUFLAG | Total packets | Discarded packets |
| A | 0 | 25877 | 3 |
| B | 0 | 11335 | 2 |
| C | 0 | 12835 | 2 |
| D | 0 | 18848 | 2 |
| Mode SS | |||
|---|---|---|---|
| Quadrant | BADHDUFLAG | Total packets | Discarded packets |
| A | 0 | 112 | 0 |
| B | 0 | 112 | 0 |
| C | 0 | 112 | 0 |
| D | 0 | 112 | 0 |
| Mode M9 | |||
|---|---|---|---|
| Quadrant | BADHDUFLAG | Total packets | Discarded packets |
| A | 0 | 31 | 0 |
| B | 0 | 31 | 0 |
| C | 0 | 31 | 0 |
| D | 0 | 32 | 0 |
| Quadrant | Total seconds | Saturated seconds | Saturation percentage |
|---|---|---|---|
| A | 5574 | 1995 | 35.791173% |
| B | 5574 | 8 | 0.143524% |
| C | 5574 | 221 | 3.964837% |
| D | 5574 | 508 | 9.113742% |
Noise dominated data is calculated using 1-second bins in cleaned event files. If a bin has >2000 counts, and if more than 50% of those come from <1% of pixels, then it is considered to be noise-dominated and hence unusable.
| Quadrant | # 1 sec bins | Bins with >0 counts | Bins with >2000 counts | High rate bins dominated by noise | Noise dominated (total time) | Noise dominated (detector-on time) | Marked lightcurve |
|---|---|---|---|---|---|---|---|
| A | 7248 | 5575 | 1985 | 1985 | 27.39% | 35.61% | 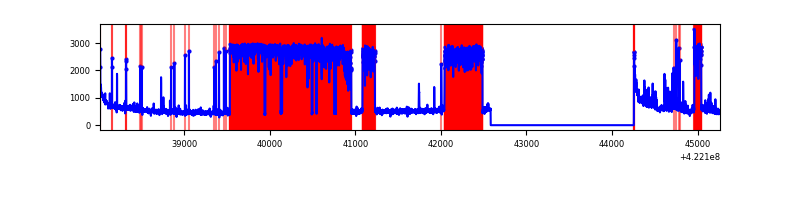 |
| B | 7248 | 5575 | 1 | 1 | 0.01% | 0.02% | 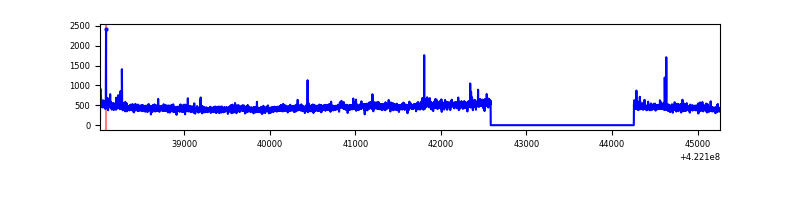 |
| C | 7248 | 5575 | 216 | 216 | 2.98% | 3.87% | 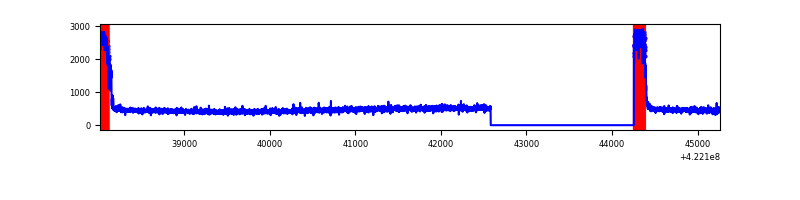 |
| D | 7248 | 5575 | 531 | 531 | 7.33% | 9.52% | 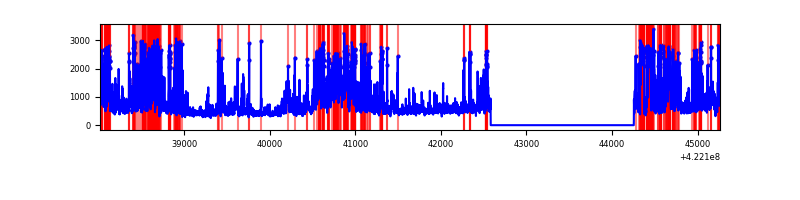 |
Top three noisy pixels from each quadrant. If the there are fewer than three noisy pixels in the level2.evt file, extra rows are filled as -1
| Pixel properties | Quadrant properties | ||||||
|---|---|---|---|---|---|---|---|
| Quadrant | DetID | PixID | Counts | Sigma | Mean | Median | Sigma |
| A | 6 | 10 | 5185618 | 53700.43 | 472 | 463 | 96.6 |
| A | 10 | 83 | 445200 | 4605.95 | 472 | 463 | 96.6 |
| A | 12 | 189 | 42740 | 437.84 | 472 | 463 | 96.6 |
| B | 7 | 202 | 56108 | 476.14 | 599 | 582 | 116.6 |
| B | 0 | 229 | 45986 | 389.35 | 599 | 582 | 116.6 |
| B | 0 | 245 | 24671 | 206.57 | 599 | 582 | 116.6 |
| C | 0 | 10 | 611685 | 4566.96 | 574 | 578 | 133.8 |
| C | 15 | 214 | 234962 | 1751.61 | 574 | 578 | 133.8 |
| C | 3 | 233 | 7705 | 53.26 | 574 | 578 | 133.8 |
| D | 2 | 249 | 736217 | 5347.82 | 561 | 545 | 137.6 |
| D | 5 | 222 | 708761 | 5148.23 | 561 | 545 | 137.6 |
| D | 13 | 249 | 522492 | 3794.19 | 561 | 545 | 137.6 |
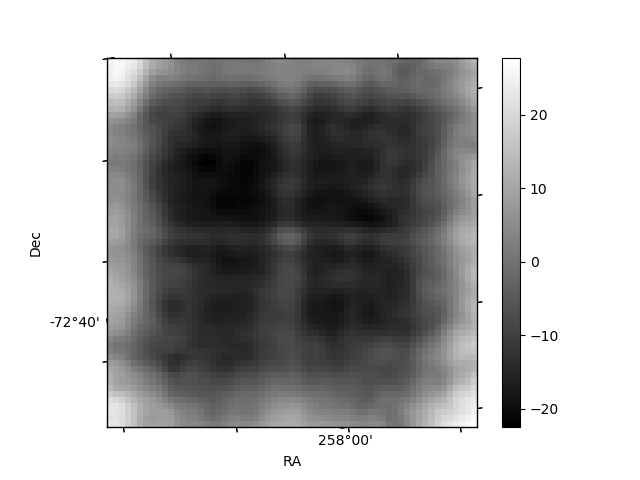
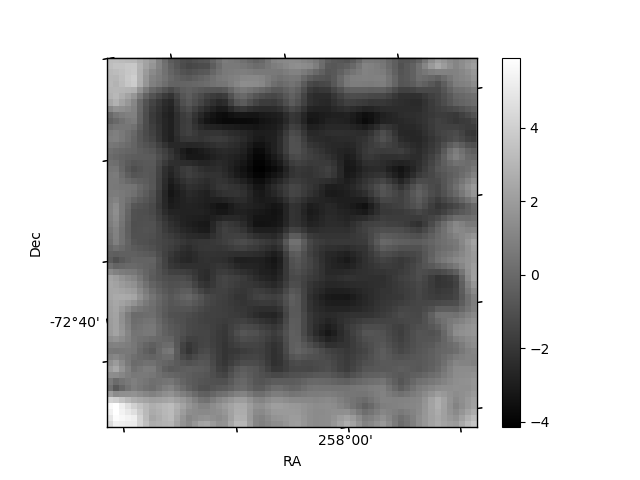
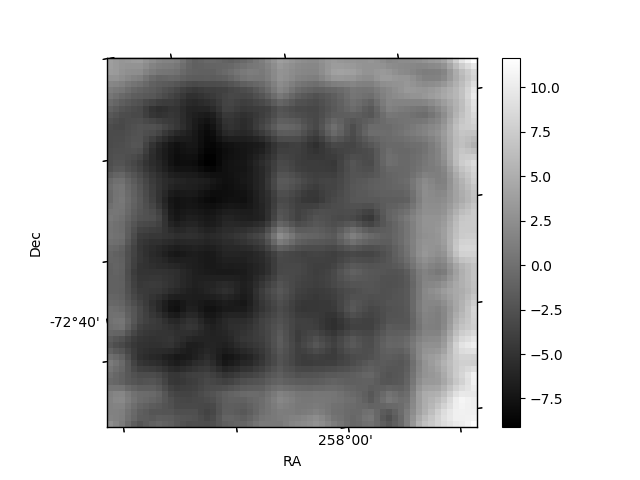
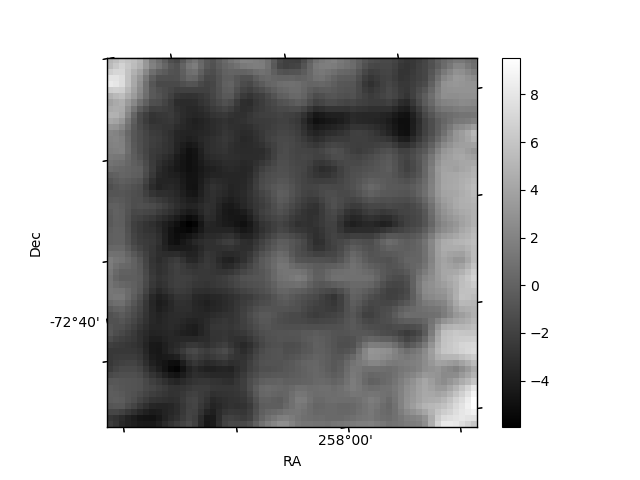
Histogram calculated using DETX and DETY for each event in the final _common_clean file
| Quadrant A | 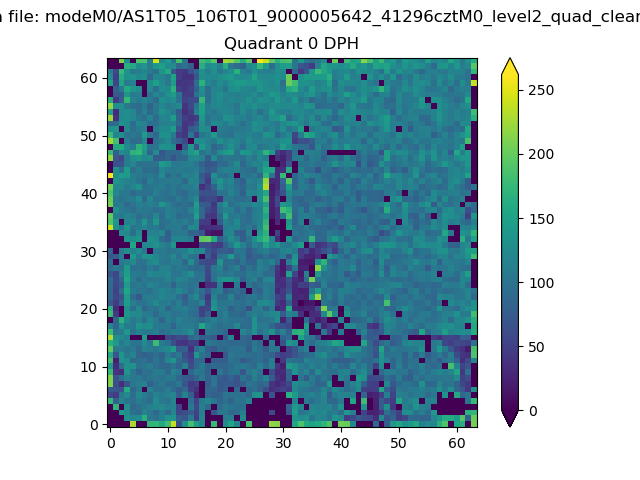 |
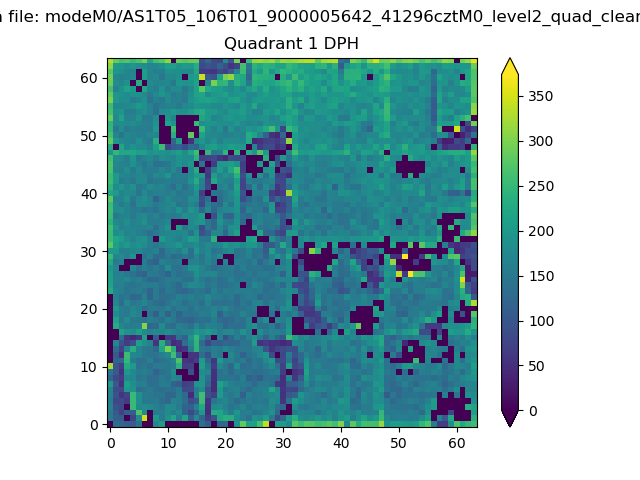 |
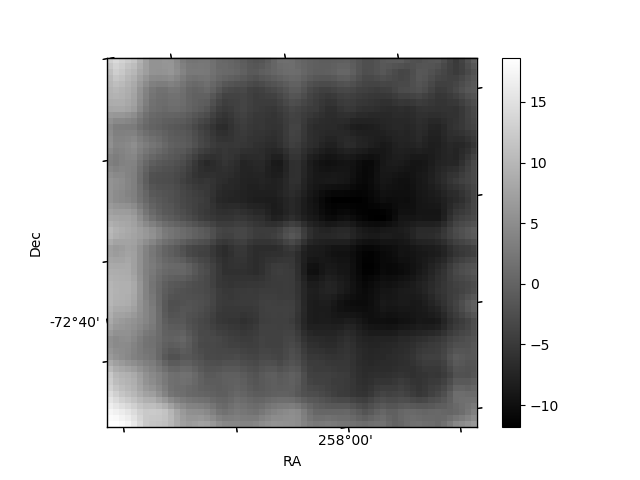
Quadrant B |
|---|---|---|---|
| Quadrant D | 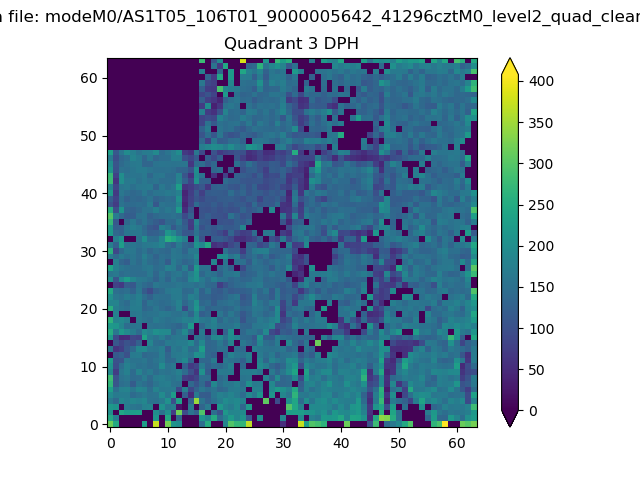 |
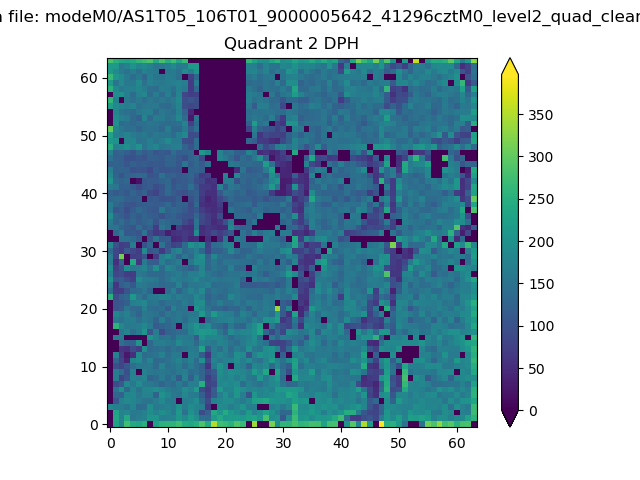 |
Quadrant C |
| Plot type | Count rate plots | Images |
|---|---|---|
| Comparison with Poisson distribution Blue bars denote a histogram of data divided into 1 sec bins. Red curve is a Poisson curve with rate = median count rate of data. |
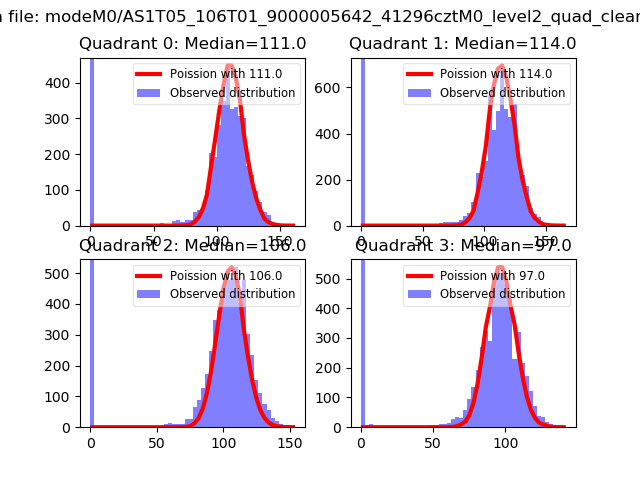 |
 |
| Quadrant-wise count rates Data is divided into 100 sec bins |
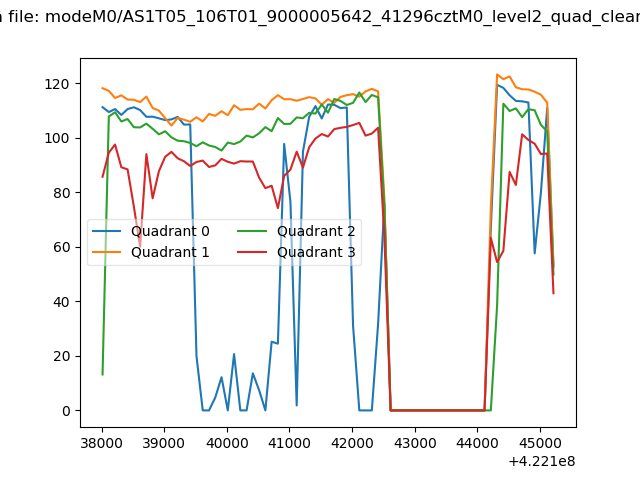 |
|
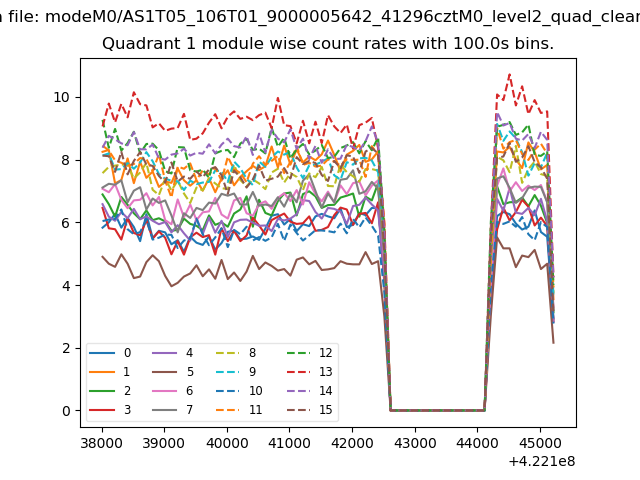
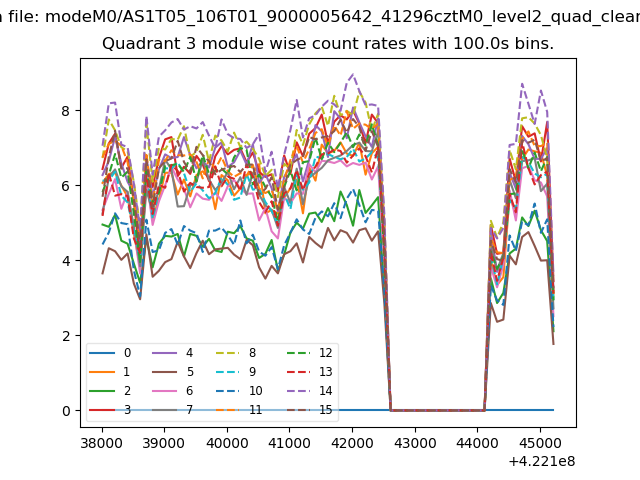
| Module-wise count rates for Quadrant A Data is divided into 100 sec bins |
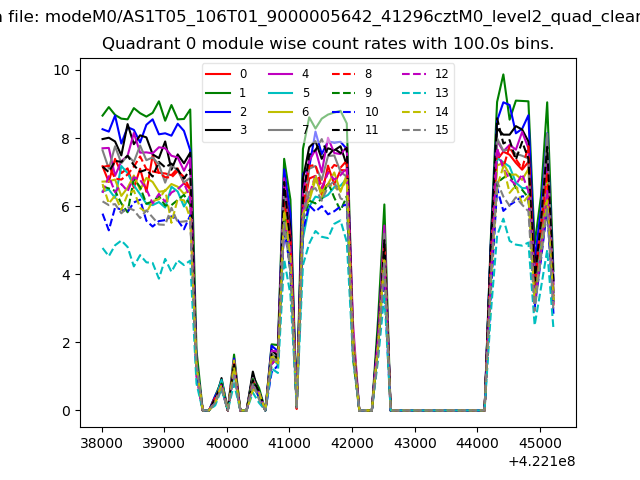 |
 |
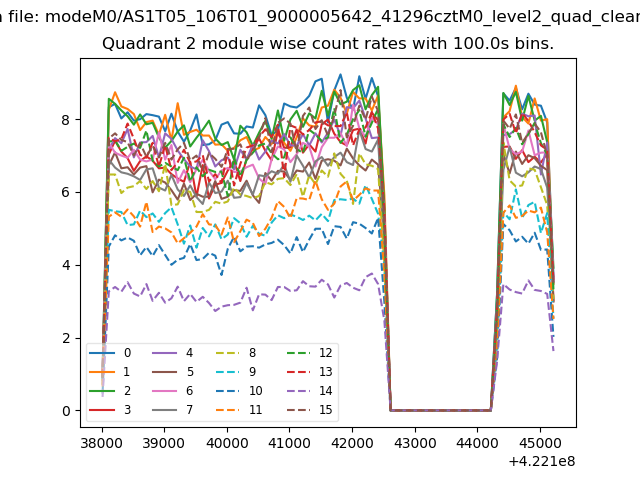
| Module-wise count rates for Quadrant B Data is divided into 100 sec bins |
 |
 |
| Module-wise count rates for Quadrant C Data is divided into 100 sec bins |
 |
 |
| Module-wise count rates for Quadrant D Data is divided into 100 sec bins |
 |
 |
| Parameter | Plot |
|---|---|
| CZT HV Monitor | 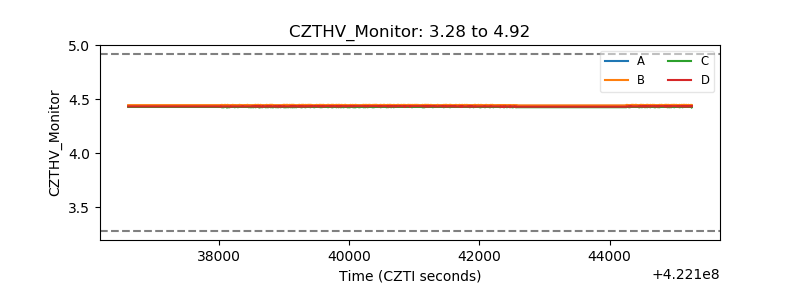 |
| D_VDD | 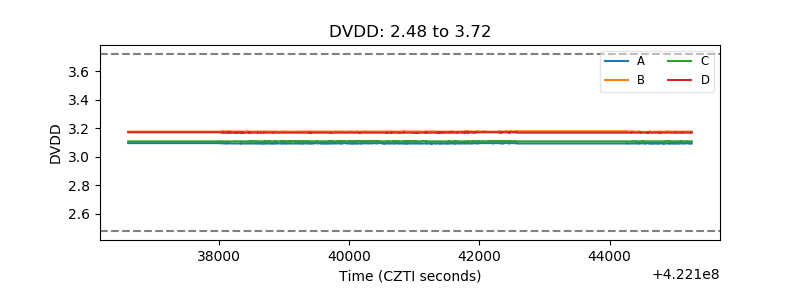 |
| Temperature 1 | 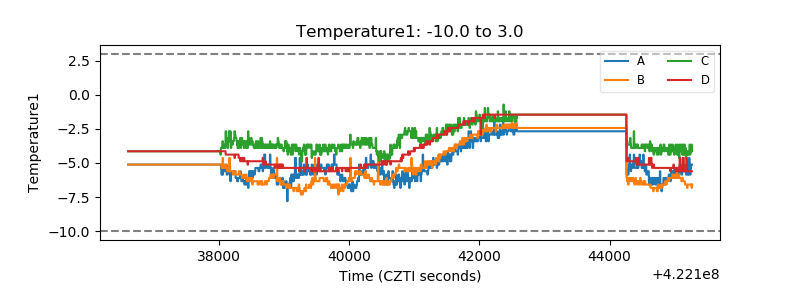 |
| Veto HV Monitor | 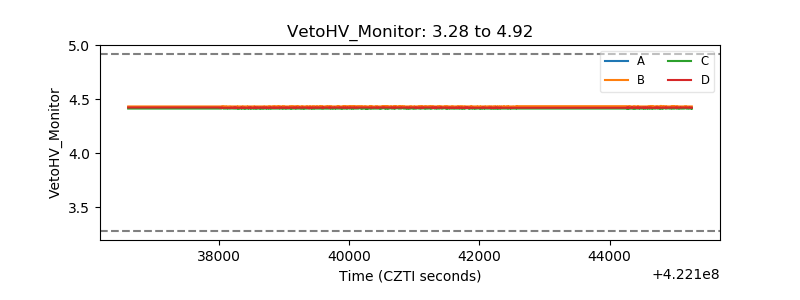 |
| Veto LLD | 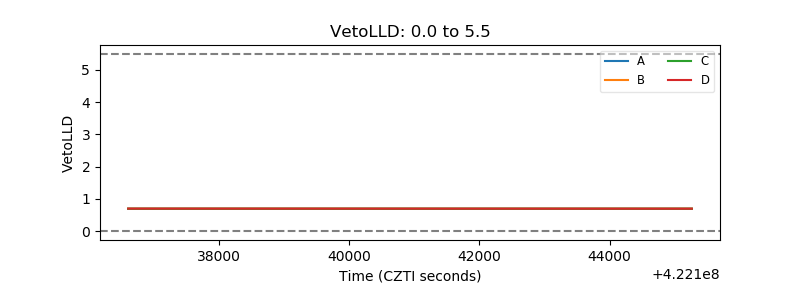 |
| Alpha Counter | 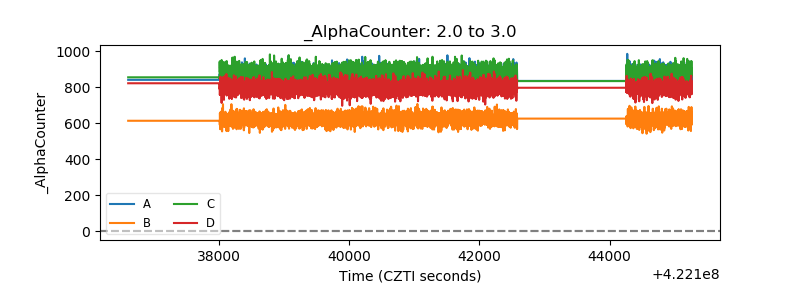 |
| _CPM_Rate | 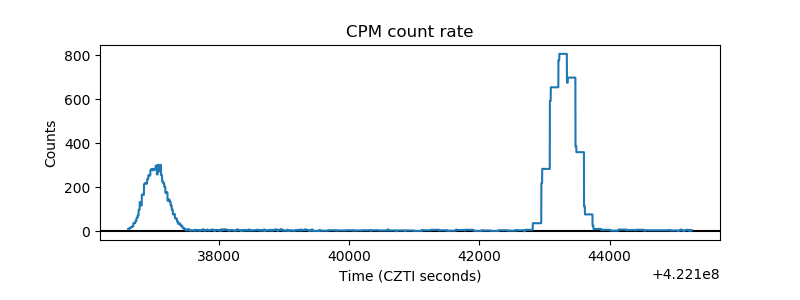 |
| CZT Counter | 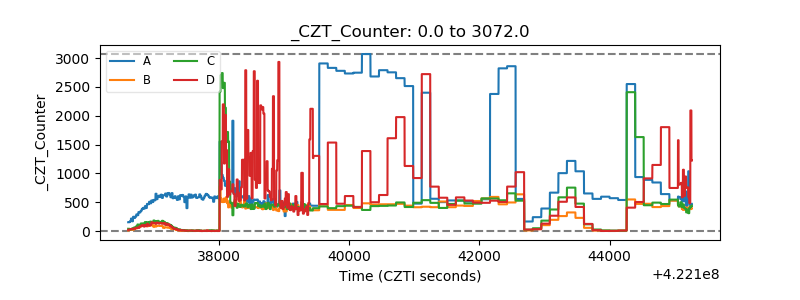 |
| +2.5 Volts monitor | 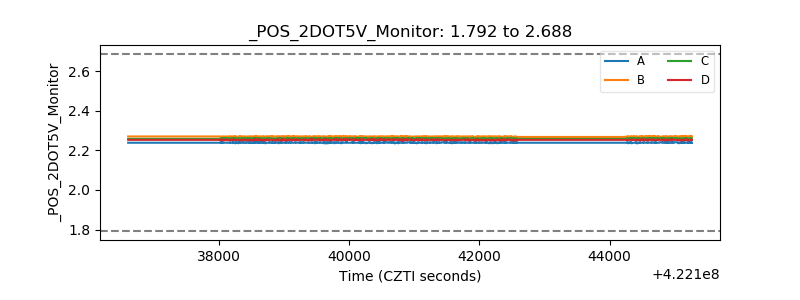 |
| +5 Volts monitor | 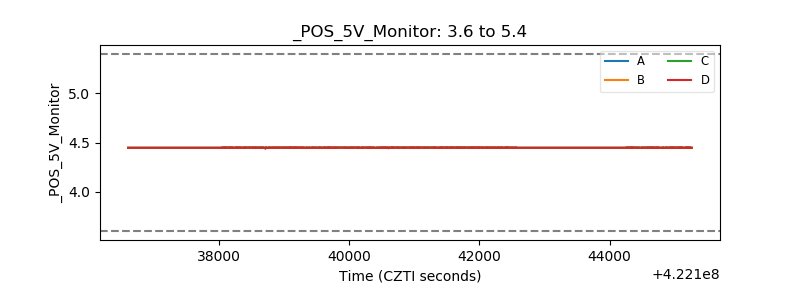 |
| _ROLL_ROT | 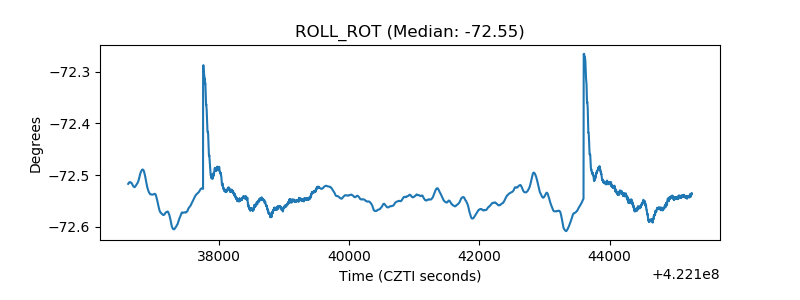 |
| _Roll_DEC | 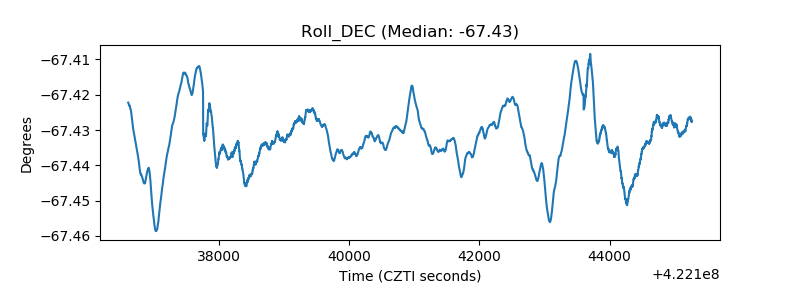 |
| _Roll_RA | 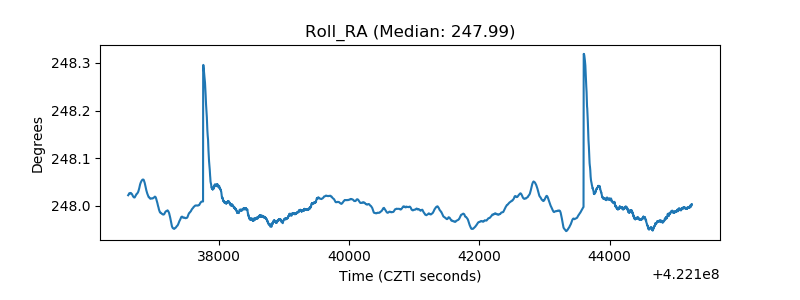 |
| Veto Counter | 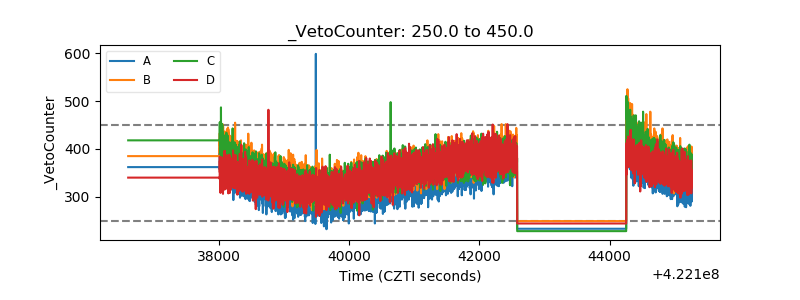 |