| Param | Original file | Final file |
|---|---|---|
| Filename | modeM0/AS1T05_106T01_9000005642_41298cztM0_level2.fits | modeM0/AS1T05_106T01_9000005642_41298cztM0_level2_quad_clean.evt |
| Size (bytes) | 402,704,640 | 88,989,120 |
| Size | 384.0 MB | 84.9 MB |
| Events in quadrant A | 3,411,902 | 599,809 |
| Events in quadrant B | 2,449,315 | 639,006 |
| Events in quadrant C | 3,203,329 | 568,329 |
| Events in quadrant D | 5,417,318 | 505,022 |
| Mode M0 | |||
|---|---|---|---|
| Quadrant | BADHDUFLAG | Total packets | Discarded packets |
| A | 0 | 13525 | 3 |
| B | 0 | 11078 | 2 |
| C | 0 | 12907 | 2 |
| D | 0 | 19791 | 2 |
| Mode SS | |||
|---|---|---|---|
| Quadrant | BADHDUFLAG | Total packets | Discarded packets |
| A | 0 | 112 | 0 |
| B | 0 | 112 | 0 |
| C | 0 | 112 | 0 |
| D | 0 | 112 | 0 |
| Mode M9 | |||
|---|---|---|---|
| Quadrant | BADHDUFLAG | Total packets | Discarded packets |
| A | 0 | 28 | 0 |
| B | 0 | 28 | 0 |
| C | 0 | 28 | 0 |
| D | 0 | 29 | 0 |
| Quadrant | Total seconds | Saturated seconds | Saturation percentage |
|---|---|---|---|
| A | 5463 | 121 | 2.214900% |
| B | 5463 | 6 | 0.109830% |
| C | 5463 | 273 | 4.997254% |
| D | 5463 | 576 | 10.543657% |
Noise dominated data is calculated using 1-second bins in cleaned event files. If a bin has >2000 counts, and if more than 50% of those come from <1% of pixels, then it is considered to be noise-dominated and hence unusable.
| Quadrant | # 1 sec bins | Bins with >0 counts | Bins with >2000 counts | High rate bins dominated by noise | Noise dominated (total time) | Noise dominated (detector-on time) | Marked lightcurve |
|---|---|---|---|---|---|---|---|
| A | 7257 | 5464 | 116 | 116 | 1.60% | 2.12% | 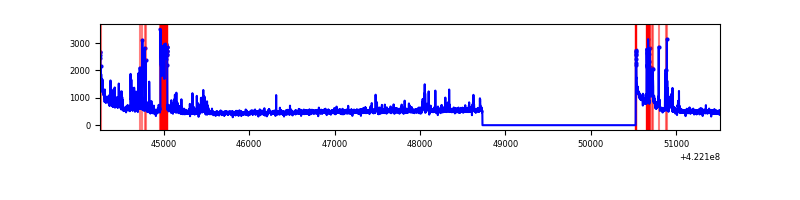 |
| B | 7257 | 5464 | 0 | 0 | 0.00% | 0.00% | 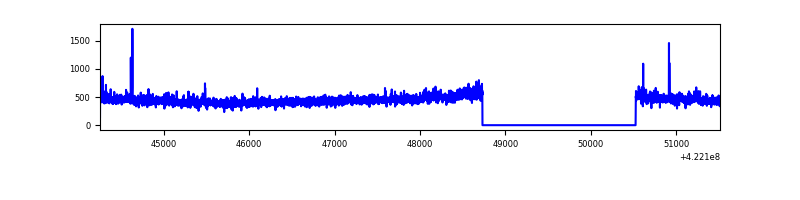 |
| C | 7257 | 5464 | 265 | 265 | 3.65% | 4.85% | 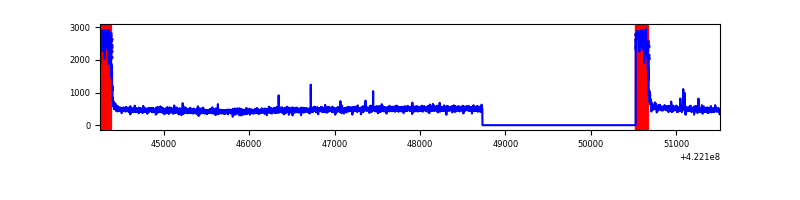 |
| D | 7257 | 5464 | 557 | 557 | 7.68% | 10.19% | 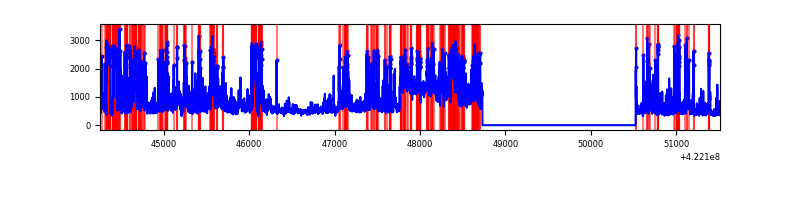 |
Top three noisy pixels from each quadrant. If the there are fewer than three noisy pixels in the level2.evt file, extra rows are filled as -1
| Pixel properties | Quadrant properties | ||||||
|---|---|---|---|---|---|---|---|
| Quadrant | DetID | PixID | Counts | Sigma | Mean | Median | Sigma |
| A | 6 | 10 | 582626 | 4862.25 | 586 | 574 | 119.7 |
| A | 10 | 83 | 504868 | 4212.69 | 586 | 574 | 119.7 |
| A | 12 | 189 | 55059 | 455.15 | 586 | 574 | 119.7 |
| B | 7 | 202 | 48882 | 419.47 | 596 | 579 | 115.2 |
| B | 0 | 229 | 26355 | 223.84 | 596 | 579 | 115.2 |
| B | 12 | 111 | 14866 | 124.07 | 596 | 579 | 115.2 |
| C | 0 | 10 | 732048 | 5505.17 | 569 | 572 | 132.9 |
| C | 15 | 214 | 229727 | 1724.64 | 569 | 572 | 132.9 |
| C | 3 | 233 | 12637 | 90.8 | 569 | 572 | 132.9 |
| D | 2 | 249 | 985716 | 7268.8 | 557 | 542 | 135.5 |
| D | 2 | 120 | 872561 | 6433.92 | 557 | 542 | 135.5 |
| D | 1 | 52 | 431393 | 3178.9 | 557 | 542 | 135.5 |
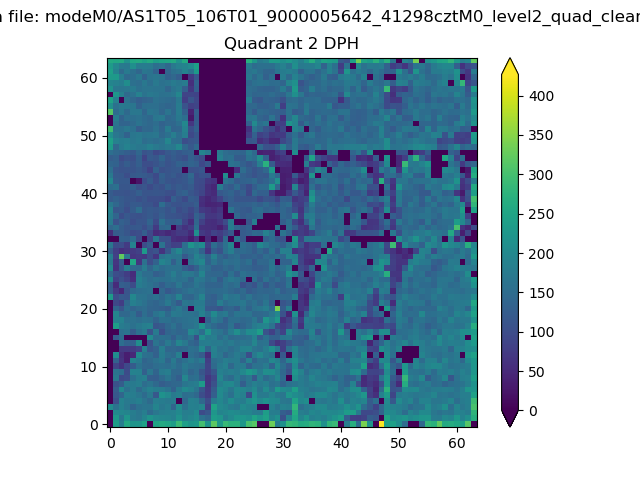
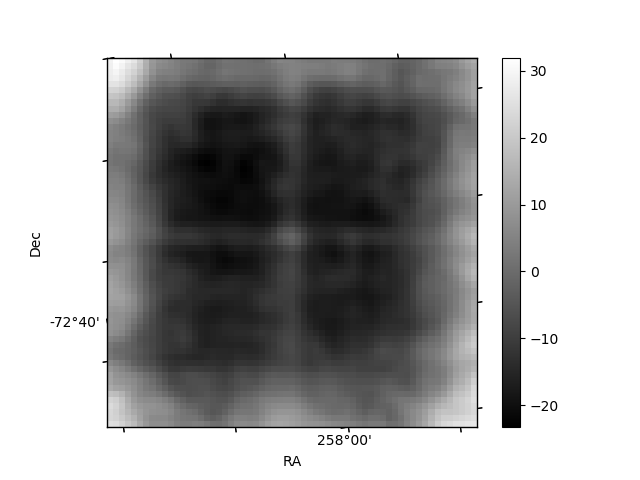
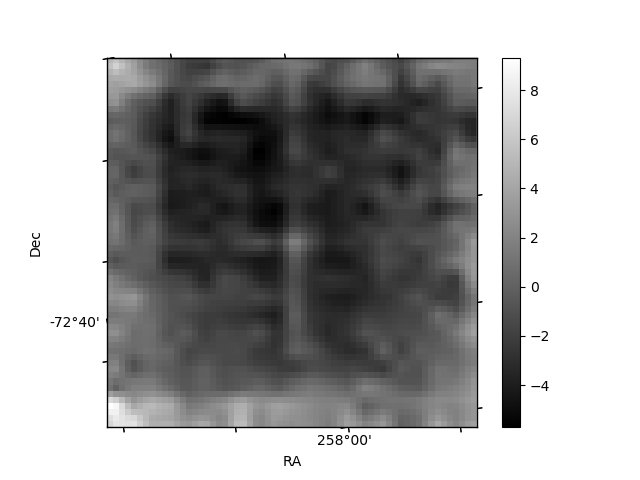
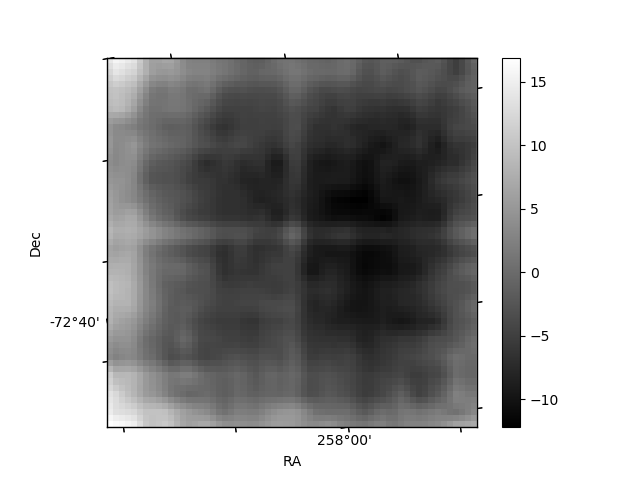
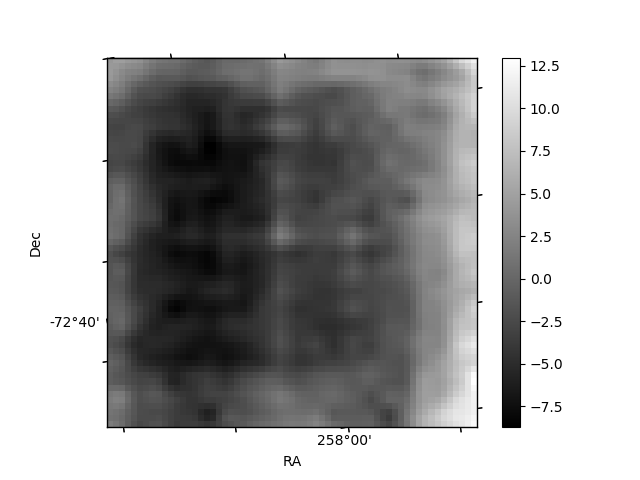
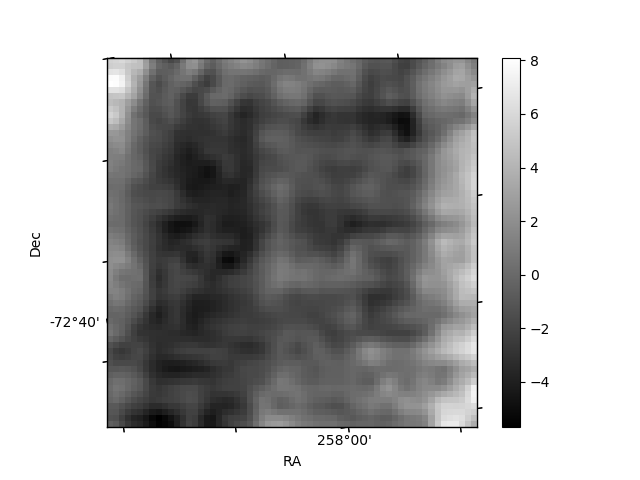
Histogram calculated using DETX and DETY for each event in the final _common_clean file
| Quadrant A | 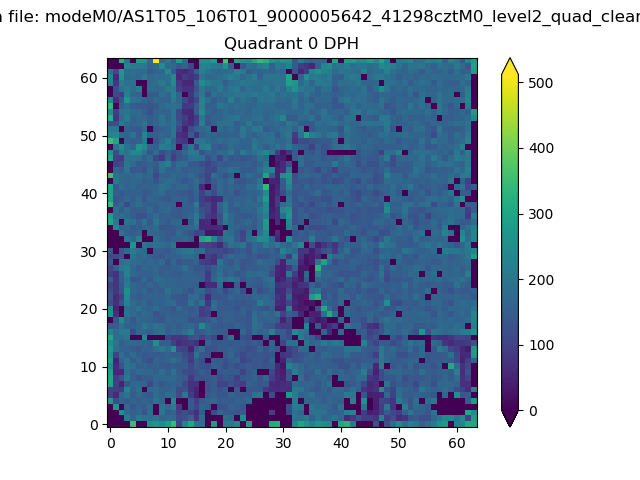 |
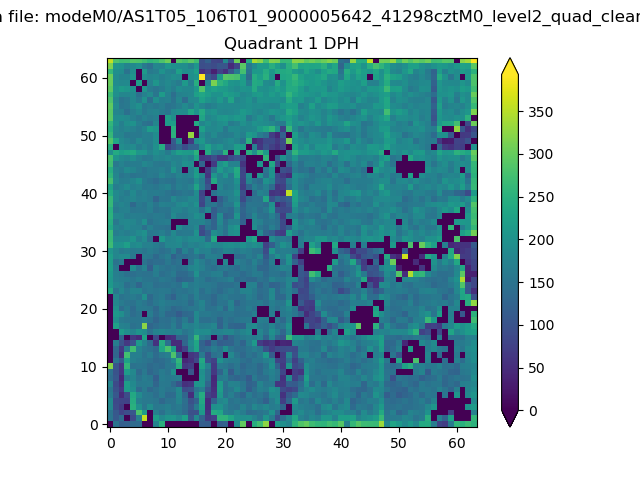 |
Quadrant B |
|---|---|---|---|
| Quadrant D | 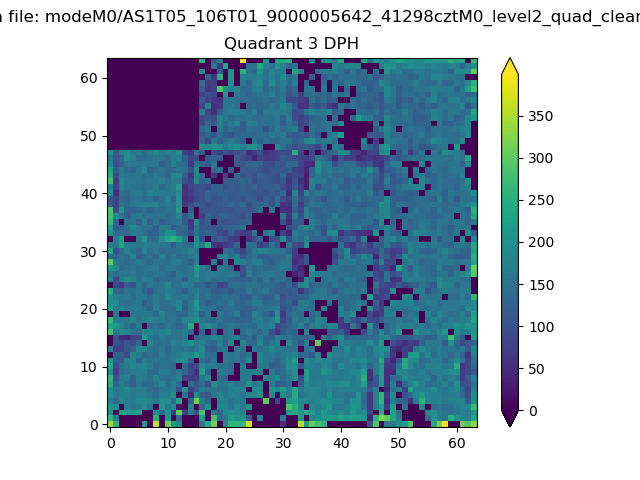 |
 |
Quadrant C |
| Plot type | Count rate plots | Images |
|---|---|---|
| Comparison with Poisson distribution Blue bars denote a histogram of data divided into 1 sec bins. Red curve is a Poisson curve with rate = median count rate of data. |
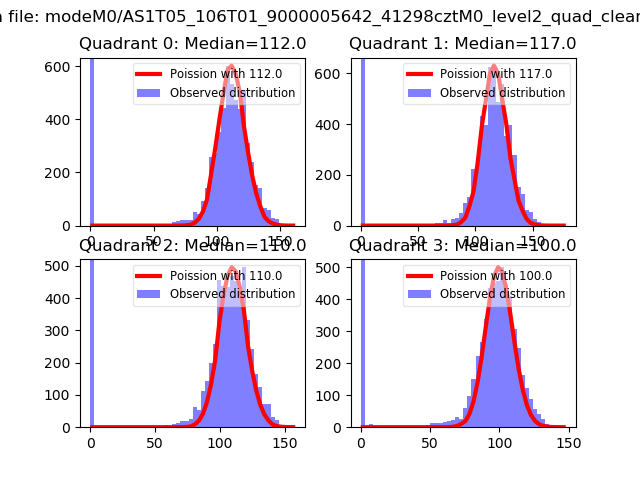 |
 |
| Quadrant-wise count rates Data is divided into 100 sec bins |
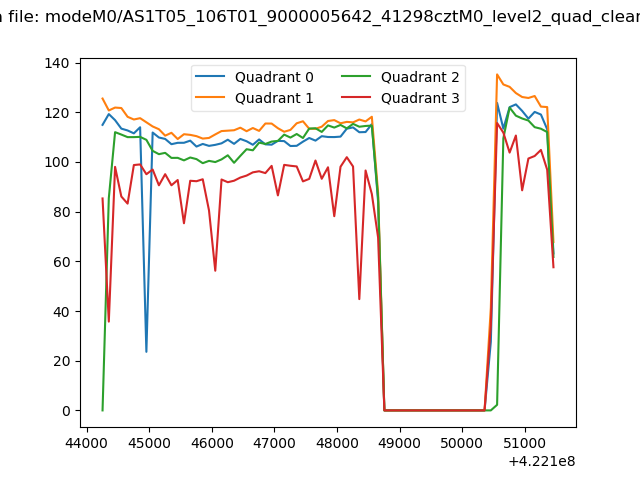 |
|
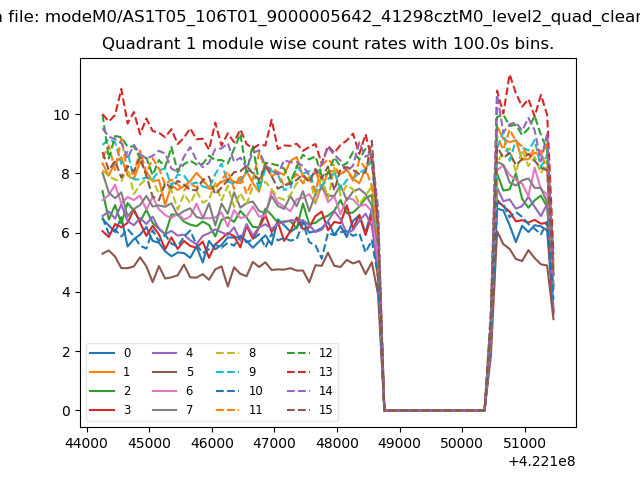
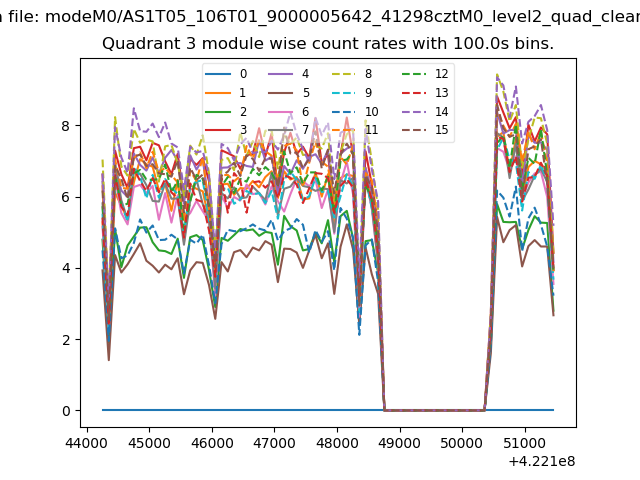
| Module-wise count rates for Quadrant A Data is divided into 100 sec bins |
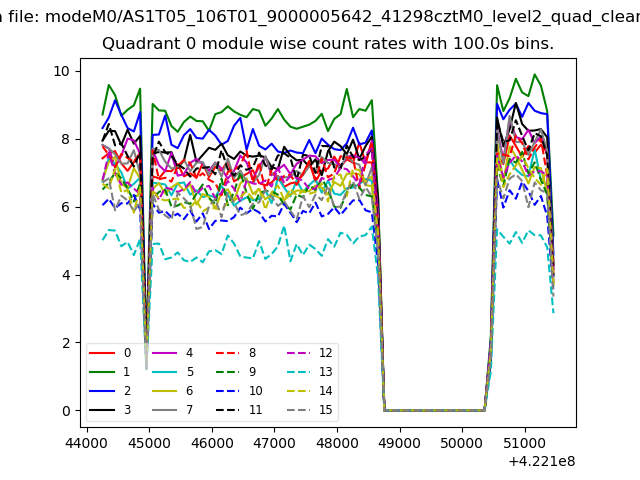 |
 |
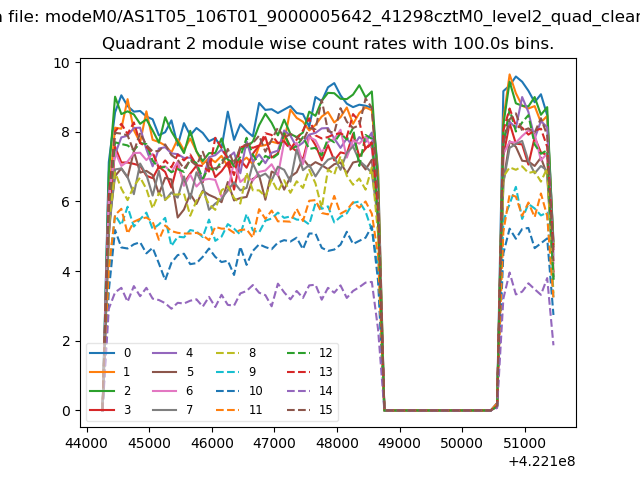
| Module-wise count rates for Quadrant B Data is divided into 100 sec bins |
 |
 |
| Module-wise count rates for Quadrant C Data is divided into 100 sec bins |
 |
 |
| Module-wise count rates for Quadrant D Data is divided into 100 sec bins |
 |
 |
| Parameter | Plot |
|---|---|
| CZT HV Monitor | 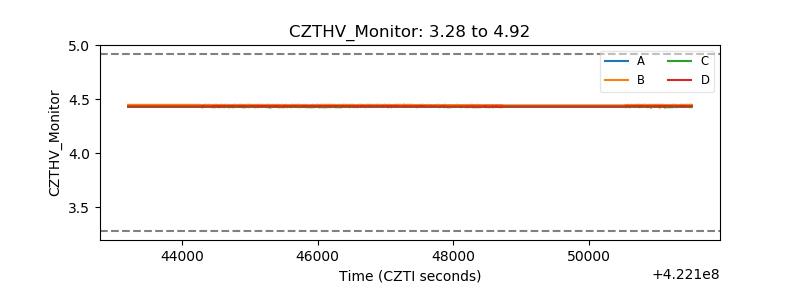 |
| D_VDD | 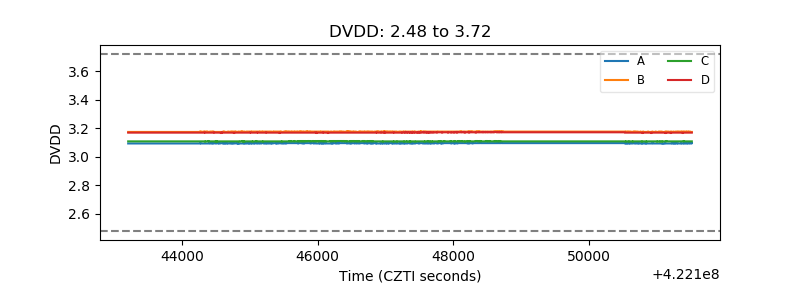 |
| Temperature 1 | 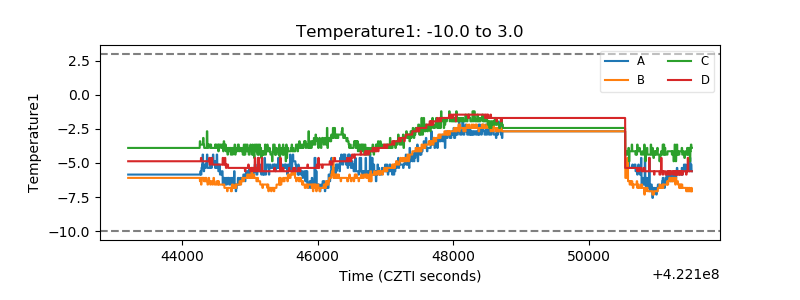 |
| Veto HV Monitor | 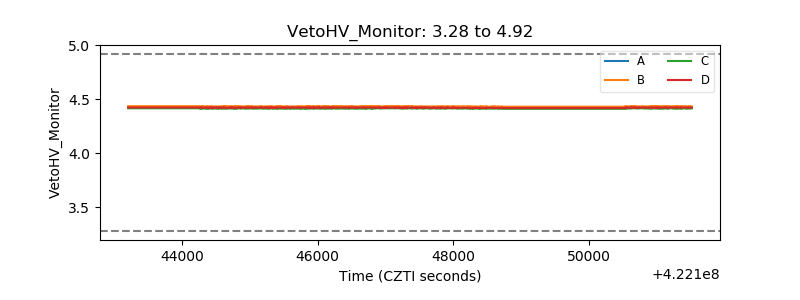 |
| Veto LLD | 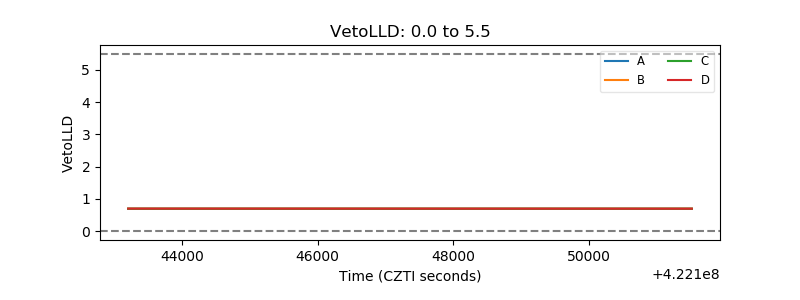 |
| Alpha Counter | 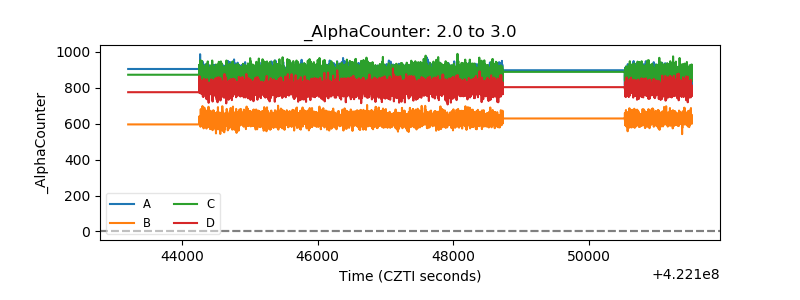 |
| _CPM_Rate | 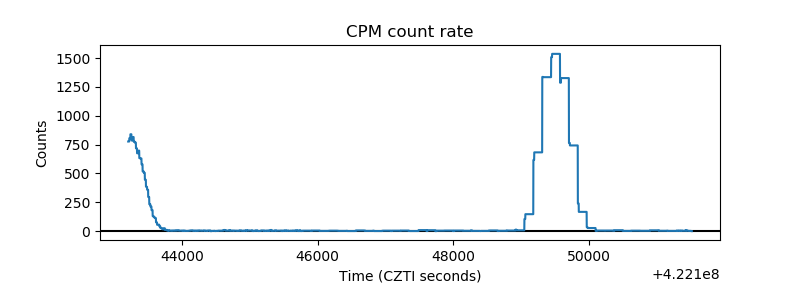 |
| CZT Counter | 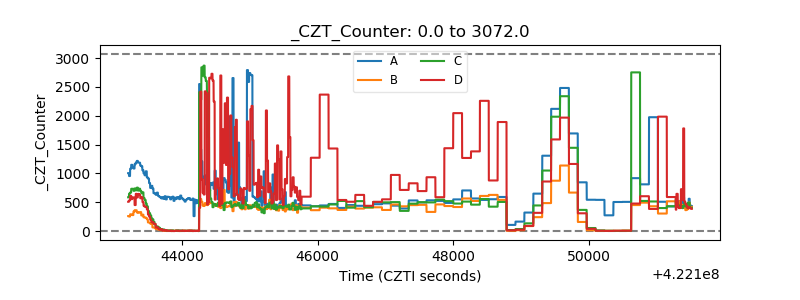 |
| +2.5 Volts monitor | 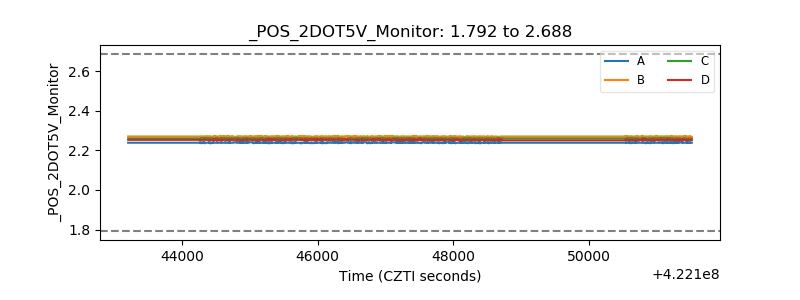 |
| +5 Volts monitor | 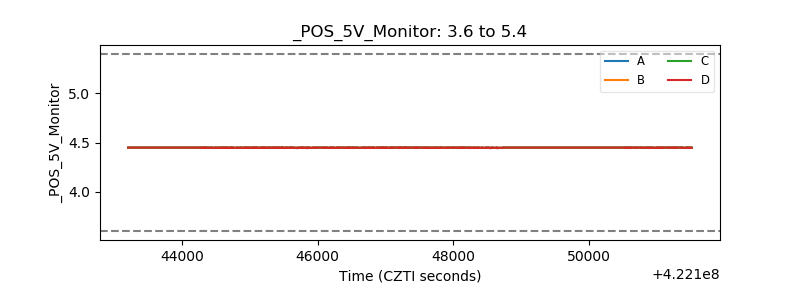 |
| _ROLL_ROT | 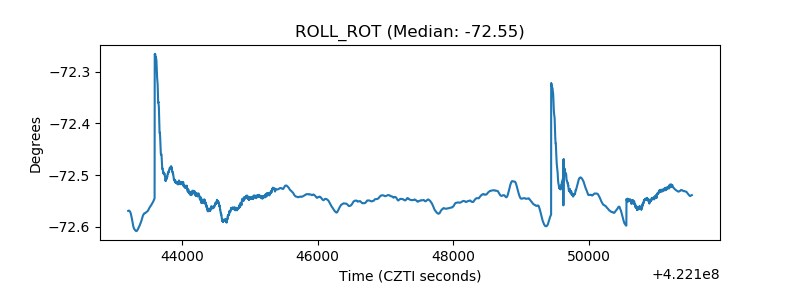 |
| _Roll_DEC | 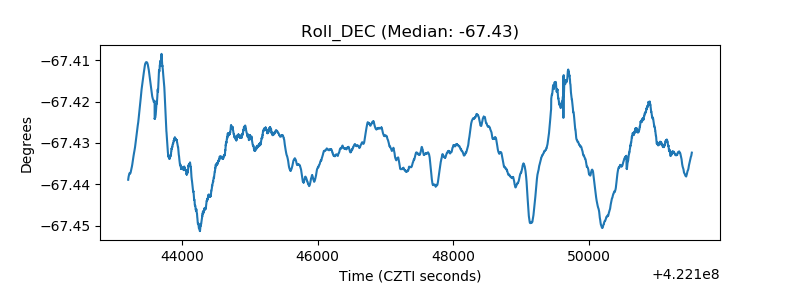 |
| _Roll_RA | 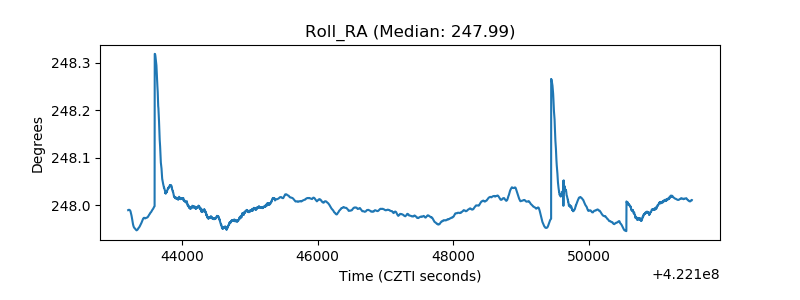 |
| Veto Counter | 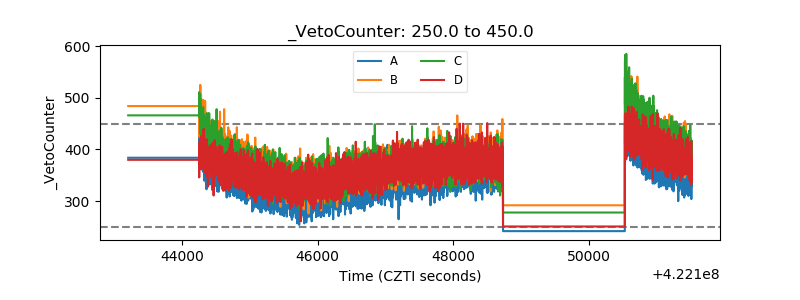 |